. 2024 Jan 10;32(1):200758.
doi: 10.1016/j.omton.2023.200758. eCollection 2024 Mar 21.

Mediation of antitumor activity by AZD4820 oncolytic vaccinia virus encoding IL-12

Affiliations

Mediation of antitumor activity by AZD4820 oncolytic vaccinia virus encoding IL-12

Cheyne Kurokawa et al. Mol Ther Oncol. .

Abstract

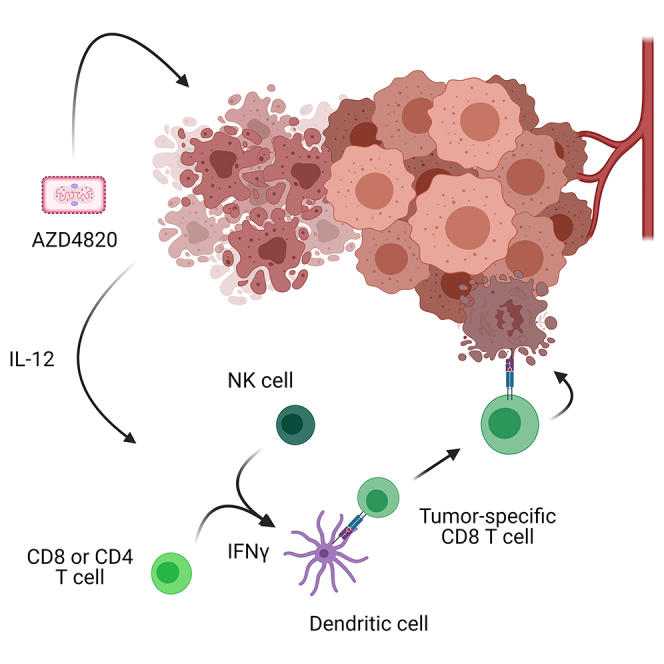
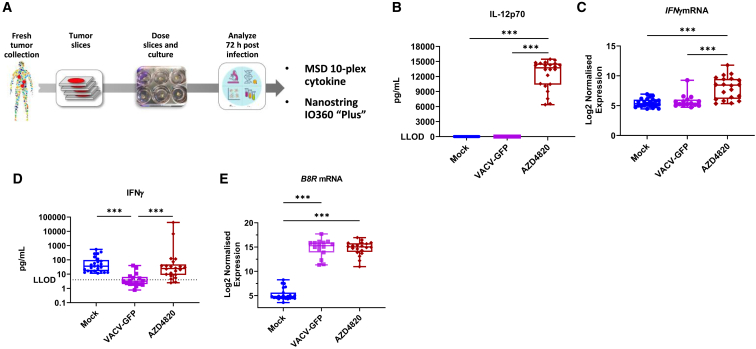
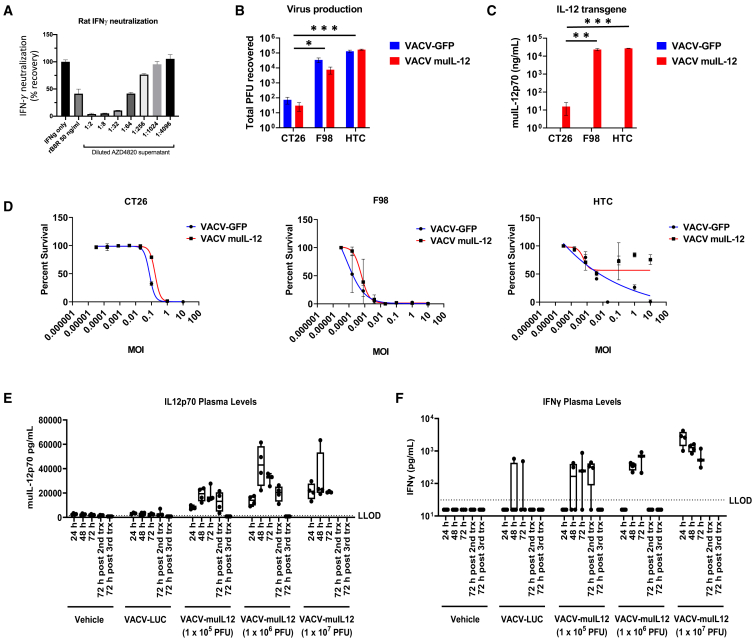
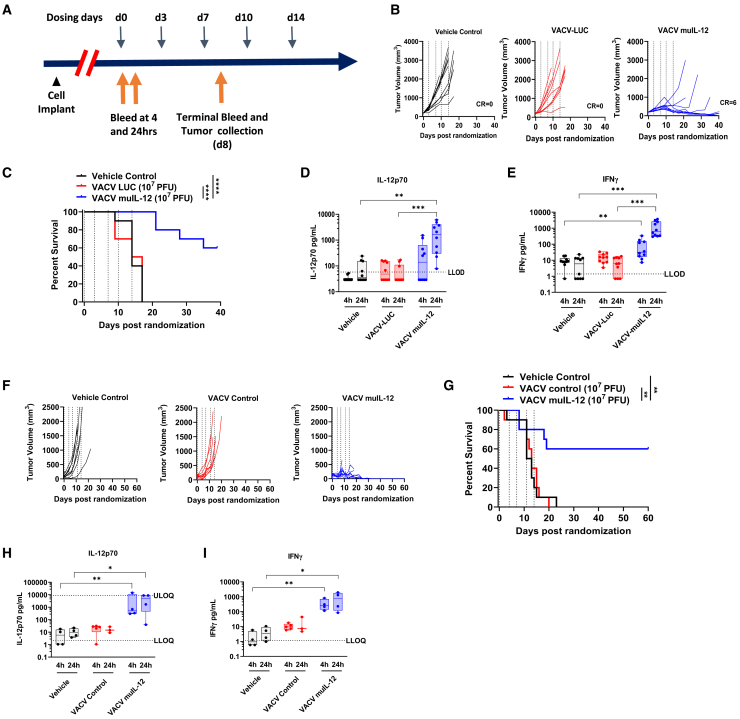
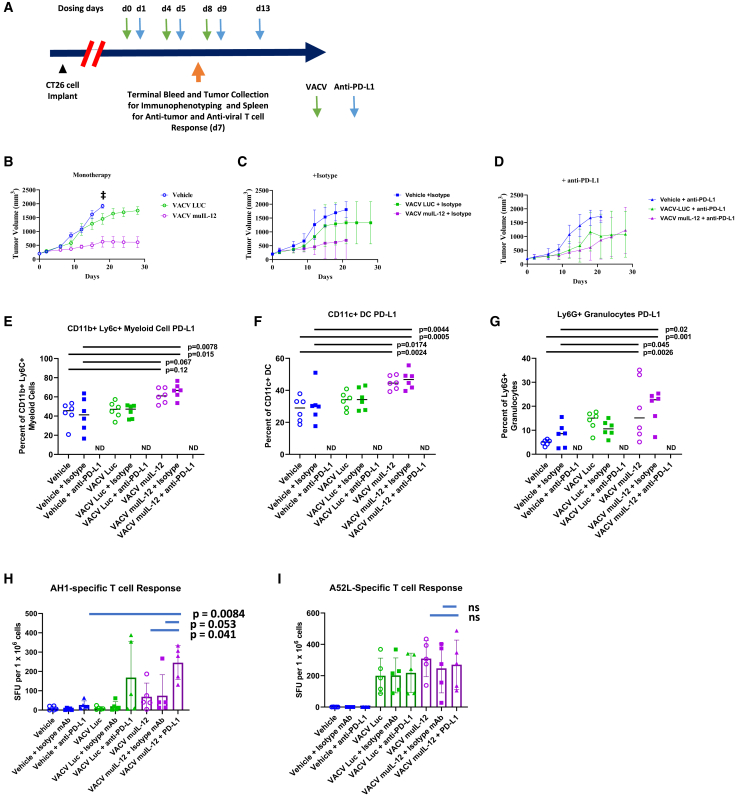
Oncolytic viruses are engineered to selectively kill tumor cells and have demonstrated promising results in early-phase clinical trials. To further modulate the innate and adaptive immune system, we generated AZD4820, a vaccinia virus engineered to express interleukin-12 (IL-12), a potent cytokine involved in the activation of natural killer (NK) and T cells and the reprogramming of the tumor immune microenvironment. Testing in cultured human tumor cell lines demonstrated broad in vitro oncolytic activity and IL-12 transgene expression. A surrogate virus expressing murine IL-12 demonstrated antitumor activity in both MC38 and CT26 mouse syngeneic tumor models that responded poorly to immune checkpoint inhibition. In both models, AZD4820 significantly upregulated interferon-gamma (IFN-γ) relative to control mice treated with oncolytic vaccinia virus (VACV)-luciferase. In the CT26 study, 6 of 10 mice had a complete response after treatment with AZD4820 murine surrogate, whereas control VACV-luciferase-treated mice had 0 of 10 complete responders. AZD4820 treatment combined with anti-PD-L1 blocking antibody augmented tumor-specific T cell immunity relative to monotherapies. These findings suggest that vaccinia virus delivery of IL-12, combined with immune checkpoint blockade, elicits antitumor immunity in tumors that respond poorly to immune checkpoint inhibitors.

Keywords: IL-12; MT: Regular Issue; oncolytic; transgene; vaccinia; virus.


Conflict of interest statement

At the time this study was conducted, C.K., S.A., A.M., E.G., S.B., A.V., R.R., K.S., N.R.M., P.S., C.B., S.A.H., E.J.K., J.L., N.M.D., M.O., and M.A.S.B. were employees of AstraZeneca, with stock ownership and/or stock options or interests in the company; and J.F., N.S., E.Q., C.D., and P.K. were employees and stockholders of Transgene SA. N.R.M is an employee of Ratio Therapeutics (Boston, MA).

Figures

None
Graphical abstract
Figure 1
Figure 1
Activity of VACV-LUC virus in mice engrafted with human PDX tumors (A) Determination of the antitumor activity of VACV-LUC virus against human PDX tumors. (B) BOR pattern for VACV-LUC-treated mice engrafted with different tumor types as indicated. (C) Recovery of virus from engrafted tumors at 48 h after the first or third dose of VACV-LUC as determined by virus plaque assay. ∗∗p = 0.0095, 2-tailed, paired Student t test. (D–H) At 48 h after the first or third dose of VACV-LUC, expression of mouse RNA transcripts according to response pattern for (D) IL-12 receptor β1 and β2, (E) NKp46, (F) Cxcl9, (G) Cxcl10, and (H) PD-L1. ∗p ≤ 0.05; ∗∗p ≤ 0.01; ∗∗∗p ≤ 0.001; ∗∗∗∗p ≤ 0.0001 by 1-way ANOVA with Kruskal-Wallis test for multiple comparisons. Bar, median; boxes range from 25th to 75th percentile; whiskers extend to lowest and highest values. HN, head and neck squamous cell carcinoma; IV, intravenous.
Figure 2
Figure 2
IL-12 transgene expression and bioactivity, replication, and oncolytic activity of AZD4820 and VACV-LUC control virus in cultured human tumor cell lines (A) AZD4820 OV. pF17R, viral promoter driving expression of human IL-12 fusion protein consisting of p40 and p35 IL-12 subunits covalently linked by a G6S linker; promoter and transgene are inserted into the J2R viral locus, replacing the viral TK gene. (B) Expression of human IL-12 transgene in cell culture supernatants from human tumor cell lines infected by AZD4820 or empty VACV control virus at MOI of 0.01 for 72 h as measured by human IL-12–specific ELISA. Error bars represent standard deviation of the mean. (C) Bioactivity of IL-12 transgene measured by HEK Blue reporter cell assay in cell culture supernatants from AZD4820, empty VACV control, or mock-infected cells as compared with a titration of recombinant human IL-12 (rhIL-12). Error bars represent standard deviation of the mean. EC50 values represent half-maximal IL-12 biological activity as determined by 4-parameter fit, nonlinear regression analysis of sigmoidal dose-response curves. (D and E) Oncolytic activity of VACV-LUC (D) and (E) AZD4820 across human tumor cell lines expressed as a mean MOI EC50 oncolysis value (line) with each individual experimental EC50 value represented as dots and SD of the mean as whiskers. Dotted line arbitrarily represents a mean MOI activity value of 0.1 for potency reference. (F) Statistical correlation between the mean MOI EC50 oncolysis values between VACV-LUC and AZD4820 viruses across human tumor cell lines. (G) Human IL-12 transgene in cell culture supernatants of human tumor cells infected with AZD4820 at an MOI of 0.004 using 2,500 cells per well in 100 μL of medium at day 0 and supernatant collected at day 5 postinfection. Human IL-12 was measured by a human IL-12–specific electrochemiluminescence assay. Error bars represent standard deviation of the mean. (H) Recovery of virus from cells infected with AZD4820 or VACV-LUC control virus at MOI of 0.004 as measured by a virus plaque assay. Error bars represent standard deviation of the mean.
Figure 3
Figure 3
Antitumor efficacy and pharmacodynamics of AZD4820 in human CDX tumor models (A–C) Antitumor activity of vehicle (PBS + 0.05% BSA), VACV-LUC control virus, or AZD4820 administered once at the indicated intravenous doses in the (A) SW780 bladder, (B) NCI-H292 lung, and (C) HCT116 CRC xenograft models in immunodeficient mice. Error bars indicate SEM. ∗p = 0.033, ∗∗∗p < 0001 for AZD4820-treated versus control-treated groups at day 31 for SW780, day 36 for NCI-H292, and day 36 for HCT-116, using 1-way ANOVA with Tukey correction for multiple comparisons. (D) AZD4820 or VACV-LUC virus recovered from SW780 bladder tumors at the indicated times after administration of a single intravenous dose of 105, 106, or 107 PFUs of virus as indicated. Error bars represent standard deviation of the mean. (E) Detection of human IL-12 transgene in SW780 tumors from mice treated with a single 105, 106, or 107 PFU intravenous dose of AZD4820 or VACV-LUC at the indicated time points after dosing. Error bars represent standard deviation of the mean (F) Detection of human IL-12 transgene in mouse plasma after a single intravenous dose of AZD4820 or VACV-LUC control virus. Error bars represent standard deviation of the mean. (G) Prevalence of VACV+ cell area over time in SW780 tumors after single, intravenous administration of AZD4820 as indicated. Each box represents percent positive tumor cell area of the entire tumor as determined by VACV-specific IHC and read by a board-certified pathologist. (H) Representative staining of a tumor and normal ovary over time in an SW780 tumor-engrafted mouse treated with a single dose of 107 PFUs of AZD4820. Bar represents 300 μm.
Figure 4
Figure 4
AZD4820 infection and production of IL-12 in fresh primary human TSCs (A) Testing of AZD4820 infection, replication, and transgene production in cultured human tumor tissue slices treated with AZD4820 or VACV control virus or mock infected. (B) Detection of human IL-12 transgene in TSC supernatants from cultured tumor TSCs. Each dot represents an individual measurement of IL-12 cytokine from a TSC derived from melanoma, bladder, CRC, lung, renal, or ovarian cancer and represented by 25 (mock), 17 (VACV GFP), and 22 (AZD4820) slices derived from 8 individual donors. (C) IFN-γ transcript expression in TSCs. (D) IFN-γ protein detected in tumor TSC. (E) Viral B8R transcript expression in TSCs. Bar, median; boxes range from 25th to 75th percentile; whiskers extend to lowest and highest value. ∗∗∗p < 0.001; ns, not significant (1-way ANOVA with Tukey post hoc comparison). LLOD, lower limit of detection.
Figure 5
Figure 5
VACV muIL-12 replication and production of muIL-12 in rat tumor cell lines (A) Neutralization of rat IFN-γ by cell culture supernatant removed from AZD4820-infected (MOI 1) HeLa cells and diluted with PBS as indicated or by 50 ng/mL recombinant B8R protein as positive control. (B) Replication of VACV muIL-12 or VACV GFP control virus in mouse CT26 CRC or rat F98 glioma and HTC HCC cultured cell lines measured by virus plaque assay. Error bars represent standard deviation of the mean. ∗∗∗p < 0.001, ∗p < 0.05 unpaired, two-tailed Student's t-test. (C) Mouse IL-12 transgene production by mouse CT26 or rat F98 and HTC cultured cell lines treated with VACV muIL-12 or VACV GFP control virus as measured by mouse IL-12–specific electrochemiluminescence assay. Error bars represent standard deviation of the mean. ∗∗∗p < 0.001, ∗∗p < 0.01 unpaired, two-tailed Student's t-test. (D) Oncolytic activity of VACV muIL-12 and VACV GFP control virus for mouse CT26 and rat F98 and HTC cell lines as measured by CellTiter-Glo luminescent cell viability assay (Promega). Error bars represent standard deviation of the mean. (E) Plasma levels of mouse IL-12 transgene in rats engrafted with subcutaneous rat F98 glioma tumors and administered intravenous VACV muIL-12 at 105, 106, or 107 PFUs; VACV-LUC control virus at 107 PFU; or vehicle (PBS + 0.05% BSA). (F) Plasma levels of rat IFN-γ in treated rats. Bar, median; boxes range from 25th to 75th percentile; whiskers extend to lowest and highest values.
Figure 6
Figure 6
VACV muIL-12 enhancement of antitumor immune response in murine syngeneic CT26 and MC38 tumor models (A) Study schema for the use of VACV muIL-12 in the CT26 and MC38 CRC models. After cell implantation, tumor growth was monitored and mice were randomized to study groups based on tumor volume. Thereafter, mice were treated with intratumoral vehicle (PBS + 0.05% BSA), VACV-LUC control, or VACV muIL-12 viruses twice weekly for 5 doses as indicated. Peripheral blood was collected at 4 and 24 h for preparation of plasma to measure peripheral blood cytokine levels, and mice were terminally sacrificed at day 8 to examine intratumoral pharmacodynamic endpoints. (B) Tumor growth curves showing the antitumor activity of VACV muIL-12 relative to that of vehicle or VACV-LUC control virus–treated mice engrafted with CT26. The proportions of tumors showing CR to treatment are indicated above the graphs. Dotted lines indicate the timing of test article treatment. (C) Kaplan-Meier survival curve analysis of CT26 tumor-engrafted mice. ∗∗∗∗p < 0.0001, log rank test. (D) Murine IL-12 detection in plasma of CT26 tumor-engrafted mice at 4 or 24 h after test article administration. (E) IFN-γ in plasma from CT26 tumor-engrafted mice. Dots = individual mice; box hinges = 25th and 75th percentiles; box midline = median; whiskers = minimum to maximum distribution. Statistical analysis was performed on log transformed data and analyzed by Kruskal-Wallis test and Dunn multiple comparisons test. ∗∗p < 0.01; ∗∗∗p < 0.001; ∗∗∗∗p < 0.0001. (F) Tumor growth curves showing the antitumor activity of VACV muIL-12 relative to that of vehicle or VACV-LUC control virus–treated mice engrafted with MC38. (G) Kaplan-Meier survival curve analysis of MC38 tumor engrafted mice. ∗∗p < 0.01, log rank test. Dotted lines indicate the timing of test article treatment. (H) Murine IL-12 in mouse plasma at 4 or 24 h after test article administration to MC38 tumor-engrafted mice. (I) IFN-γ in plasma from MC38 tumor-engrafted mice. Bar, median; boxes range from 25th to 75th percentile; whiskers extend to lowest and highest values.
Figure 7
Figure 7
Effect of VACV muIL-12 combined with anti–PD-L1 on antitumor T cell immunity in the CT26 model (A) Study schema for VACV muIL-12 administered in combination with anti-mouse PD-L1 mAb in the CT26 CRC model. Tumors were collected on day 7 and dissociated for immunophenotyping. (B) Tumor growth curves for CT26 tumors treated with vehicle, VACV-LUC, or VACV muIL-12 as monotherapies. p < 0.0001 for mean tumor volume differences between vehicle versus VACV muIL-12 and p = 0.0035 for VACV-LUC versus VACV muIL-12–treated groups at day 18 using 1-way ANOVA with Tukey correction for multiple comparisons. (C) Tumor growth curves for mice treated with vehicle, VACV-LUC, or VACV muIL-12 combined with isotype control antibody. Error bars represent the standard deviation of the mean. (D) Tumor growth curves of mice treated with vehicle, VACV-LUC, or VACV muIL-12 combined with anti-mouse PD-L1 antibody. (E) Cell surface PD-L1 expression on CD11b+ Ly6C+ myeloid cells in the TME of CT26 tumors treated with the indicated test articles. (F) Cell surface PD-L1 expression on CD11c+ DCs. (G) Cell surface expression of PD-L1 on Ly6G+ granulocytes. Values represent the percentage of gated cells that were positive by flow cytometry for PD-L1 compared with staining controls. (H) AH-1-specific T cell response measured by IFN-γ ELISpot using splenocytes isolated from mice treated with test articles as indicated. (I) A52L virus peptide stimulated responses in splenocytes from treated mice. Statistical differences (p values) between treatment groups were determined using 1-way ANOVA with Tukey correction for multiple comparisons. Error bars represent the standard deviation of the mean. ND, not determined due to competition between fluorochrome-labeled anti-PD-L1 flow cytometry antibody and anti-PD-L1 blocking antibody treatment.

Similar articles

Cited by

References

    1. Galanis E., Hartmann L.C., Cliby W.A., Long H.J., Peethambaram P.P., Barrette B.A., Kaur J.S., Haluska P.J., Jr., Aderca I., Zollman P.J., et al. Phase I trial of intraperitoneal administration of an oncolytic measles virus strain engineered to express carcinoembryonic antigen for recurrent ovarian cancer. Cancer Res. 2010;70:875–882. - PMC - PubMed
    1. Kaufman H.L., Kim D.W., DeRaffele G., Mitcham J., Coffin R.S., Kim-Schulze S. Local and distant immunity induced by intralesional vaccination with an oncolytic herpes virus encoding GM-CSF in patients with stage IIIc and IV melanoma. Ann. Surg Oncol. 2010;17:718–730. - PubMed
    1. Kurokawa C., Iankov I.D., Anderson S.K., Aderca I., Leontovich A.A., Maurer M.J., Oberg A.L., Schroeder M.A., Giannini C., Greiner S.M., et al. Constitutive interferon pathway activation in tumors as an efficacy determinant following oncolytic virotherapy. J. Natl. Cancer Inst. 2018;110:1123–1132. - PMC - PubMed
    1. Heo J., Reid T., Ruo L., Breitbach C.J., Rose S., Bloomston M., Cho M., Lim H.Y., Chung H.C., Kim C.W., et al. Randomized dose-finding clinical trial of oncolytic immunotherapeutic vaccinia JX-594 in liver cancer. Nat. Med. 2013;19:329–336. - PMC - PubMed
    1. Alcamí A., Smith G.L. Vaccinia, cowpox, and camelpox viruses encode soluble gamma interferon receptors with novel broad species specificity. J. Virol. 1995;69:4633–4639. - PMC - PubMed