. 2024 Feb 26:15:1333274.
doi: 10.3389/fmicb.2024.1333274. eCollection 2024.

Anti-bacterial and anti-biofilm activities of arachidonic acid against the cariogenic bacterium Streptococcus mutans

Affiliations

Anti-bacterial and anti-biofilm activities of arachidonic acid against the cariogenic bacterium Streptococcus mutans

Manoj Chamlagain et al. Front Microbiol. .

Abstract

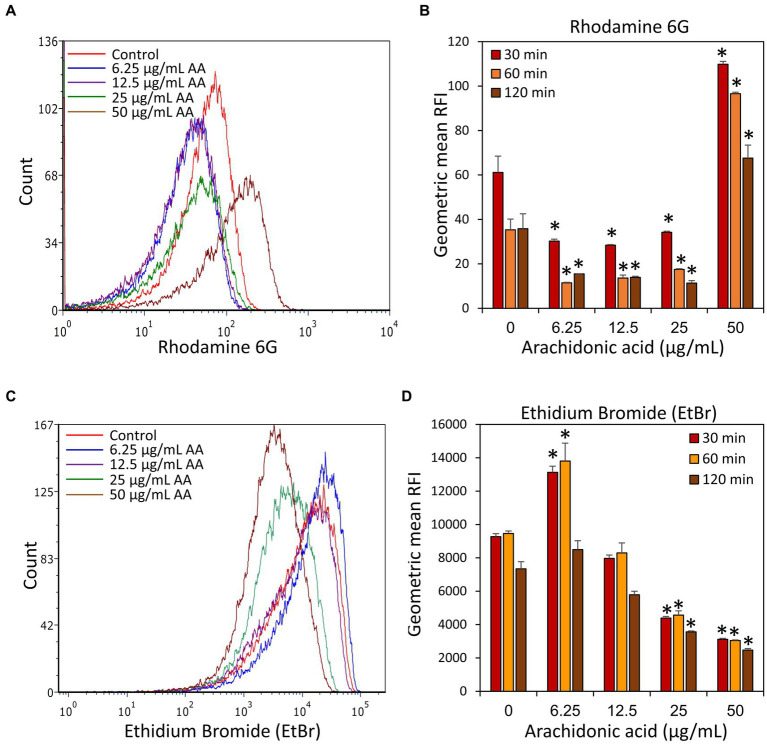
Streptococcus mutans is a Gram-positive, facultative anaerobic bacterium, which causes dental caries after forming biofilms on the tooth surface while producing organic acids that demineralize enamel and dentin. We observed that the polyunsaturated arachidonic acid (AA) (ω-6; 20:4) had an anti-bacterial activity against S. mutans, which prompted us to investigate its mechanism of action. The minimum inhibitory concentration (MIC) of AA on S. mutans was 25 μg/ml in the presence of 5% CO2, while it was reduced to 6.25-12.5 μg/ml in the absence of CO2 supplementation. The anti-bacterial action was due to a combination of bactericidal and bacteriostatic effects. The minimum biofilm inhibitory concentration (MBIC) was the same as the MIC, suggesting that part of the anti-biofilm effect was due to the anti-bacterial activity. Gene expression studies showed decreased expression of biofilm-related genes, suggesting that AA also has a specific anti-biofilm effect. Flow cytometric analyses using potentiometric DiOC2(3) dye, fluorescent efflux pump substrates, and live/dead SYTO 9/propidium iodide staining showed that AA leads to immediate membrane hyperpolarization, altered membrane transport and efflux pump activities, and increased membrane permeability with subsequent membrane perforation. High-resolution scanning electron microscopy (HR-SEM) showed remnants of burst bacteria. Furthermore, flow cytometric analysis using the redox probe 2',7'-dichlorofluorescein diacetate (DCFHDA) showed that AA acts as an antioxidant in a dose-dependent manner. α-Tocopherol, an antioxidant that terminates the radical chain, counteracted the anti-bacterial activity of AA, suggesting that oxidation of AA in bacteria leads to the production of cytotoxic radicals that contribute to bacterial growth arrest and death. Importantly, AA was not toxic to normal Vero epithelial cells even at 100 μg/ml, and it did not cause hemolysis of erythrocytes. In conclusion, our study shows that AA is a potentially safe drug that can be used to reduce the bacterial burden of cariogenic S. mutans.

Keywords: Streptococcus mutans; anti-bacterial; anti-biofilm; antioxidant; arachidonic acid; efflux pumps; membrane perforation.


Conflict of interest statement

The authors declare that the research was conducted in the absence of any commercial or financial relationships that could be construed as a potential conflict of interest.

Figures

Figure 1
Figure 1
Anti-bacterial activity of arachidonic acid (AA). (A) S. mutans was incubated with increasing concentrations of AA in BHI growth medium without sucrose (BHI, green line) or BHI with 2% sucrose (BHIS, red line) and the viability was calculated according to the optical density at 600 nm (OD600 nm) measured in the culture media after a 24 h incubation. N = 3. *p < 0.05 compared to control. **p < 0.001 compared to control. (B) The viability of S. mutans after a 24 h incubation with various concentrations of AA in the presence (green line) or absence (blue line) of 5% CO2. N = 3. **p < 0.001 compared to bacteria cultivated in the presence of 5% CO2. (C) Kinetic growth curve of S. mutans incubated with various concentrations of AA as measured in an atmosphere without CO2 supplementation. N = 3. *p < 0.05 compared to control. **p < 0.001 compared to control. It should be noted that subfigures (A,B) are endpoint studies, while subfigure (C) is a kinetic study. Parallel incubation with equal dilutions of ethanol (0.03–0.2%) had no effect on bacterial growth.
Figure 2
Figure 2
Anti-biofilm activity of arachidonic acid (AA). (A) S. mutans was incubated with various concentrations of AA in BHI growth medium supplemented with 2% sucrose, and the biofilms formed on the surface was measured after a 24 h incubation by crystal violet (CV) staining (blue line) or MTT metabolic assay (green line). (B,C) S. mutans was allowed to form biofilm on the surface for 6 h (B) and 24 h (C) in the presence of 2% sucrose, and then exposed to various concentrations of AA for another 24 h. The resulting biofilms were analyzed by crystal violet (CV) staining (blue line) or MTT metabolic assay (green line). N = 3. *p < 0.05 compared to control. **p < 0.001 compared to control. Parallel incubation with equal dilutions of ethanol (0.03–0.2%) had no effect on biofilm metabolic activity or biomass.
Figure 3
Figure 3
Bacteriostatic and bactericidal effects of arachidonic acid (AA). (A–C) Control and AA-treated S. mutans were analyzed for colony forming units (CFUs) (A), ATP content (B), and optical density (C) at various time points following incubation at 37°C in an atmosphere of 95% air/5% CO2. The numbers in the Y-axis of subfigure (A) present the number of CFU × 10−7. N = 3. *p < 0.05 compared to control. **p < 0.001 compared to control.
Figure 4
Figure 4
Arachidonic acid (AA) increases the membrane permeability of S. mutans. (A) Flow cytometry density plots of SYTO 9 and propidium iodide (PI) staining of control bacteria and bacteria treated for 2 h with the indicated concentrations of AA. “a” represents PIhigh SYTO 9low perforated bacteria with cytoplasmic leakage; “b” represents PIhigh SYTO 9high bacteria with increased membrane permeability; “c” represents PInegative SYTO 9high live bacteria. The “low” and “high” terminology refers to the respective bacterial populations exhibiting relatively low and high fluorescence intensities. (B) The percentage of PIhigh SYTO 9high and PIhigh SYTO 9low bacteria upon a 2 h – treatment with various concentrations of AA. (C–E) The geometric mean of relative fluorescence intensity (RFI) of SYTO 9 (C), PI (D), and Alexafluor647-labeled Dextran 10,000 (E). 50,000 events were collected per sample. N = 3. *p < 0.05 compared to control. **p < 0.001 compared to control.
Figure 5
Figure 5
HR-SEM images of control bacteria and bacteria exposed to various concentrations of arachidonic acid (AA) or 0.1% ethanol (negative control) for 2 h. Red arrows point to debris of burst bacteria. Magnification: ×20,000. Uncropped images are presented in Supplementary Figures S3A–F.
Figure 6
Figure 6
HR-SEM images of biofilms formed by control bacteria and bacteria exposed to various concentrations of arachidonic acid (AA) or 0.1% ethanol (negative control) for 24 h. Extracellular polymeric substances (EPS) appear as a grey diffuse mass that surrounds the bacteria. The EPS can be seen in control, 0.1% ethanol, 6.25 and 12.5 μg/mL AA-treated samples, while absent in samples treated with 25 and 50 μg/mL AA. Red arrows point to swollen bacteria and debris of disintegrated bacteria. Magnification: ×20,000. Lower magnifications of panoramic images are presented in Supplementary Figure S5. Uncropped images are presented in Supplementary Figure S6.
Figure 7
Figure 7
(A) 3D Live/dead SYTO 9/PI merged images of S. mutans biofilms formed after a 24 h incubation with various concentrations of AA as observed by spinning disk confocal microscopy (SDCM). (B) The relative fluorescence intensities (RFI) of SYTO 9 and PI of each biofilm layer of each sample. The graphs represent the average measurements done on 10–13 images captured from each treatment group performed in triplicates. (C) The average area under the curve (AUC) of the samples analyzed in (B). The numbers in the Y-axis of subfigures (B,C) present the relative fluorescence intensity (RFI) × 10−8. *p < 0.05 compared to control. **p < 0.001 compared to control.
Figure 8
Figure 8
Arachidonic acid (AA) causes an immediate membrane hyperpolarization in S. mutans. (A,B) S. mutans was exposed to the indicated concentrations of AA in PBS at room temperature, and the membrane potential was measured by exposing the bacteria to the potentiometric dye DiOC2(3). The green fluorescence of DiOC2(3) is an indication of the amount of dye taken up by the bacteria, while a relative increase in red fluorescence indicates membrane hyperpolarization. (C) The relative fluorescence intensities (RFIs) of green and red fluorescence of samples from (A,B). N = 3. (D) The ratio of red to green fluorescence intensities of samples from (A,B). N = 3. (E,F) S. mutans was incubated with the indicated concentrations of AA in BHI for 2 h at 37°C, and then the membrane potential was measured by DiOC2(3). (G) The relative fluorescence intensities (RFIs) of green and red fluorescence of samples from (E,F). N = 3. (H) The ratio of red to green fluorescence intensities of samples from (E,F). N = 3. *p < 0.05 compared to control.
Figure 9
Figure 9
Treatment of S. mutans with arachidonic acid (AA) leads to an intracellular accumulation of DAPI. (A) Flow cytometry analysis of DAPI and Nile Red staining of live S. mutans that have been treated with various concentrations of AA for 2 h. (B) The geometric mean of relative fluorescence intensities (RFIs) of DAPI and Nile Red for the different treatment groups. N = 3. *p < 0.05 compared to control. **p < 0.001 compared to control.
Figure 10
Figure 10
Fixation of the arachidonic acid (AA)-treated bacteria prior to DAPI staining did not lead to intracellular DAPI accumulation, but rather to the appearance of DAPIlow cell populations as indicated by black arrows. (A) Flow cytometry density plots of DAPI staining of fixed control and AA-treated bacteria. The bacteria were incubated with AA for 2 h and fixed with methanol, rehydrated and stained with DAPI. (B) Histograms of DAPI staining of the same samples as in (A). (C) The geometric mean of relative fluorescence intensities (RFIs) of DAPI stain fixed bacteria. N = 3. (D) The percentage of DAPIlow cells of the samples in (A). N = 3. *p < 0.05 compared to control. SSC, side scatter on flow cytometry.
Figure 11
Figure 11
Accumulation and efflux of Rhodamine 6G and ethidium bromide (EtBr) of control S. mutans and bacteria treated with various concentrations of arachidonic acid (AA) for 2 h. (A) After a 2 h incubation with or without AA, the bacteria were loaded with Rhodamine 6G, washed, and the fluorescence intensity measured by flow cytometry after 30 min. (B) The geometric mean relative fluorescence intensity (RFI) of Rhodamine 6G-loaded samples 30, 60, and 120 min after dye removal. (C) After a 2 h incubation with or without AA, the bacteria were loaded with Ethidium bromide (EtBr), washed, and the fluorescence intensity measured by flow cytometry after 30 min. (D) The geometric mean of relative fluorescence intensity (RFI) of Ethidium bromide (EtBr)-loaded samples 30, 60, and 120 min after dye removal. N = 3. *p < 0.05 compared to control.
Figure 12
Figure 12
Arachidonic acid possesses anti-oxidative properties. S. mutans that have been incubated in the absence or presence of various concentrations of arachidonic acid (AA) for 2 h, were loaded with the redox probe 2′,7′-dichlorofluorescin diacetate (DCFHDA) and the fluorescence intensities were analyzed by flow cytometry. (A) The histograms of DCFHDA-loaded control and AA-treated bacteria. (B) The geometric mean of relative fluorescence intensities (RFIs) of the samples of (A). N = 3. *p < 0.05 compared to control.
Figure 13
Figure 13
(A,B) α-Tocopherol antagonized the anti-bacterial (A) and anti-biofilm (B) activities of arachidonic acid against S. mutans. S. mutans was incubated with α-tocopherol in the absence or presence of various concentrations of arachidonic acid for 24 h. The planktonic growth was analyzed by OD at 600 nm. The metabolic activity of biofilms formed in the presence of various combinations of compounds was analyzed by MTT metabolic assay. N = 3. *p < 0.05 compared to AA-treated samples. **p < 0.001 compared to AA-treated samples.
Figure 14
Figure 14
Effect of arachidonic acid on the expression of biofilm-related genes (A), redox and stress-related genes (B), acid tolerance-related genes (C) and efflux and cell division-related genes (D). S. mutans was exposed to 12.5 and 25 μg/mL AA for 2 h, and then subjected to RNA isolation, cDNA conversion and real-time quantitative PCR. Each treatment was performed in triplicates, and the fold changes were calculated for each treated samples against each of 3 controls using the 2–ΔΔCt method and gyrA as internal standard. The average of 9 calculations of each treatment group is shown together with the standard deviation. *p < 0.05 compared to control.
Figure 15
Figure 15
(A) Cytotoxicity assay of arachidonic acid (AA) on normal Vero epithelial cells. Monolayers of Vero epithelial cells were exposed to indicated concentrations of AA for 24 h and the cell mass was determined by crystal violet (CV) staining, and the metabolic activity determined by the MTT metabolic assay. (B) Hemolytic assay. Sheep erythrocytes were exposed to indicated concentrations of AA in PBS supplemented with 1% BSA for 1 h at 37°C. Double distilled water (ddw) was used as positive control for hemolysis. N = 3. (C) The percentage hemolysis of samples presented in (B) in comparison to ddw-induced hemolysis that was set to 100%.

Similar articles

Cited by

References

    1. Abiko Y., Shibata Y., Fukushima K., Murai S., Takiguchi H. (1983). The stimulation of macrophage prostaglandin E2 and thromboxane B2 secretion by Streptococcus mutans insoluble glucans. FEBS Lett. 154, 297–300. doi: 10.1016/0014-5793(83)80170-7, PMID: - DOI - PubMed
    1. Abou Neel E. A., Aljabo A., Strange A., Ibrahim S., Coathup M., Young A. M., et al. . (2016). Demineralization-remineralization dynamics in teeth and bone. Int. J. Nanomedicine 11, 4743–4763. doi: 10.2147/IJN.S107624, PMID: - DOI - PMC - PubMed
    1. Abranches J., Candella M. M., Wen Z. T., Baker H. V., Burne R. A. (2006). Different roles of EIIABMan and EIIGlc in regulation of energy metabolism, biofilm development, and competence in Streptococcus mutans. J. Bacteriol. 188, 3748–3756. doi: 10.1128/JB.00169-06, PMID: - DOI - PMC - PubMed
    1. Abranches J., Zeng L., Kajfasz J. K., Palmer S. R., Chakraborty B., Wen Z. T., et al. . (2018). Biology of Oral streptococci. Microbiol. Spectr. 6:5. doi: 10.1128/microbiolspec.GPP3-0042-2018, PMID: - DOI - PMC - PubMed
    1. Adolph S., Fuhrmann H., Schumann J. (2012). Unsaturated fatty acids promote the phagocytosis of P. Aeruginosa and R. equi by RAW264.7 macrophages. Curr. Microbiol. 65, 649–655. doi: 10.1007/s00284-012-0207-3, PMID: - DOI - PubMed

LinkOut - more resources