

Robust Optimization for Prostate Radiation Therapy: Assessment of Delivered Dose by Incorporating Intrafraction Prostate Position Deviations
- PMID: 38596454
- PMCID: PMC11002539
- DOI: 10.1016/j.adro.2024.101455
Robust Optimization for Prostate Radiation Therapy: Assessment of Delivered Dose by Incorporating Intrafraction Prostate Position Deviations
Abstract
Purpose: To assess the robustness of the dose delivered to the clinical target volume (CTV) between planning target volume (PTV)-based and robust optimization planning approaches in localized prostate cancer radiation therapy.
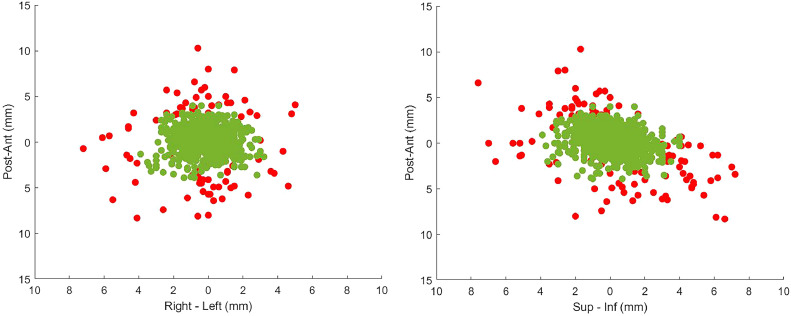
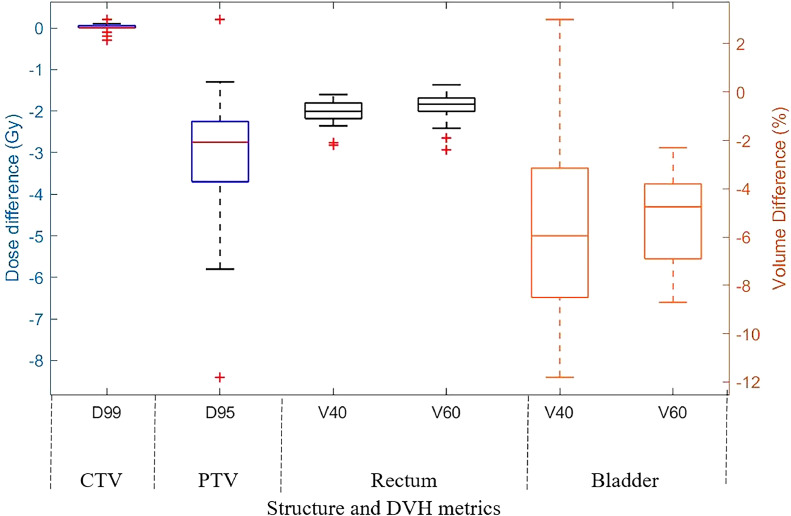
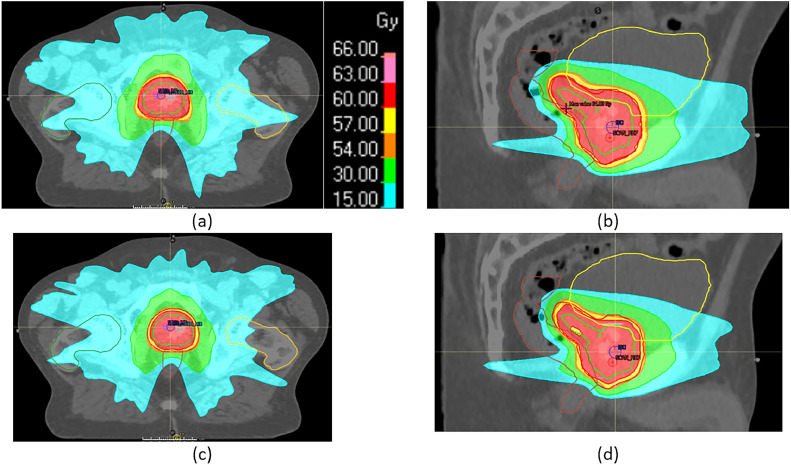
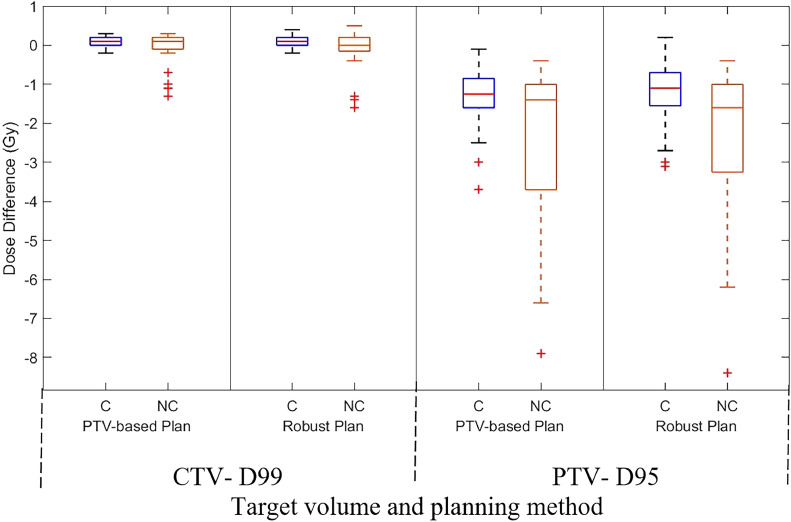
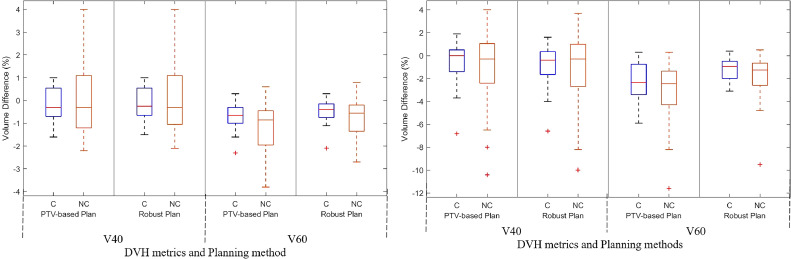
Methods and materials: Retrospective data of 20 patients with prostate cancer, including radiation therapy and real-time prostate position, were analyzed. Two sets of volumetric modulated arc therapy plans were generated per patient: PTV-based and robust optimization. PTV-based planning used a 7-mm CTV-PTV margin, whereas robust planning considered same-magnitude position deviations. Differences in CTV dose delivered to 99% volume (D99), PTV dose delivered to 95% volume (D95), and bladder and rectum V40 (volume receiving 40 Gy) and V60 (volume receiving 60 Gy) values were evaluated. The target position, determined by in-house position monitoring system, was incorporated for dose assessment with and without position deviation correction.
Results: In the robust optimization approach, compared with PTV-based planning, the mean (standard deviation) V40 and V60 values of the bladder were reduced by 5.2% (4.1%) and 5.1% (1.9%), respectively. Similarly, for the rectum, the reductions were 0.8% (0.5%) and 0.6% (0.6%). In corrected treatment scenarios, both planning approaches resulted in a mean (standard deviation) CTV D99 difference of 0.1 Gy (0.1 Gy). In the not corrected scenario, PTV-based planning reduced CTV D99 by 0.1 Gy (0.5 Gy), whereas robust planning reduced it by 0.2 Gy (0.6 Gy). There was no statistically significant difference observed in the planned and delivered rectum and bladder dose for both corrected and not corrected scenarios.
Conclusions: Robust optimization resulted in lower V40 and V60 values for the bladder compared with PTV-based planning. However, no difference in CTV dose accuracy was found between the 2 approaches.
Crown Copyright © 2024 Published by Elsevier Inc. on behalf of American Society for Radiation Oncology.
Conflict of interest statement
The authors declare that they have no known competing financial interests or personal relationships that could have appeared to influence the work reported in this paper.
Figures
References
-
- Barton MB, Jacob S, Shafiq J, et al. Estimating the demand for radiotherapy from the evidence: A review of changes from 2003 to 2012. Radiother Oncol. 2014;112:140–144. - PubMed
-
- Unkelbach J, Alber M, Bangert M, et al. Robust radiotherapy planning. Phys Med Biol. 2018;63:22TR02. - PubMed
-
- Biston M-C, Chiavassa S, Grégoire V, Thariat J, Lacornerie T. Time of PTV is ending, robust optimization comes next. Cancer Radiother. 2020;24:676–686. - PubMed
-
- Fredriksson A, Forsgren A, Hårdemark B. Minimax optimization for handling range and setup uncertainties in proton therapy. Med Phys. 2011;38:1672–1684. - PubMed
LinkOut - more resources
Full Text Sources
