. 2024 Mar 29:14:100094.
doi: 10.1016/j.bbiosy.2024.100094. eCollection 2024 Jun.

Differential proteomics profile of microcapillary networks in response to sound pattern-driven local cell density enhancement

Affiliations

Differential proteomics profile of microcapillary networks in response to sound pattern-driven local cell density enhancement

N Di Marzio et al. Biomater Biosyst. .

Abstract

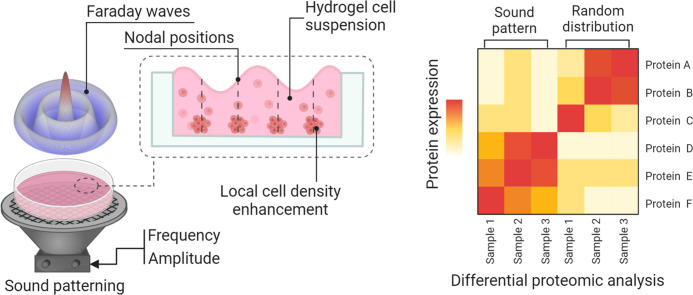
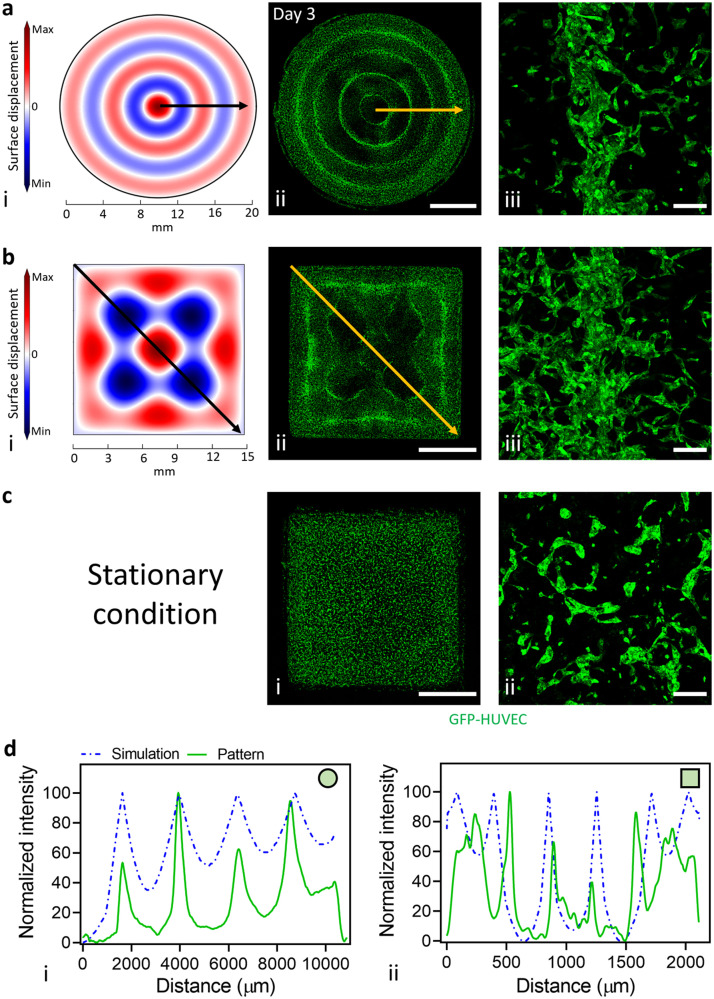
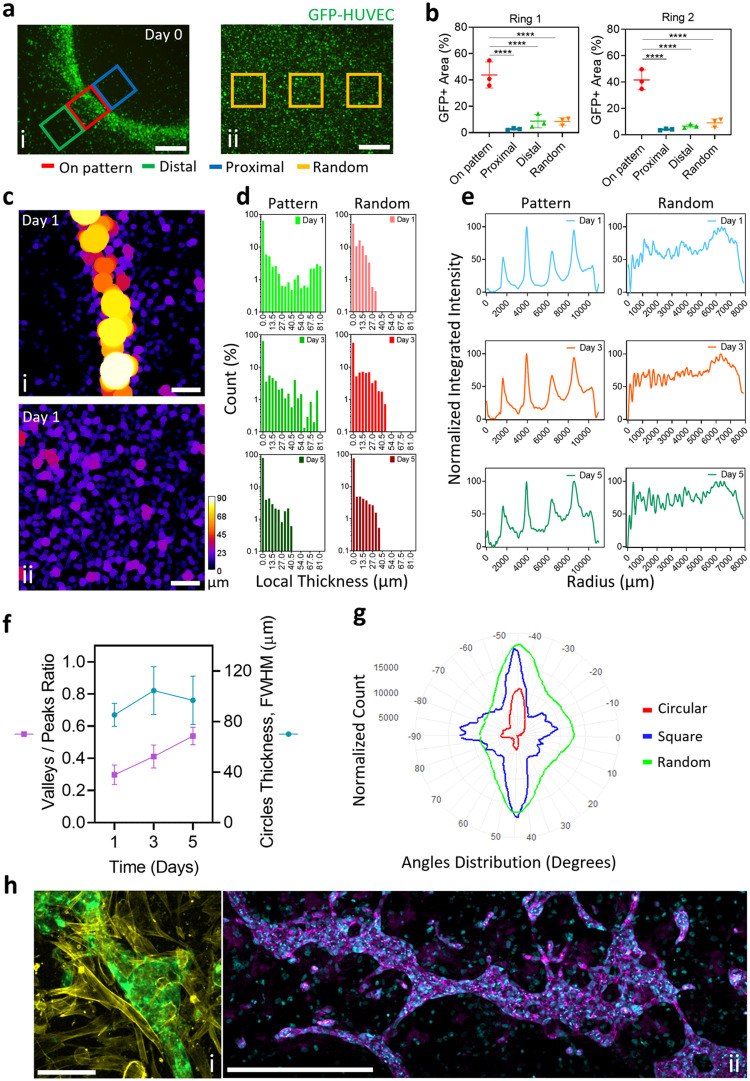
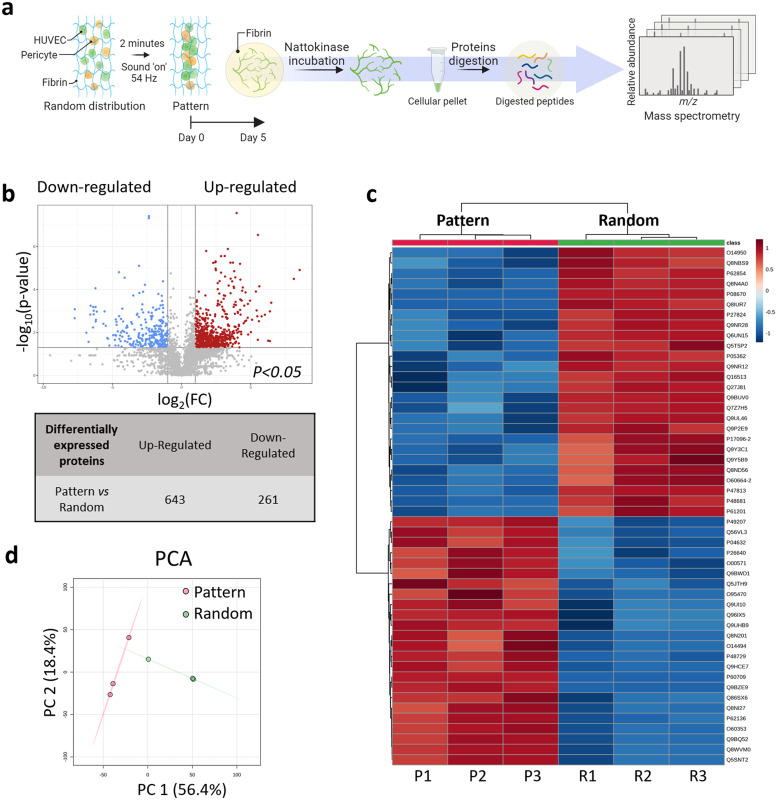
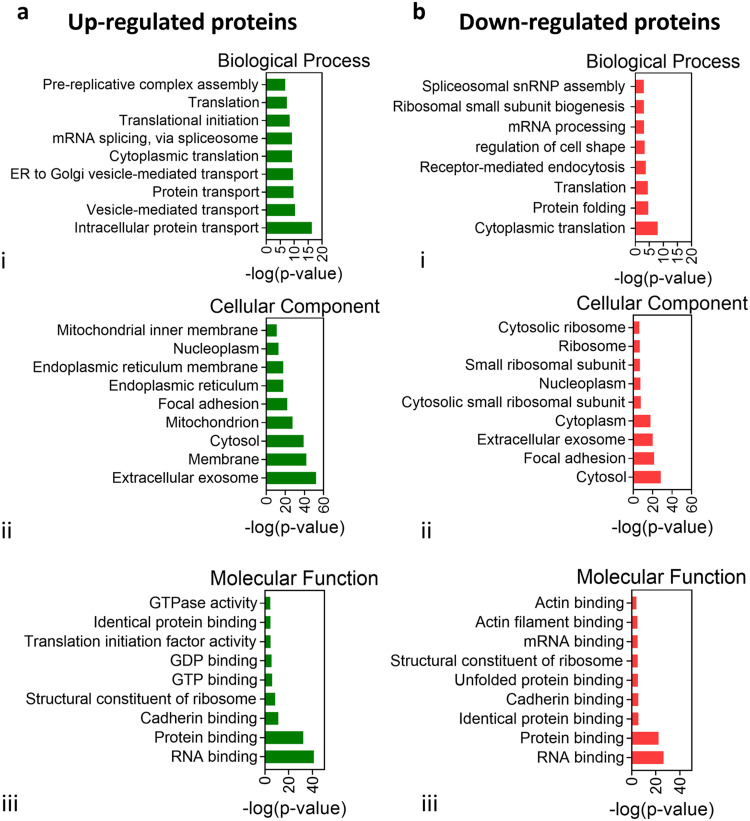
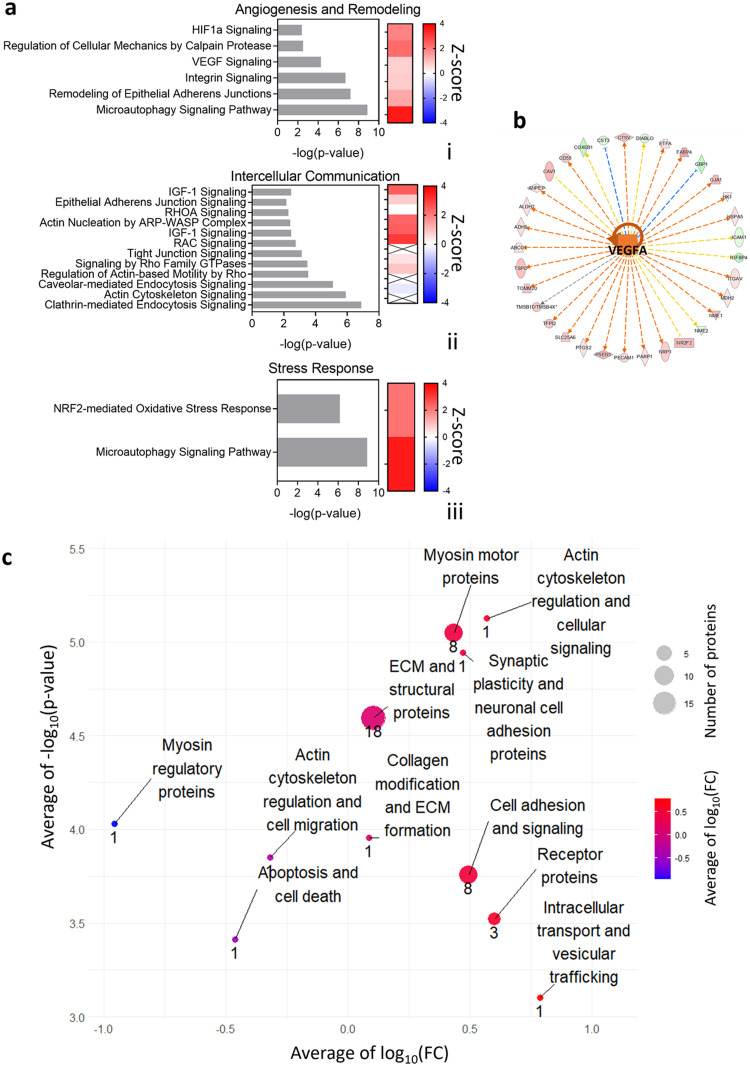
Spatial cell organization and biofabrication of microcapillary networks in vitro has a great potential in tissue engineering and regenerative medicine. This study explores the impact of local cell density enhancement achieved through an innovative sound-based patterning on microcapillary networks formation and their proteomic profile. Human umbilical vein endothelial cells (HUVEC) and human pericytes from placenta (hPC-PL) were mixed in a fibrin suspension. The mild effect of sound-induced hydrodynamic forces condensed cells into architected geometries showing good fidelity to the numerical simulation of the physical process. Local cell density increased significantly within the patterned areas and the capillary-like structures formed following the cell density gradient. Over five days, these patterns were well-maintained, resulting in concentric circles and honeycomb-like structures. Proteomic analysis of the pre-condensed cells cultured for 5 days, revealed over 900 differentially expressed proteins when cells were preassembled through mild-hydrodynamic forces. Gene ontology (GO) enrichment analysis identified cellular components, molecular functions, and biological processes that were up- and down-regulated, providing insights regarding molecular processes influenced by the local density enhancement. Furthermore, we employed Ingenuity Pathway Analysis (IPA) to identify altered pathways and predict upstream regulators. Notably, VEGF-A emerged as one of the most prominent upstream regulators. Accordingly, this study initiates the unraveling of the changes in microcapillary networks at both molecular and proteins level induced by cell condensation obtained through sound patterning. The findings provide valuable insights for further investigation into sound patterning as a biofabrication technique for creating more complex microcapillary networks and advancing in vitro models.

Keywords: Bio-assembly; Cell density enhancement; Microcapillary networks; Proteomic analysis; Sound patterning.


Conflict of interest statement

The authors declare that they have no known competing financial interests or personal relationships that could have appeared to influence the work reported in this paper.

Figures

Image, graphical abstract
Graphical abstract
Fig. 1
Fig. 1
Computational model of sound-induced liquid surface displacement and prepatterned microcapillary networks in round and square geometries. The numerical simulation of the fluid interface deformation, driven by Faraday waves in (a, i) round and (b, i) square patterning chambers, predicted the final patterned cell configurations. Three days after sound patterning, the condensed cells maintained the prepatterned organization in (a, ii) concentric circles or (b, ii) honeycomb-like shapes. In contrast, under stationary conditions (c, i), a distinct morphological organization could not be achieved (scale bars = 5 mm). GFP-HUVEC and hPC-PL (a&b, iii) self-assembled into hierarchical capillary-like structures following the condensed cell gradient, whereas (c, ii) homogeneously distributed capillary-like structures were obtained in stationary conditions (scale bars = 200 µm). Image analysis of the intensity profile (arrow lines) of the numerical simulation (d) demonstrated the comparable location of the predicted nodal positions and the actual condensed cells distributed within the (i) round and (ii) square geometries.
Fig. 2
Fig. 2
Image analysis-based macroscopic characterization of sound patterned microcapillary networks. Local cell density enhancement after sound patterning was quantified by (a) measuring the GFP+ area of the ROIs placed on (i) the patterned line (“On pattern” ROIs) of the concentric circles pattern and compared with the areas adjacent to the pattern line or with (ii) the cells seeded in stationary condition (“Distal”, “Proximal”, and “Random” ROIs) (scale bars = 500 µm). The measurements (b) were conducted on the first and second rings of the concentric rings pattern and showed 438 ± 103 % and 386 ± 104 % enhancement of local cell density for the first and second rings, respectively, compared to the stationary condition (n = 3, mean ± SD, ****p-value <0.0001). The microcapillary network's local thickness analysis (c) was performed on representative images obtained from the concentric circles pattern. Specifically, on (i) the patterned line and on representative images of (ii) the stationary condition (random) at day 1, 3, and 5 of tissue maturation (scale bars = 200 µm). The local thickness results (d) for the patterned capillaries during the 5 days in culture were 13.1 ± 24.7 µm, 10.6 ± 18.9 µm, and 4.1 ± 9.5 µm, whereas 6.6 ± 7.8 µm, 9.3 ± 12.5 µm, and 4.5 ± 8.8 µm for the random distribution in stationary conditions, measured at day 1, 3, and 5, respectively (mean ± SD). The evolution of the microcapillaries pattern (e) was monitored over the 5 days in culture by measuring the radial intensity profile of the concentric rings pattern, with peaks corresponding to single circles on each of the imaging days. The valley-to-peak ratio (f) of the radial profile's peaks was measured over the culture time and showed a linear increase, suggesting capillary growth also in between the concentric rings. Conversely, the thickness of the rings remained relatively constant, ranging between 80 and 120 µm. Analysis of the general orientation (g) presented by capillary-like structures, performed on overview images of samples, revealed that different pattern geometries (round and square) induced different orientation of the capillary-like structures at the macroscopic level. Immunofluorescent staining (h) of the microcapillary networks showed signs of tissue maturation and functionality (representative image from concentric rings pattern). (i) Pericyte cells were found to support the capillary structures (green = GFP-HUVEC, yellow = F-actin, scale bar = 100 µm), and (ii) VE-cadherin was expressed at cell-cell junctions along the patterned capillaries (violet = VE-cadherin, blue = Nuclei, scale bar = 500 µm).(For interpretation of the references to color in this figure legend, the reader is referred to the web version of this article.)
Fig. 3
Fig. 3
Untargeted differential proteomics analysis to investigate the impact of enhanced local cell density after sound patterning of centimeter-scale microcapillary networks. (a) At day 0, Green Fluorescent Protein-Expressing human umbilical vein endothelial cells (GFP-HUVEC) and human pericytes from placenta (hPC-PL) were collected and mixed at a ratio of 10:1 in a single-cell suspension made in fibrin, then dispensed into the sound patterning chamber with a round geometry. Before gelation, Faraday waves were generated at the liquid-air interface upon application of 54 Hz frequency vibration, and sound-induced hydrodynamic forces condensed the cells into reproducible pattern of 4 concentric circles in less than 2 min. At day 5, the concentric circles pattern samples were washed with PBS and incubated at 37 °C with 1 ml of a 2 mg mL−1 Nattokinase solution prepared in 1 mM EDTA PBS. Cellular material was collected in pellets, which underwent protein digestion. The digested peptides were then analyzed by mass spectrometry. (b) Proteomic analysis of the patterned capillaries after 5 days in culture revealed over 900 differentially expressed proteins compared to the stationary condition (random). 643 proteins were up-regulated and 261 down-regulated in the patterned microcapillaries compared to the random condition (n = 3). The heatmap (c) shows the 50 most significant proteins, and (d) the Principal Components Analysis (PCA) of the dataset reduced to two dimensions shows spatial separation between the random and patterned conditions.
Fig. 4
Fig. 4
Gene Ontology (GO) enrichment analysis after proteins quantification on the concentric circles pattern. Top 9 significantly enriched GO (−log10 (p-value) >1.3) terms of the target genes in the cellular components, molecular function, and biological processes domains, either (a) up- or (b) down- regulated, resulted from DAVID software analysis. The complete list of GO annotation for the significantly differentially expressed associated genes is reported in supplementary information Fig. S5.
Fig. 5
Fig. 5
IPA analysis, upstream regulators, and proteins with altered expression grouped by function. (a) Ingenuity Pathway Analysis (IPA) identified the most representative altered canonical pathways targeted by the differentially expressed proteins in the concentric circles patterned microcapillaries, grouped by their involvement in Angiogenesis and Remodeling (i), Intercellular Communication (ii), and Stress Response (iii). (p-value <0.05). (b) VEGFA was identified as one of the most representative upstream regulators after IPA analysis. The complete list of identified significantly different canonical pathways is reported in supplementary material Excel file S1. In addition to the general predictions from DAVID and IPA analysis, the set of significant differentially expressed proteins was manually curated. The most relevant proteins, contextual to the experimental conditions, were clustered together according to their known functions and represented in the bubble plot. (c) The plot displays the average of log10(Fold Change) for the selected proteins, the average of −log2(p-value), and the number of proteins for each function group. A table with the IDs and names of the single proteins is reported in supplementary information Table S1.

References

    1. Enderle J., Bronzino J. Academic Press; 2012. Introduction to biomedical engineering.
    1. Daly A.C., Davidson M.D., Burdick J.A. 3D bioprinting of high cell-density heterogeneous tissue models through spheroid fusion within self-healing hydrogels. Nat Commun. 2021;12(1):753. - PMC - PubMed
    1. You S., et al. High cell density and high-resolution 3D bioprinting for fabricating vascularized tissues. Sci Adv. 2023;9(8):eade7923. - PMC - PubMed
    1. Miller K.L., et al. Rapid 3D BioPrinting of a human iPSC-derived cardiac micro-tissue for high-throughput drug testing. Organs-on-a-Chip. 2021;3
    1. Cigan A.D., et al. High seeding density of human chondrocytes in agarose produces tissue-engineered cartilage approaching native mechanical and biochemical properties. J Biomech. 2016;49(9):1909–1917. - PMC - PubMed

LinkOut - more resources