

Effects of Sociodemographic and Child Opportunity Index on Pediatric Plastic and Oral and Maxillofacial Surgical Volume Trends in the COVID-19 Pandemic
- PMID: 38596585
- PMCID: PMC11000752
- DOI: 10.1097/GOX.0000000000005707
Effects of Sociodemographic and Child Opportunity Index on Pediatric Plastic and Oral and Maxillofacial Surgical Volume Trends in the COVID-19 Pandemic
Abstract
Background: The coronavirus disease 2019 (COVID-19) pandemic caused disruptions to pediatric surgical care. Although surgical capacity has returned to the prepandemic state, barriers to surgical access may still exist for children who are medically underserved. We assessed pediatric plastic and oral and maxillofacial surgical volumes by sociodemographic characteristics before and during the COVID-19 pandemic.
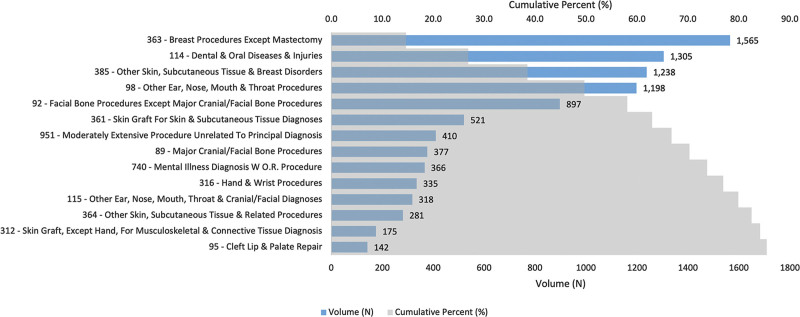
Methods: A 72-month retrospective cohort analysis of 10,681 pediatric plastic and oral and maxillofacial procedures between 2016 and 2021 was conducted. Multivariable logistic regression and interrupted time series analyses were used to analyze surgical volume trends by sociodemographic groups and Child Opportunity Index (COI).
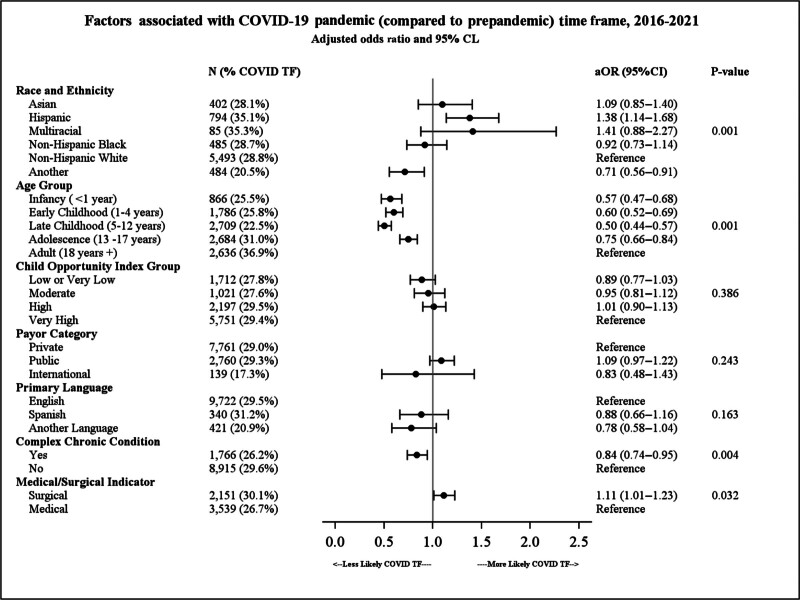
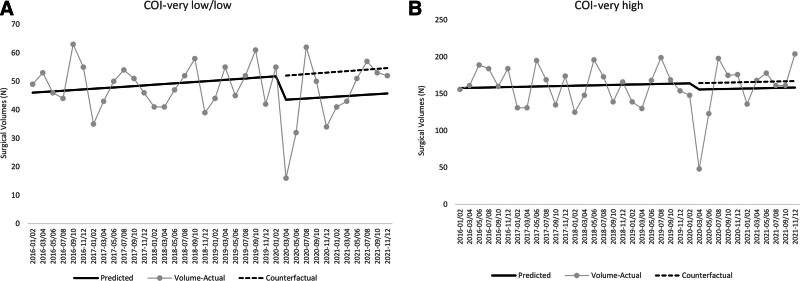
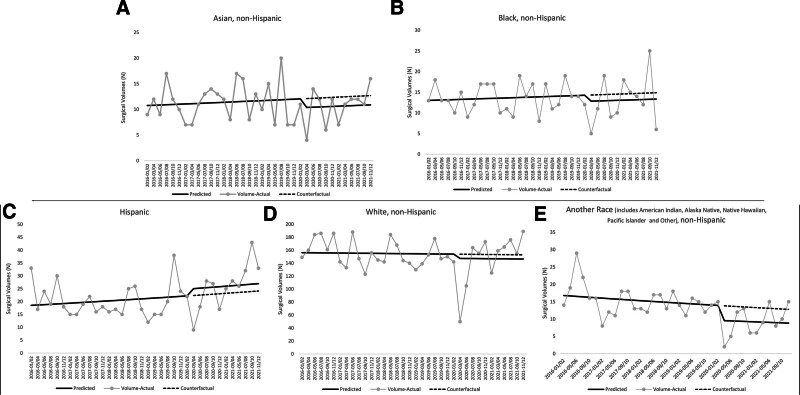
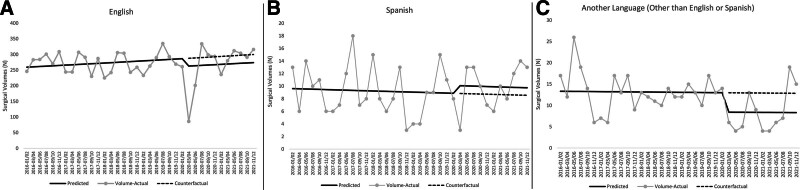
Results: Compared with prepandemic, patients undergoing procedures were more likely to be older than 18 years (P < 0.001) and Hispanic/Latino (adjusted odds ratio 1.38; 95% confidence interval, 1.14-1.68; P < 0.01). Surgical volume trends among patients from the lowest COI levels were lower than where they were estimated to have been if the pandemic did not occur (P = 0.040). Patients who spoke a primary language other than English or Spanish (P = 0.02) and patients with the lowest COI levels (P = 0.04) continued to have unrecovered surgical volumes.
Conclusions: There were differences in the sociodemographic case-mix of patients undergoing plastic and oral and maxillofacial surgical procedures before and during the pandemic, and surgical volumes did not recover at the same rate for all patients. Further research can determine why certain sociodemographic groups and patients with low COI levels had decreased surgical access compared with prepandemic trends, and develop interventions focused on equitable pediatric surgical access.
Copyright © 2024 The Authors. Published by Wolters Kluwer Health, Inc. on behalf of The American Society of Plastic Surgeons.
Conflict of interest statement
Dr. Ward is the Co-Leader of the Health Equity Core and Health Equity Advisor for the Children and Youth with Special Health Care Needs Research Network (CYSHCNet). This program is supported by the Health Resources and Services Administration (HRSA) of the US Department of Health and Human Services (HHS) under UA6MC31101 CYSHCNet. This information or content and conclusions are those of the author and should not be construed as the official position or policy of, nor should any endorsements be inferred by HRSA, HHS, and the US Government. Dr. Ward is also a member of the National Project Advisory Committee for a project being conducted by the Institute for Patient- and Family-Centered Care and Cincinnati Children’s Hospital Medical Center funded by the Lucile Packard Foundation for Children’s Health. Dr. Meara is a site Principal Investigator/subrecipient on an NIH grant awarded to Massachusetts General Hospital for a basic science project not related to access to care. The other authors have no financial interest to declare.
Figures
Similar articles
-
Child Opportunity Index Disparities in Pediatric Surgical Encounters During the Coronavirus 2019 Pandemic.Acad Pediatr. 2024 Jan-Feb;24(1):43-50. doi: 10.1016/j.acap.2023.08.012. Epub 2023 Aug 23. Acad Pediatr. 2024. PMID: 37625667
-
Trends in US Surgical Procedures and Health Care System Response to Policies Curtailing Elective Surgical Operations During the COVID-19 Pandemic.JAMA Netw Open. 2021 Dec 1;4(12):e2138038. doi: 10.1001/jamanetworkopen.2021.38038. JAMA Netw Open. 2021. PMID: 34878546 Free PMC article.
-
How has the COVID Pandemic Impacted the Clinical Volume and Variety of an Academic Oral and Maxillofacial Surgery Program?J Oral Maxillofac Surg. 2021 Dec;79(12):2482-2486. doi: 10.1016/j.joms.2021.06.033. J Oral Maxillofac Surg. 2021. PMID: 34862006 Free PMC article.
-
Child Opportunity Index and Changes in Pediatric Acute Care Utilization in the COVID-19 Pandemic.Pediatrics. 2022 May 1;149(5):e2021053706. doi: 10.1542/peds.2021-053706. Pediatrics. 2022. PMID: 35233618
-
Increases in pediatric cholecystectomy during the COVID-19 pandemic: An interrupted time series analysis.Surgery. 2024 Feb;175(2):304-310. doi: 10.1016/j.surg.2023.10.027. Epub 2023 Nov 30. Surgery. 2024. PMID: 38036396
References
-
- Centers for Medicare and Medicaid Services. CMS adult elective surgery and procedures recommendations: limit all non-essential planned surgeries and procedures, including dental, until further notice. 2020. Available at https://www.cms.gov/files/document/covid-elective-surgery-recommendation.... Accessed June 7, 2023.
-
- American College of Surgeons. COVID-19: guidance for triage of non-emergent surgical procedures. 2020. Available at https://www.facs.org/for-medical-professionals/covid-19/clinical-guidanc.... Accessed June 7, 2023.
-
- Yasmin F, Binzafar MD, Salman A, et al. . Exploring the impact of the COVID-19 pandemic on pediatric surgical services. Minerva Pediatrics. 2021;73:460–466. - PubMed
LinkOut - more resources
Full Text Sources