

Development and Validation of a Nomogram for Patients Undergoing Transarterial Chemoembolization for Recurrent Hepatocellular Carcinoma After Hepatectomy
- PMID: 38596594
- PMCID: PMC11001561
- DOI: 10.2147/JHC.S444682
Development and Validation of a Nomogram for Patients Undergoing Transarterial Chemoembolization for Recurrent Hepatocellular Carcinoma After Hepatectomy
Abstract
Purpose: This study aims to establish a prognostic nomogram for patients who underwent transarterial chemoembolization (TACE) for recurrent hepatocellular carcinoma (HCC) after hepatectomy.
Patients and methods: Patients who underwent TACE for recurrent early- and middle-stage HCC after hepatectomy between 2009.01 and 2015.12 were included. Enrolled patients were randomly divided into training (n=345) and validation (n=173) cohorts according to a computer-generated randomized number. Independent factors for overall survival (OS) were determined and included in the nomogram based on the univariate and multivariate analyses of the training group. The nomogram was validated and compared to other prognostic models. Discriminative ability and predictive accuracy were determined using the Harrell C index (C-index), area under the receiver operating characteristic curve (AUROC), and calibration curve.
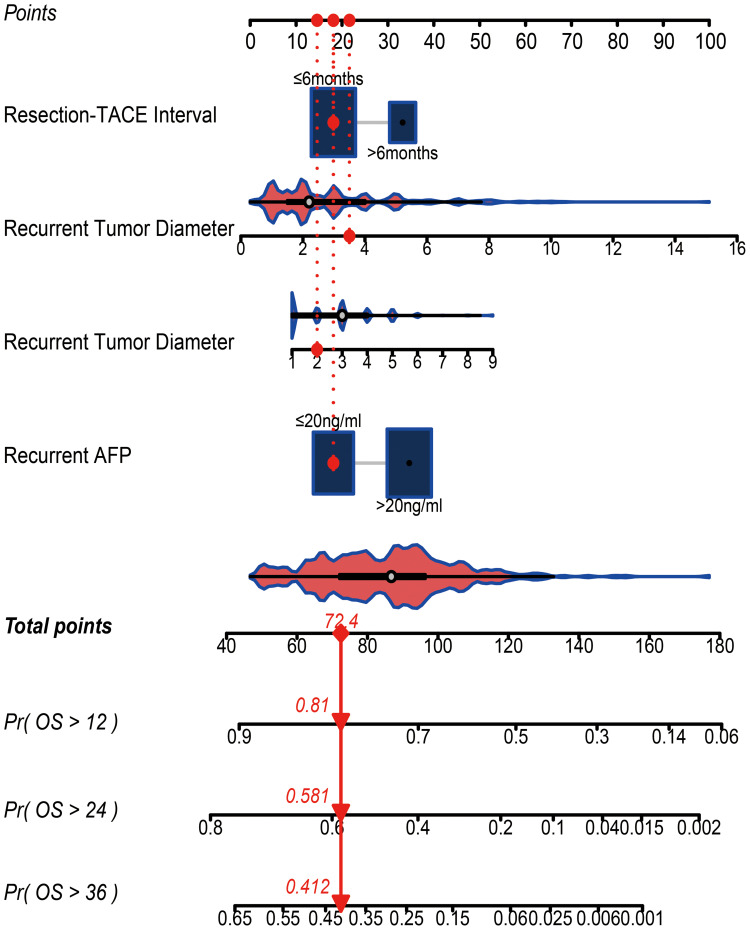
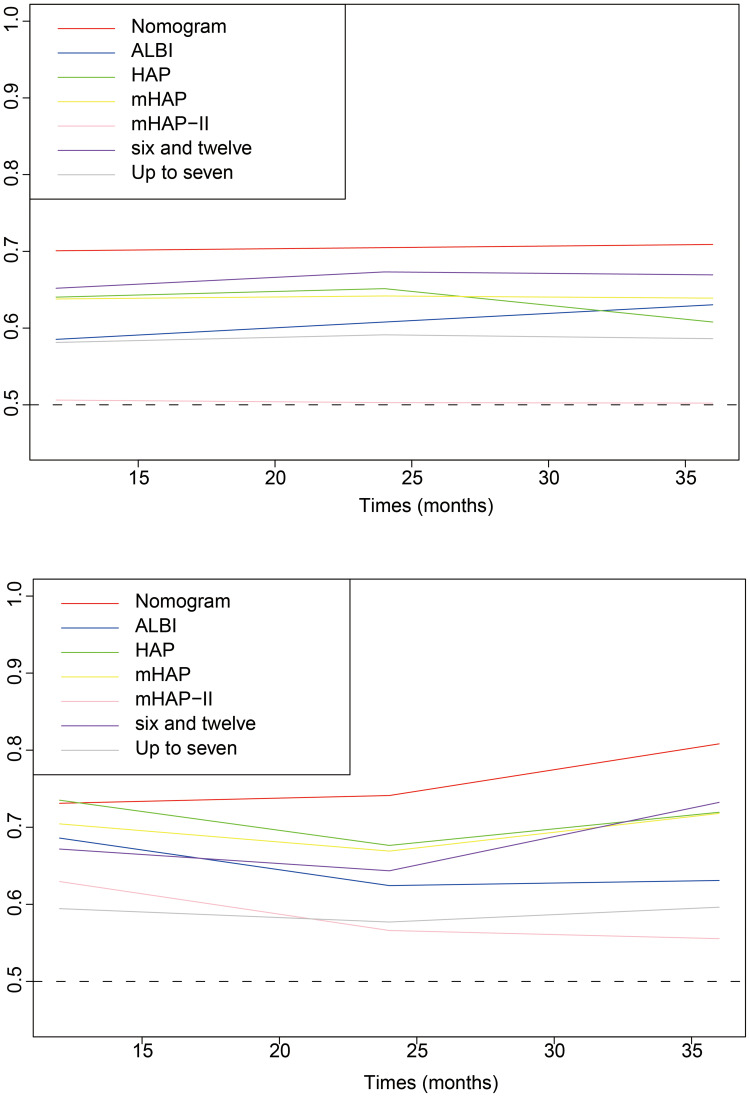
Results: The final nomogram was established based on four parameters including resection-to-TACE time interval, recurrent tumor diameter, recurrent tumor number, and AFP level. The C-indexes of the nomogram for predicting OS were 0.67 (95% CI 0.63-0.70) and 0.71 (95% CI 0.68-0.74) in the training and validation cohort respectively. The AUROCs for predicting the 1-year, 2-year and 3-year OS based on the nomogram were also superior to those of the other models. The calibration curve for 3-year survival showed a high congruence between the predicted and actual survival probabilities. According to the scores calculated by the nomogram, patients were stratified into three subgroups: high-risk (scoring ≥53 points), middle-risk (scoring ≥26 and <53 points), and low-risk (scoring <26 points) subgroups with a median OS of 10.1 (95% CI 0.63-0.70), 20.3 (95% CI 17.5-22.5) and 47.0 (95% CI 34.2-59.8) months, respectively.
Conclusion: The proposed nomogram served as a new tool to predict individual survival in patients who underwent TACE for recurrent HCC after hepatectomy, with favorable performance and discrimination. For high-risk patients, treatment should be optimized beyond TACE alone based on the nomogram.
Keywords: hepatocellular carcinoma; nomogram; transarterial chemoembolization.
© 2024 Xie et al.
Conflict of interest statement
The authors report no conflicts of interest in this work.
Figures


References
LinkOut - more resources
Full Text Sources
Miscellaneous
