. 2024 Mar 26:15:1360068.
doi: 10.3389/fimmu.2024.1360068. eCollection 2024.

Evaluation of cyanotoxin L-BMAA effect on α-synuclein and TDP43 proteinopathy

Affiliations

Evaluation of cyanotoxin L-BMAA effect on α-synuclein and TDP43 proteinopathy

Paola Sini et al. Front Immunol. .

Abstract

The complex interplay between genetic and environmental factors is considered the cause of neurodegenerative diseases including Parkinson's disease (PD) and Amyotrophic Lateral Sclerosis (ALS). Among the environmental factors, toxins produced by cyanobacteria have received much attention due to the significant increase in cyanobacteria growth worldwide. In particular, L-BMAA toxin, produced by diverse taxa of cyanobacteria, dinoflagellates and diatoms, has been extensively correlated to neurodegeneration. The molecular mechanism of L-BMAA neurotoxicity is still cryptic and far from being understood. In this research article, we have investigated the molecular pathways altered by L-BMAA exposure in cell systems, highlighting a significant increase in specific stress pathways and an impairment in autophagic processes. Interestingly, these changes lead to the accumulation of both α-synuclein and TDP43, which are correlated with PD and ALS proteinopathy, respectively. Finally, we were able to demonstrate specific alterations of TDP43 WT or pathological mutants with respect to protein accumulation, aggregation and cytoplasmic translocation, some of the typical features of both sporadic and familial ALS.

Keywords: ALS; L-BMAA; PD; TDP43; cyanotoxins; α-synuclein.


Conflict of interest statement

The authors declare that the research was conducted in the absence of any commercial or financial relationships that could be construed as a potential conflict of interest. The author(s) declared that they were an editorial board member of Frontiers, at the time of submission. This had no impact on the peer review process and the final decision.

Figures
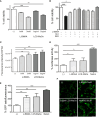
Figure 1
Figure 1
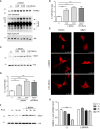
Effects of L-BMAA and LCS-MaCe exposure on SHSY-5Y neuronal cells. (A) Dose-dependent reduction in cell viability of SHSY-5Y cells exposed to different concentrations of pure L-BMAA (1 or 3 mM) or LCS-MaCe (1 or 5 µg) for 24 h, measured by MTS assay. (B) MTS assay on cells as in (A) exposed to 3mM l-BMAA, in combination with different doses (1 or 5mM) of the amino acids serine (SER), alanine (ALA) or both (C) SHSY-5Y cells were treated as in (A) and cellular ROS were measured using DCFDA. The signal was detected with excitation/emission at 485 nm/535 nm of 1s in a multi-reader plate (Victor X5, PerkinElmer). (D) SHSY-5Y were transfected with pARE-Luc and Renilla and 24h later treated as in (A). Luciferase activity was measured in a multiplate reader using the Dual-GlowTM Luciferase Assay System (Promega, USA). Firefly luciferase activity was then normalized to Renilla luciferase activity to control for transfection efficiency. Data were then normalized to luciferase activity in cells transfected with empty vector, which was assigned a value of 1 (E) SH-SY5Y-pCHOP cells were treated as in (A) and GFP fluorescence was detected with excitation/emission at 485 nm/535 nm of 1s in a multi-plate reader (Victor X5, PerkinElmer). (F) Analysis of GFP autofluorescence in the indicated cells was performed using a Leica TCS SP5 confocal microscope. NaArs 10 µM treatment for 24 h was used as a controlData in (A-E, L) are the mean and standard deviation ( ± SD) of at least three independent experiments. *, P < 0.05; **, P < 0.01, ***, P < 0.005.
Figure 2
Figure 2
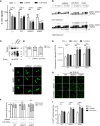
Evaluation of apoptosis and autophagy in SHSY-5Y neuronal cells exposed to L-BMAA and LCS-MaCe. (A) SHSY-5Y cells were exposed to pure L-BMAA 3 mM or LCS-MaCe 5 µg/ml for 24 h. Cells were labelled with Propidium Iodide (PI) and Annexin V to assess the apoptotic and necrotic phases. Cells were analyzed by flow cytometry on FACSCanto™ using FACSDiva software. (B) Quantification of results in A) (C) Western blot analysis on total protein extracts, obtained from SHSY-5Y cells treated with L-BMAA 1 or 3 mM, or with LCS-MaCe 5µg/ml for 24h, using the apoptotic markers anti-caspase3. Treatment with staurosporine (STS) for 6h was used as positive control to induce caspase-3 cleavage. Anti-βactin was used as an equal loading control. Western blot analysis of cells as in (C) using the autophagy markers anti-LC3B (D) and anti-p62 (F). Anti-H4 and anti-βactin were used as equal loading control. (E) Quantification of results in D) using ChemiDOC XRS+ system with Quantity One™ software. (G) Quantification of results in F) using ChemiDOC XRS+ system with Quantity One™ software. (H) Cells as in (C) were analyzed by immunofluorescence. Endogenous p62 signal was detected by primary anti-p62 antibody and secondary goat anti-rabbit IgG Alexa Fluor® 647; cells were analyzed using a Leica TCS SP5 confocal microscope. Data in (B-E, G) are the mean and standard deviation ( ± SD) of at least three independent experiments. *, P < 0.05; **, P < 0.01, ***, P < 0.005. In order to minimize the variability of the experimental results, each data point in panels (C, D, F) consists of two biological replicates.
Figure 3
Figure 3
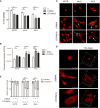
Effects of L-BMAA and LCS-MaCe exposure on the ALS-causing gene TDP-43 and on the PD-causing gene α-synuclein. (A) SHSY-5Y cells were exposed to L-BMAA (1 or 3mM) or LCS-MaCe 5 µg/ml for 24h. Total cell lysates were subjected to reducing SDS-PAGE and Western blot. Anti-TDP-43 antibody was used to visualize TDP-43 expression, anti-βactin as an equal loading control. (B) Quantification of results in (A) using ChemiDOC XRS+ system with Quantity One™ software. (C) SHSY-5Y cells were plated 1*10^5 and transduced with adenoviral particles encoding α-synuclein. 24h after transduction, cells were treated as in (A) and total cell lysates were analyzed by immunoblotting using anti-α-synuclein antibody and anti-β-actin as loading control (D) Quantification of results in (C) using ChemiDOC XRS+ system with Quantity One™ software. (E, F) Immunofluorescence analysis on SHSY-5Y treated as in (A) using anti-TDP-43 antibody and on SH-SY5Y were transduced and treated as in (C) using anti- α-synuclein antibody. Both primary antibodies were revealed using anti-rabbit ALEXA 546 secondary antibody. The slides were analyzed by Leica confocal microscope. (F) SH-SY5Y were transduced and treated as in (C). After 24h puromycin 10µg/ml was added and cells collected at different time points (1h, 3h, 6h). Cell lysates were subjected to reducing SDS-PAGE and western blot. The anti-αSynuclein antibody was used to visualize α-synuclein expression. βactin serves as controls for equal loading of samples. (G) Quantification of results in (E) using ChemiDOC XRS+ system with Quantity One™ software. Data in (B-E, G) are the mean and standard deviation ( ± SD) of at least three independent experiments. *, P < 0.05; **, P < 0.01, ***, P < 0.005. In figure (C, D, F) each experimental data point is duplicated to minimize variability.
Figure 4
Figure 4
L-BMAA and LCS/MaCe treatments exacerbate the pathological TDP-43 phenotype. (A) SHSY-5Y cells were plated 1*10^5 and transduced with adenoviral particles encoding TDP43 WT or carrying the pathological mutation M337V or A382T. 24h after transduction, cells were exposed to L-BMAA 3mM or LCS-MaCe 5 µg/µl for another 24h. Cell viability was assessed by MTS assay. (B) Total cell lysates were obtained from cells as in (A) and subjected to reducing SDS-PAGE and Western blot. Anti-TDP-43 antibody was used to visualize TDP-43 expression, anti-βactin as an equal loading control. (C) Biochemical fractionation of SHSY5Y cells treated as in (A) and cell lysates were separated into soluble and insoluble fractions and subsequently analyzed by immunoblotting. Anti-TDP-43 antibody was used to visualize TDP-43 expression and aggregation, β-actin as a control for equal loading of samples and correct fraction separation. (D) Quantification of results in (B) using ChemiDOC XRS+ system with Quantity One™ software. (E) Cells as in (A) were analyzed by immunofluorescence using an anti-myc. (F) Quantification of the data in (D). (G) Oxidative stress measured by measured using DCFDA. (H) ER stress analyzed by CHOP promoter induction in SH-SY5Y-CHOP-GPF stable clones as in Figure 1F (I) Quantification of GFP autofluorescence as represented in (H). Data in A-B-C-D-E and L are the mean and standard deviation ( ± SD) from at least three independent experiments. *, P < 0.05; **, P < 0.01, ***, P < 0.005. * respect to untreated of the same genotype, § respect to L-BMAA treatment among the different genotypes, + respect to LCS-MaCe treatment among the different genotypes. In order to minimize the variability of the experimental results, each data point in panel (B) consists of two biological replicates.
Figure 5
Figure 5
L-BMAA and LCS/MaCe treatments exacerbate the pathological phenotype in primary cutaneous fibroblasts from ALS patients. Primary cutaneous fibroblasts from healthy donors (CTR) or patients with sporadic ALS (sALS) or familial ALS (fSLA, TDP-43A382T) were exposed to L-BMAA 3mM or LCS-MaCe 5µg/µl for 24h. (A) Cell viability was assessed by MTS assay. (B) Cellular ROS were measured using DCFDA. The signal was detected with excitation/emission at 485 nm/535 nm of 1s in a multi-reader plate (Victor X5, PerkinElmer). (C) Protein localization was analyzed by immunofluorescence. TDP-43 signal was detected by primary anti-TDP-43 antibody and secondary goat anti-rabbit IgG Alexa Fluor® 647. Cells were analyzed using a Leica TCS SP5 confocal microscope. (D) Analysis of intracellular TDP-43 distribution with LAS lite 170 image software (Leica) using 3D viewer tool (E) Graphical representation of the data in (C) * respect to untreated of the same genotype, § respect to L-BMAA treatment among the different genotypes, + respect to LCS-MaCe treatment among the different genotypes. **, P < 0.01, ***, P < 0.005.

References

    1. Wilson DM, Cookson MR, Van Den Bosch L, Zetterberg H, Holtzman DM, Dewachter I. Hallmarks of neurodegenerative diseases. Cell. (2023) 186:693–714. doi: 10.1016/j.cell.2022.12.032 - DOI - PubMed
    1. Hou Y, Dan X, Babbar M, Wei Y, Hasselbalch SG, Croteau DL, et al. . Ageing as a risk factor for neurodegenerative disease. Nat Rev Neurol. (2019) 15:565–81. doi: 10.1038/s41582-019-0244-7 - DOI - PubMed
    1. Sini P, Dang TBC, Fais M, Galioto M, Padedda BM, Lugliè A, et al. . Cyanobacteria, cyanotoxins, and neurodegenerative diseases: dangerous liaisons. Int J Mol Sci. (2021) 22:8726. doi: 10.3390/ijms22168726 - DOI - PMC - PubMed
    1. Beri J, Nash T, Martin RM, Bereman MS. Exposure to BMAA mirrors molecular processes linked to neurodegenerative disease. Proteomics. (2017) 17:1700161. doi: 10.1002/pmic.201700161 - DOI - PMC - PubMed
    1. Dunlop RA, Banack SA, Bishop ES, Metcalf JS, Murch SJ, Davis DA, et al. . Is exposure to BMAA a risk factor for neurodegenerative diseases? A response to a critical review of the BMAA hypothesis. Neurotox Res. (2021) 39(1):81–106. doi: 10.1007/s12640-020-00302-0 - DOI - PMC - PubMed

Publication types