. 2024 Mar 25:15:1342335.
doi: 10.3389/fimmu.2024.1342335. eCollection 2024.

Differences in F pocket impact on HLA I genetic associations with autoimmune diabetes

Affiliations

Differences in F pocket impact on HLA I genetic associations with autoimmune diabetes

Xu Ren et al. Front Immunol. .

Abstract

Introduction: Human leukocyte antigen (HLA) I molecules present antigenic peptides to activate CD8+ T cells. Type 1 Diabetes (T1D) is an auto-immune disease caused by aberrant activation of the CD8+ T cells that destroy insulin-producing pancreatic β cells. Some HLA I alleles were shown to increase the risk of T1D (T1D-predisposing alleles), while some reduce this risk (T1D-protective alleles).

Methods: Here, we compared the T1D-predisposing and T1D-protective allotypes concerning peptide binding, maturation, localization and surface expression and correlated it with their sequences and energetic profiles using experimental and computational methods.

Results: T1D-predisposing allotypes had more peptide-bound forms and higher plasma membrane levels than T1D-protective allotypes. This was related to the fact that position 116 within the F pocket was more conserved and made more optimal contacts with the neighboring residues in T1D-predisposing allotypes than in protective allotypes.

Conclusion: Our work uncovers that specific polymorphisms in HLA I molecules potentially influence their susceptibility to T1D.

Keywords: HLA class I; antigen presentation; autoimmune diabetes; inflammation; peptide binding; polymorphism.


Conflict of interest statement

The authors declare that the research was conducted in the absence of any commercial or financial relationships that could be construed as a potential conflict of interest.

Figures

Figure 1
Figure 1
Surface expression of T1D-predisposing and protective HLA I allotypes. (A) Schematic representation of the constructs used in the study. (B, C) HeLa and HeLa ICP47 cells were transiently transfected with the indicated HLA I heavy chains. An empty vector (pMX-GFP-N1) served as a negative control. Surface expression of HLA I molecules was detected by flow cytometry using a monoclonal anti-HA antibody (clone: 12CA5) and anti-mouse secondary antibody conjugated with Alexa647, while the total expression was detected with a GFP signal. (B) Example flow cytometry data (for all representative data, see Supplementary Figure 4 ). The area of the scatter plots displaying GFP (x-axis) versus HA (y-axis) fluorescence was divided into several vertical sectors. Only the sectors containing 100 or more events were used for quantification. (C) The quantification of three independent experiments. The mean fluorescence intensity (MFI) of the HA signal was measured and normalized to that in region 1 of A*02:01 in untreated HeLa cells. Data from three independent experiments are represented as median and 95% confidence interval (CI). P values were calculated by two-way ANOVA with Tukey’s multiple comparisons test. Differences between the groups were analyzed by two-way ANOVA and Bonferroni correction. Only significantly different (<0.05) p values are included. GFP, green fluorescent protein; HA, hemagglutinin; IFN-γ, interferon-gamma; HLA, human leukocyte antigen; T1D, type 1 diabetes.
Figure 2
Figure 2
Maturation of T1D-predisposing and protective HLA I molecules. HeLa cells were transiently transfected with the indicated HLA I heavy chains fused with GFP. Half of the lysates were either treated with Endoglycosidase H (EndoH) or mock-treated before separation by 8% SDS-PAGE, transfer and detection with anti-GFP (1E10H7) antibody. (A) Representative western blots for each allotype. R, EndoH-resistant form; S, EndoH-sensitive form. (B) Quantification of three independent experiments. Percentage of mature HLA I was calculated as a ratio of the EndoH-resistant form to the total (sum of EndoH-resistant and EndoH-sensitive forms). Data are represented by scatter dot plot with median. Statistical significance was determined by one-way ANOVA and Tukey’s multiple comparisons test. Differences between the groups were analyzed by Welch’s t-test. P values <0.05 were considered significant and are included in the figure; ns, non-significant.
Figure 3
Figure 3
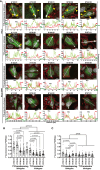
Intracellular localization of T1D-predisposing and protective HLA I allotypes. HeLa and HeLa ICP47 cells were transfected with HLA I–GFP (green), stained with actin marker, phalloidin (red) and DNA marker DAPI to stain nucleus (white), and imaged by confocal microscopy. (A) Representative merged images are shown (for the field of cells and single stains, see Supplementary Figure 5 ). The co-distribution of HLA I with phalloidin is marked with yellow arrows. Fluorescence intensity histograms over indicated lines are shown below each image. Green arrows (GFP) indicate peaks originating from the HLA I-GFP signal at the edge of the cell [PM, plasma membrane, further confirmed by cooccurrence with red arrows (phalloidin)], while “Max” shows the maximum expression of HLA I-GFP within the cell. HLA I-GFP distribution was analyzed and represented as a ratio of PM/Max for HeLa (B) and HeLa ICP47-myc (C) cells. More than 50 cells with similar GFP signal (corresponding to the GFP intensity in regions 2-5 in Figure 1B ) were assessed for each allotype, scale bar 10 μm. Data from three independent experiments are represented by a scatter dot plot with a median. Statistical difference was analyzed by Kruskal-Wallis and Dunn’s multiple comparisons test. Differences between the groups were analyzed by Mann-Whitney test. Only significantly different (<0.05) p values are included.
Figure 4
Figure 4
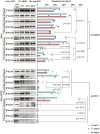
Peptide binding and thermal stability of T1D-predisposing and protective HLA I allotypes. HeLa and HeLa ICP47 cells were transiently transfected with the indicated HLA I heavy chains fused to GFP. Cell lysates were incubated under different temperatures (4°C, 37°C, and 50°C) for 10 min and immediately after, being placed at 4°C. Peptide-bound forms of HLA I were isolated using W6/32 antibody and visualized by western blot with anti-GFP antibody. The percentage of peptide-bound forms was calculated as W6/32-reactive HLA I allotype as the percentage of the total of this allotype. The representative membrane for each allotype from three independent experiments is shown. Data from three independent experiments are represented by scatter dot plot with median. P values were calculated by two-way ANOVA with Tukey’s multiple comparisons test. Differences between the groups were analyzed by two-way ANOVA and Bonferroni correction. Only significantly different (<0.05) p values are included. IP, immunoprecipitation; IB, immunoblot.
Figure 5
Figure 5
Characteristics of peptidomes of T1D-predisposing and protective HLA I allotypes. Sequences of peptides (8, 9 and 10-mers) derived from T1D auto-antigens produced by proteasome and delivered to the ER by TAP transporter were predicted using NetCTLpan1.1 (13) (for all the predicted peptides see Supplementary Table 2 ). Peptide binding to HLA I molecules was predicted using NetMHCpan4.1 and %Rank (–16). (A) Number of strong binders (SB, %Rank<0.5) and weak binders (WB, 0.5<%Rank<2). Number of non-binders (NB, %Rank>2) is not shown. Statistical significance was analyzed using Fisher’s exact test and Bonferroni correction. (B) Frequency of binders (%Rank<2) with different lengths. Statistical significance was analyzed using Fisher’s exact test and Bonferroni correction. (C) The binding affinity of the predicted peptidome is represented by IC50 by scatter dot plot with median. Statistical differences between T1D-predisposing and protective allotypes were determined using Man-Whitney test. For multiple comparisons see Supplementary Table 5 . ns, non-significant.
Figure 6
Figure 6
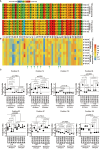
Sequence variation and energetic optimization of residues in the peptide-binding groove in T1D-predisposing and protective HLA I allotypes. (A) HLA I sequences were aligned using Praline (developed in the Centre for Integrative Bioinformatics Vrije Universiteit Amsterdam). The most polymorphic residues in the peptide-binding groove of HLA I allotypes included in this study were selected and represented. For the entire sequences of peptide-binding grooves, see Supplementary Figure 8 . Amino acid conservation is in the color-coded and numeric representation. Amino acids are represented by a single letter code; specifically, A, alanine; C, cysteine; D, aspartic acid; E, glutamic acid; G, glycine; F, phenylalanine; H, histidine; I, isoleucine; K, lysine; L, leucine; M, methionine; N, asparagine; P, proline; Q, glutamine; R, arginine; S, serine; T, threonine; V, valine; W, tryptophan, Y, tyrosine. The numbers at the bottom indicate the residue number. (B, C) Single Residue Frustration Indices (SRFI) of the polymorphic residues in peptide-binding grooves were downloaded from the online dataset (40). The median SRFI was calculated for each polymorphic residue from 100 peptide-HLA I models (10 models per allotype) of T1D-predisposing and protective allotypes and shown by heat map (B, C). The SRFIs of residues with a substantial difference between T1D-predisposing and protective allotypes are marked with green arrows (B) and illustrated by box plots with whiskers (min-max) (C). A frustration index less than -0.7 is defined as high frustration, while one more than 0.7 as minimal frustration. The number between -0.7 and 0.7 stands for neutral frustration. Statistical difference was analyzed by Kruskal-Wallis and Dunn’s multiple comparisons test. Differences between the groups were analyzed by Mann-Whitney test. Only significantly different (<0.05) p values are included.
Figure 7
Figure 7
Characterization of mutants with changed F pocket architecture. (A) Stability prediction by DynaMut web server (19) based on PDB files, A*02:01 (PDB: 5HHN), A*24:02 (PDB: 7JYV), B*39:01 (PDB: 4O2E), A*11:01 (PDB: 6JOZ) and B*57:01 (PDB: 2RFX). (B) F pocket interactions in A*02:01 WT and Y116D mutant, B*57:01 WT and S116Y mutant. (C) Surface expression of WT and mutated A*02:01 and B*57:01 in HeLa and HeLa ICP47 cell lines under normal and inflammatory conditions, example flow cytometry data (for all representative data, see Supplementary Figure 9 ). Data from two independent experiments are represented by median and 95% CI (confidence interval). (D) Thermal stability of A*02:01 WT, B*57:01 WT and corresponding mutants in HeLa and HeLa ICP47 cell lines. WT, wild-type. Data from three independent experiments are represented by scatter dot plot with median. P values in (C, D) were calculated by two-way ANOVA with Tukey’s multiple comparisons test. Only significantly different (<0.05) p values are included.

Similar articles

References

    1. Wieczorek E, Garstka MA. Recurrent bladder cancer in aging societies: importance of major histocompatibility complex class I antigen presentation. Int J Cancer. (2021) 148:1808–20. doi: 10.1002/ijc.33359 - DOI - PubMed
    1. Nakayama M, Michels AW. Using the T cell receptor as a biomarker in type 1 diabetes. Front Immunol. (2021) 12:777788. doi: 10.3389/fimmu.2021.777788 - DOI - PMC - PubMed
    1. Montealegre S, Venugopalan V, Fritzsche S, Kulicke C, Hein Z, Springer S. Dissociation of beta2-microglobulin determines the surface quality control of major histocompatibility complex class I molecules. FASEB J. (2015) 29:2780–8. doi: 10.1096/fj.14-268094 - DOI - PubMed
    1. DiMeglio LA, Evans-Molina C, Oram RA. Type 1 diabetes. Lancet. (2018) 391:2449–62. doi: 10.1016/S0140-6736(18)31320-5 - DOI - PMC - PubMed
    1. Noble JA, Valdes AM, Varney MD, Carlson JA, Moonsamy P, Fear AL, et al. . Hla class I and genetic susceptibility to type 1 diabetes: results from the type 1 diabetes genetics consortium. Diabetes. (2010) 59:2972–9. doi: 10.2337/db10-0699 - DOI - PMC - PubMed

Publication types

MeSH terms