. 2024 Jun 24;52(11):6171-6182.
doi: 10.1093/nar/gkae239.

HELLS regulates transcription in T-cell lymphomas by reducing unscheduled R-loops and by facilitating RNAPII progression

Affiliations

HELLS regulates transcription in T-cell lymphomas by reducing unscheduled R-loops and by facilitating RNAPII progression

Annalisa Tameni et al. Nucleic Acids Res. .

Abstract

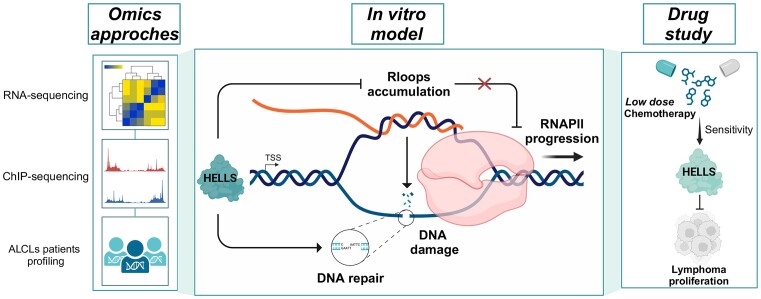
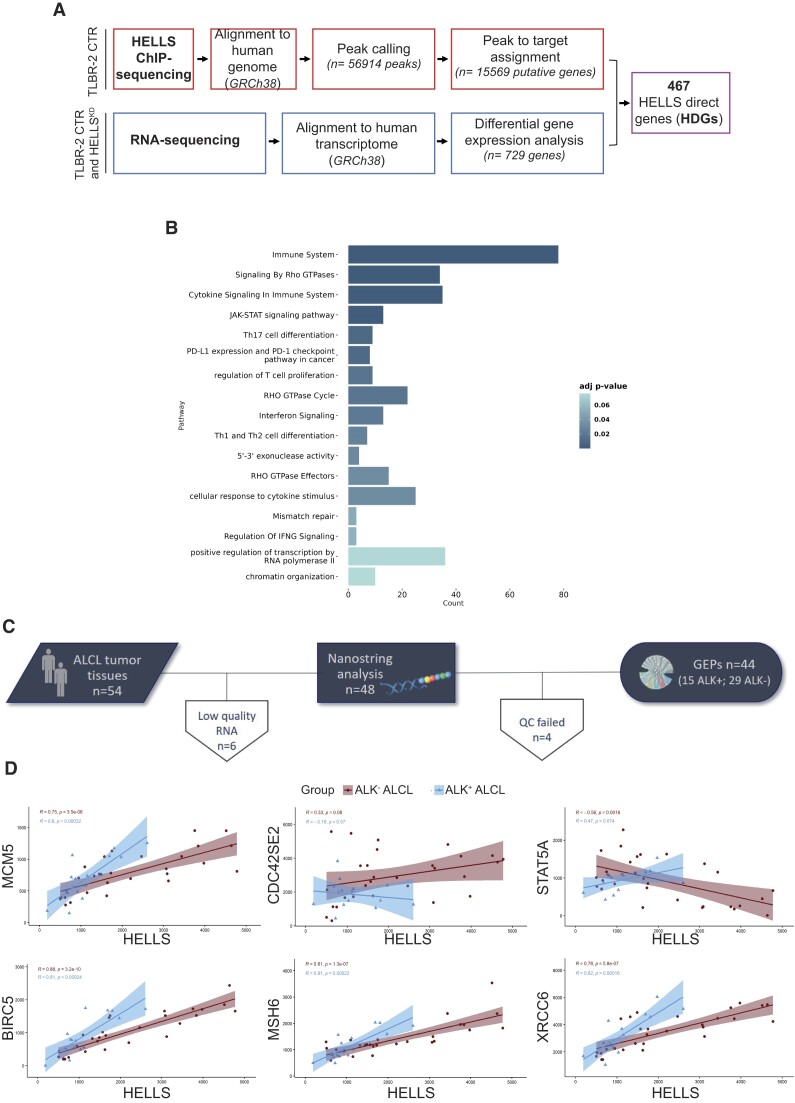
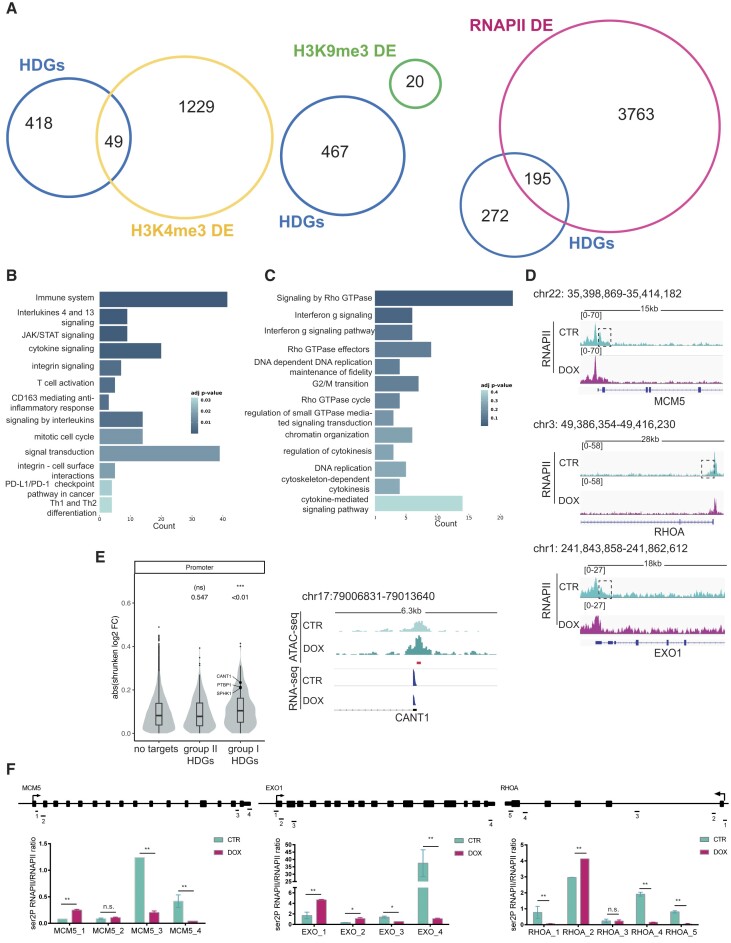
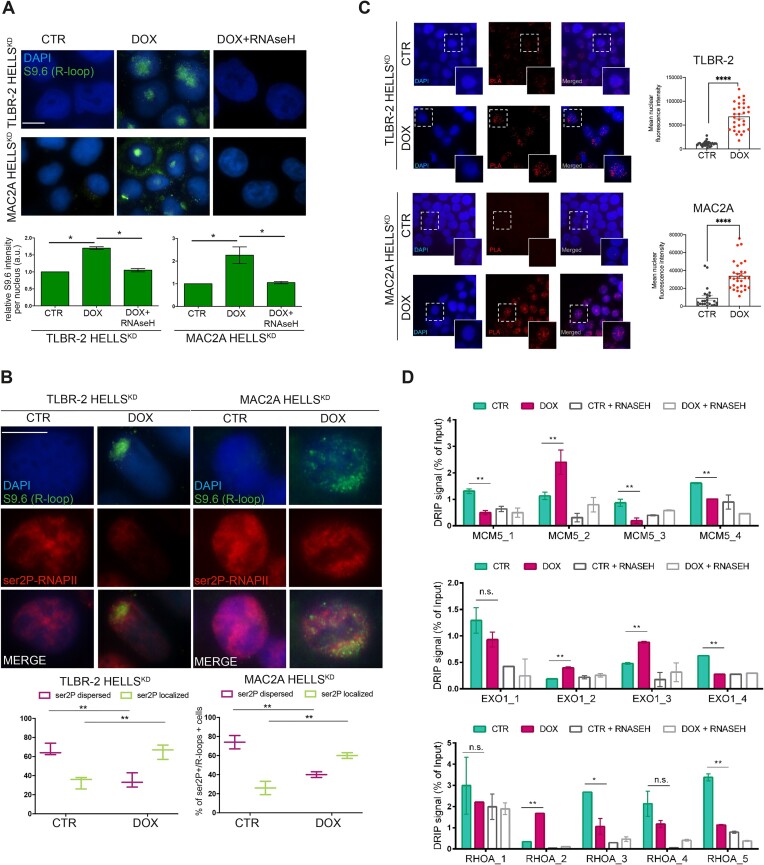
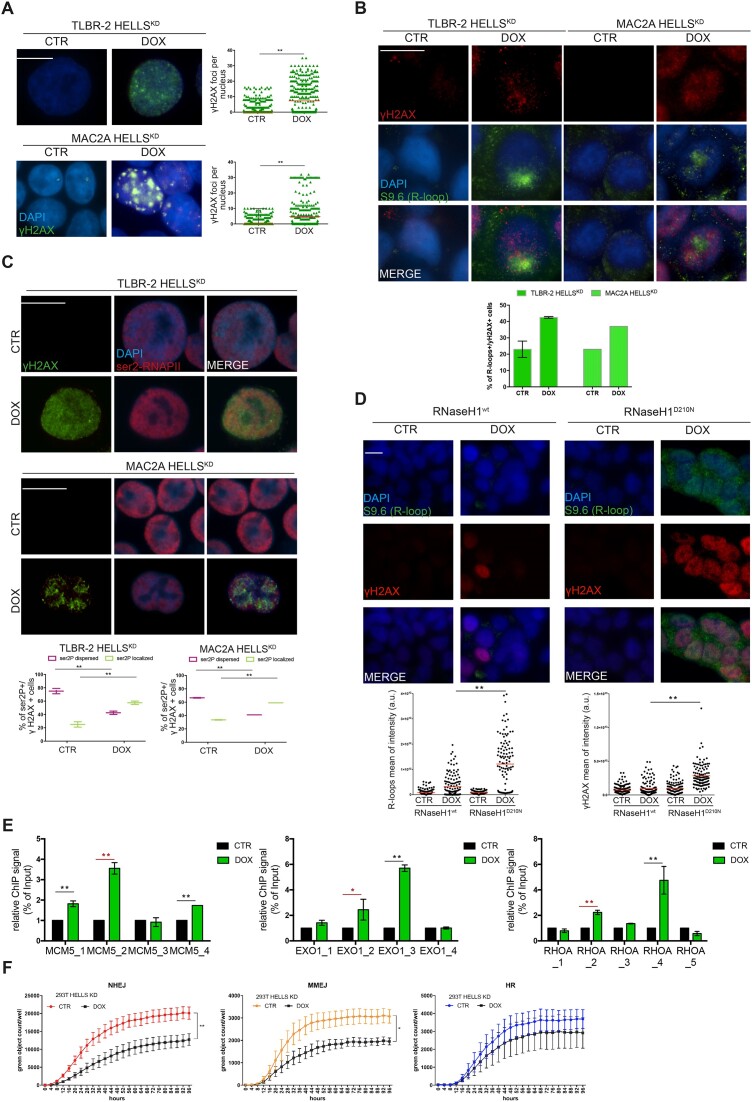
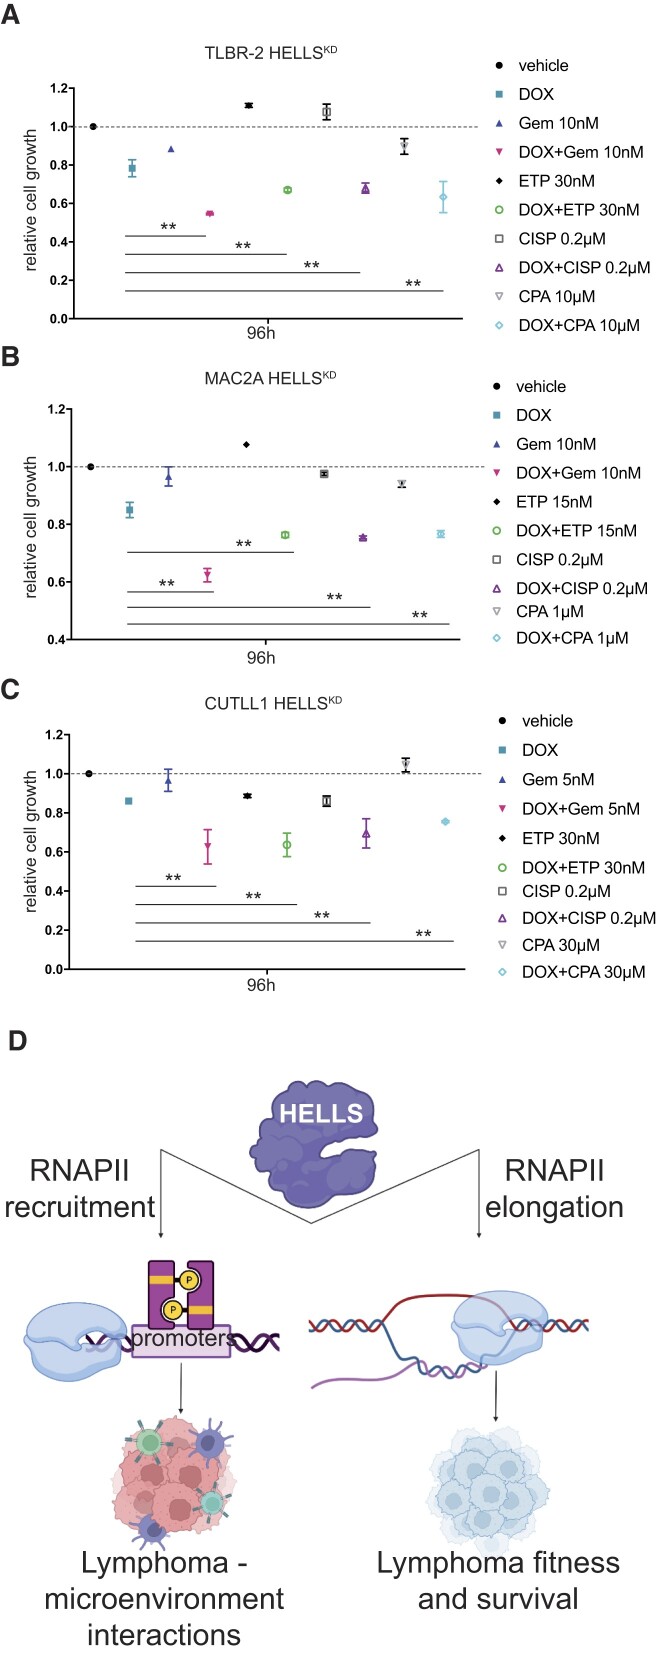
Chromatin modifiers are emerging as major determinants of many types of cancers, including Anaplastic Large Cell Lymphomas (ALCL), a family of highly heterogeneous T-cell lymphomas for which therapeutic options are still limited. HELLS is a multifunctional chromatin remodeling protein that affects genomic instability by participating in the DNA damage response. Although the transcriptional function of HELLS has been suggested, no clues on how HELLS controls transcription are currently available. In this study, by integrating different multi-omics and functional approaches, we characterized the transcriptional landscape of HELLS in ALCL. We explored the clinical impact of its transcriptional program in a large cohort of 44 patients with ALCL. We demonstrated that HELLS, loaded at the level of intronic regions of target promoters, facilitates RNA Polymerase II (RNAPII) progression along the gene bodies by reducing the persistence of co-transcriptional R-loops and promoting DNA damage resolution. Importantly, selective knockdown of HELLS sensitizes ALCL cells to different chemotherapeutic agents, showing a synergistic effect. Collectively, our work unveils the role of HELLS in acting as a gatekeeper of ALCL genome stability providing a rationale for drug design.


Figures

Graphical Abstract
Graphical Abstract
Figure 1.
Figure 1.
Transcriptional landscape of HELLS in T-cell Lymphomas. (A) Schematic workflow for the identification of HELLS direct genes (HDGs). (B) GO enrichment bar plot of the most significantly enriched pathways (adjusted P-value < 0.05) for HDGs. Colors indicate the adjusted P-values and the size of bars is proportional to the ratio of differentially expressed genes on the total genes of the given pathway. (C) Outline of the study workflow for validating HELLS signature in the FFPE retrospective cohorts of ALCL by the nCounter platform. (D) Correlation plots of HELLS and a selection of HDGs in ALK ALCL and ALK+ ALCL patients. For each gene pair, the expression HELLS is on the x-axis, while the expression HDGs is on the y-axis. Blue and red areas represent 95% confidence intervals.
Figure 2.
Figure 2.
Loss of HELLS alters RNAPII dynamics. (A) The Venn diagrams show the overlap, the number of genes identified in each condition, and the number of HELLS direct genes (HDGs) that are differentially enriched (DE) for the trimethylated histone H3 on Lysine 4 (H3K4me3), trimethylated histone H3 on Lysine 9 (H3K9me3) and RNA-Polymerase II (RNAPII) in TLBR-2 HELLSKD cells relative to control. (B) GO enrichment bar plots of the most significantly enriched pathways (adjusted P-value < 0.05) for HELLS direct genes (HDGs) belonging to group I (n = 195). Colors indicate the adjusted P-values and the size of the bars is proportional to the ratio of differentially expressed genes to the total of genes of the given pathway. (C) GO enrichment bar plots of the most significantly enriched pathways (adjusted P-value < 0.05) for group II of HDGs (n = 272). Colors indicate the adjusted P-values, and the size of bars is proportional to the ratio of differentially expressed genes to the total of genes of the given pathway. (D) RNAPII enrichment profile of representative HELLS direct genes in TLBR-2 HELLSKD (DOX) and control (CTR) cells. (E) The violin plot shows changes in chromatin accessibility—after HELLS KD in TLBR-2 cells—between genes that are not bound by HELLS (no targets) and groups I and II of HDGs. On top, P-values associated with beta coefficients estimated by linear regression model with log2 shrunken fold-change as the response variable, and gene groups as the independent variable (left panel). Example of an ATAC-seq and RNA-seq IGV browser view in a representative HDG in TLBR-2 control and HELLSKD. The y-axis represents the normalized tag densities relative to hg19 genomic coordinates. The red bar represents the HELLS peak (based on ChIP-seq analysis) (right panel). (F) ChIP-RT-qPCR detection of ser2P-RNAPII normalized on total RNAPII levels for HDGs in TLBR-2 cell line. Data are representative of five independent experiments and are shown as the mean ± SEM. Two-tailed t-test. *P < 0.05; **P < 0.01.
Figure 3.
Figure 3.
Loss of HELLS leads to co-transcriptional R-loops accumulation. (A) Representative immunofluorescences showing the presence of R-loops in HELLSKD cells in the absence (CTR) or presence (DOX) of doxycycline to induce shRNA against HELLS (48 h) and after treatment with RNase H1. Cells were stained with S9.6 antibody and DAPI. The white scale bar represents 10 μm. For specific quantification of nuclear S9.6 staining, regions of interest were overlaid on the DAPI signal and selectively quantified to exclude cytoplasmic S9.6 signal and nucleolar S9.6 signal (n = 3 independent experiments). Relative bar plots indicate the intensity of S9.6-stained cells per nucleus (n = 1000 cells). Each data represents the mean ± SEM (n = 3). Two-tailed t-test. *P < 0.05; **P < 0.01 relative to CTR. (B) Immunofluorescences show the distribution of ser2P-RNAPII and R-loops in HELLSKD cells. Cells were stained with ser2P-RNAPII, S9.6 antibodies, and DAPI. The white scale bar represents 10 μm. Relative box plots indicate the distribution of ser2P-RNAPII of S9.6 positive cells (n = 500 cells). Each data represents the mean ± SEM (n = 3). Two-tailed t-test. *P < 0.05; **P < 0.01 relative to CTR. (C) Representative in situ proximity ligation assay (PLA) showing the interaction between R-loops and ser2P-RNAPII in TLBR-2 and MAC2A cell models, comparing CTR versus DOX conditions. Each red spot represents a single interaction between the two targets. DNA was stained with DAPI (in blue). Quantification of dots per cell is represented in the graph on the right by analyzing the mean nuclear fluorescence intensity as described in Materials and methods. Statistical analyses were performed with a t-test and specified with asterisks (**P < 0.01, ***P < 0.001, ****P < 0.0001). Data are represented as mean ± SEM. (D) Representative DRIP‐qPCR signal values at the MCM5, EXO1 and RHOA loci in TLBR-2 control and HELLSKD cells w/o pretreatment with RNase H. Each data represents the mean ± SEM. Two-tailed t-test. *P < 0.05; **P < 0.01 relative to CTR.
Figure 4.
Figure 4.
HELLS manages DNA damage repair. (A) Quantification and representative IF images of γH2AX intensities in HELLSKD cells. The white scale bar represents 10 μm. Data presented as mean ± SEM (n = 3 separate experiments, 500 cells analyzed in each experiment). Quantification and representative IF images of γH2AX and nuclear S9.6 intensities (B) and ser2P-RNAPII and nuclear S9.6 intensities (C) in HELLSKD cells. The white scale bar represents 10 μm. Data presented as mean ± SEM (n = 3 separate experiments, 500 cells analyzed in each experiment). (D) Quantification and representative IF images of R-loops and γH2AX intensities in 293T HELLSKD cells overexpressing wild-type (WT) and D210N mutant RNase H1. The white scale bar represents 10 μm. Data is representative of n = 3 independent experiments (>150 cells analyzed in each experiment). Red bars represent the mean of S9.6 or γH2AX intensities of the indicated cell populations. (E) ChIP-RT-qPCR detection of γH2AX levels for representative HDGs in TLBR-2 cell line. Data are represented as relative % of input over CTR and are presented as mean ± SEM (n = 2 independent experiments). Two-tailed t-test. *P < 0.05; **P < 0.01 (in red the regions affected by R-loops accumulation and ser2P-RNAPII stall). (F) The effects of HELLS-KD on NHEJ, MMEJ and HR efficiency were examined in 293T HELLSKD cells using the GFP reporter assay.
Figure 5.
Figure 5.
Loss of HELLS sensitizes to low doses of drugs. Graphs showing the relative cell growth of TLBR-2 HELLSKD (A), MAC2A HELLSKD (B) and CUTLL1 HELLSKD (C) cells in the absence (CTR) and in presence (DOX) of doxycycline and treated with different chemotherapeutic drugs (Gem: gemcitabine, ETP: etoposide, CISP: cisplatin, CPA: cyclophosphamide) for 96 h. (D) Graphical model of HELLS function in T-cell lymphomas. Created with BioRender.com

References

    1. Alaggio R., Amador C., Anagnostopoulos I., Attygalle A.D., Araujo I.B.D.O., Berti E., Bhagat G., Borges A.M., Boyer D., Calaminici M. et al. . The 5th edition of the World Health Organization Classification of Haematolymphoid Tumours: lymphoid Neoplasms. Leukemia. 2022; 36:1720–1748. - PMC - PubMed
    1. Fiore D., Cappelli L.V., Broccoli A., Zinzani P.L., Chan W.C., Inghirami G. Peripheral T cell lymphomas: from the bench to the clinic. Nat. Rev. Cancer. 2020; 20:323–342. - PubMed
    1. Bradner J.E., Hnisz D., Young R.A. Transcriptional addiction in cancer. Cell. 2017; 168:629–643. - PMC - PubMed
    1. Crossley M.P., Bocek M., Cimprich K.A. R-loops as cellular regulators and genomic threats. Mol. Cell. 2019; 73:398–411. - PMC - PubMed
    1. Chen X., Li Y., Rubio K., Deng B., Li Y., Tang Q., Mao C., Liu S., Xiao D., Barreto G. et al. . Lymphoid-specific helicase in epigenetics, DNA repair and cancer. Br. J. Cancer. 2022; 126:165–173. - PMC - PubMed

MeSH terms