. 2024 Jun 10;52(10):5732-5755.
doi: 10.1093/nar/gkae250.

Somatic and intergenerational G4C2 hexanucleotide repeat instability in a human C9orf72 knock-in mouse model

Affiliations

Somatic and intergenerational G4C2 hexanucleotide repeat instability in a human C9orf72 knock-in mouse model

Nada Kojak et al. Nucleic Acids Res. .

Abstract

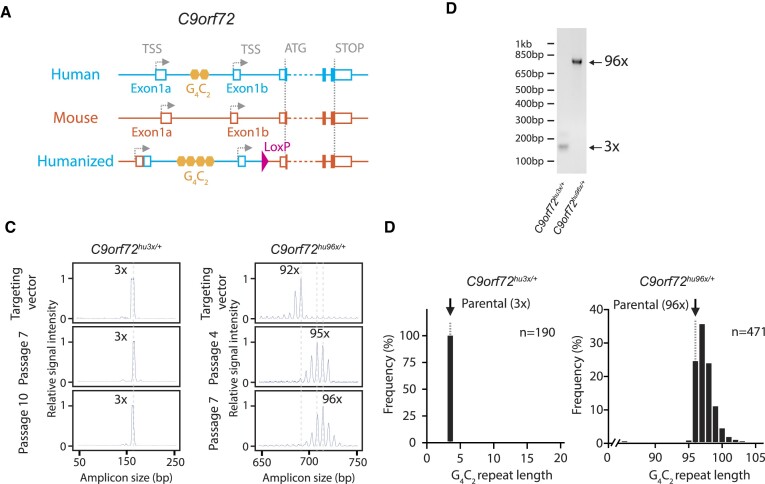
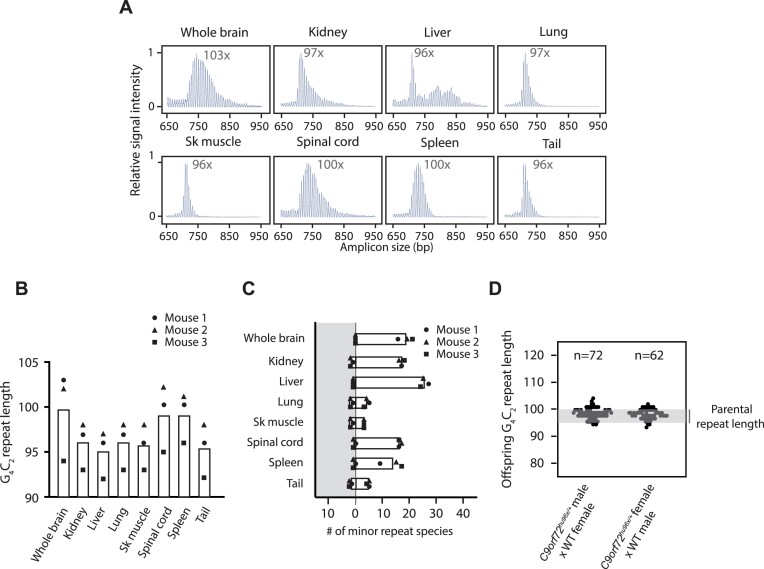
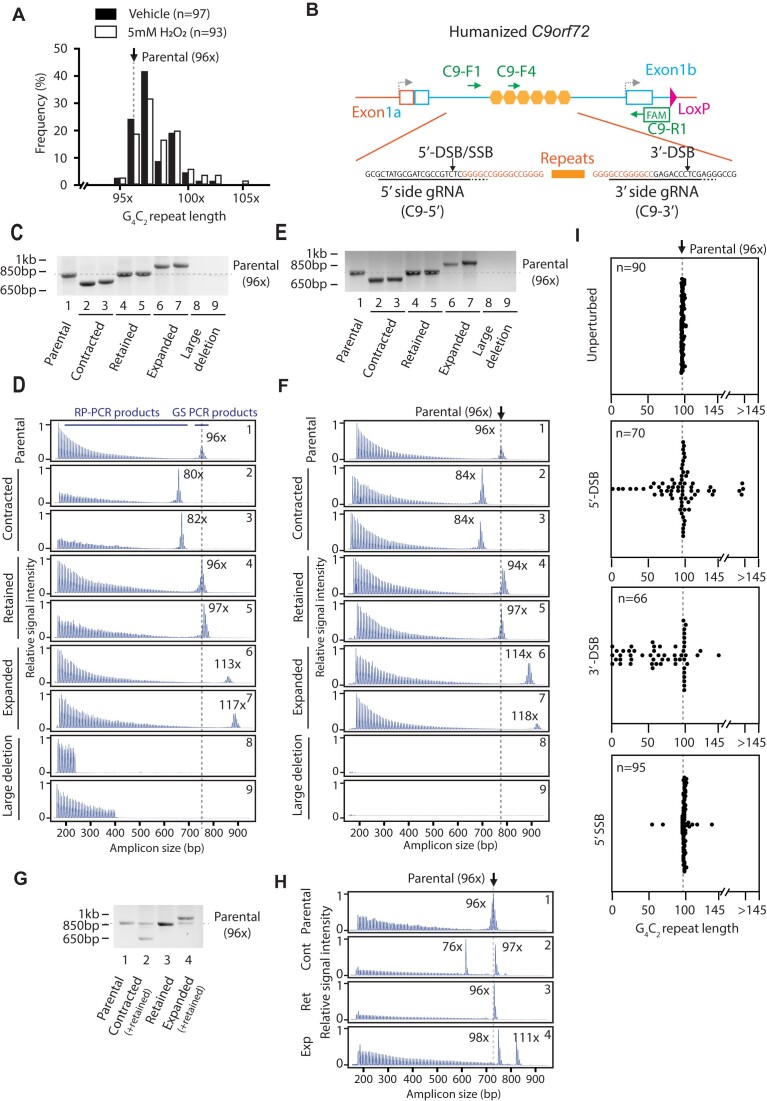
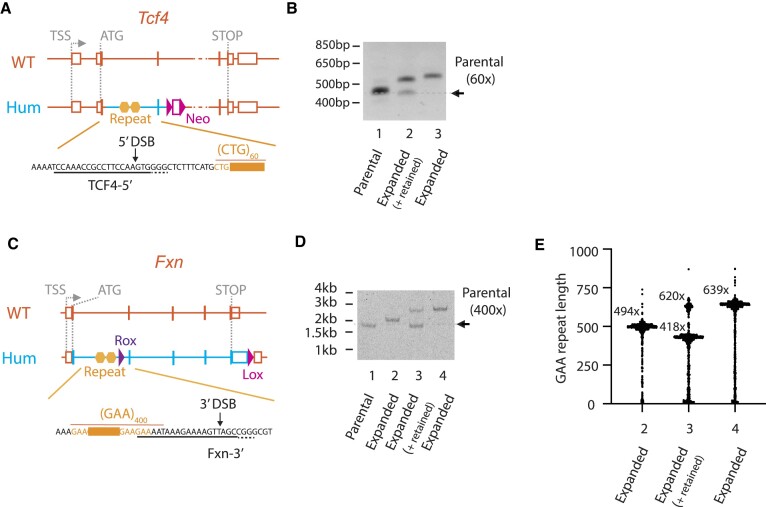
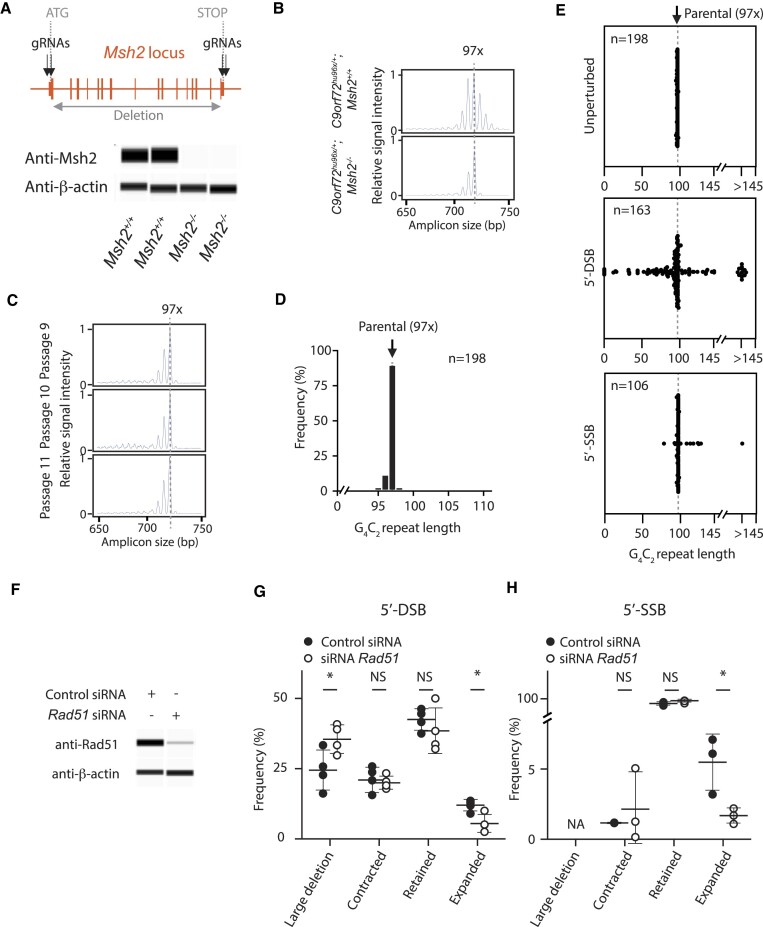
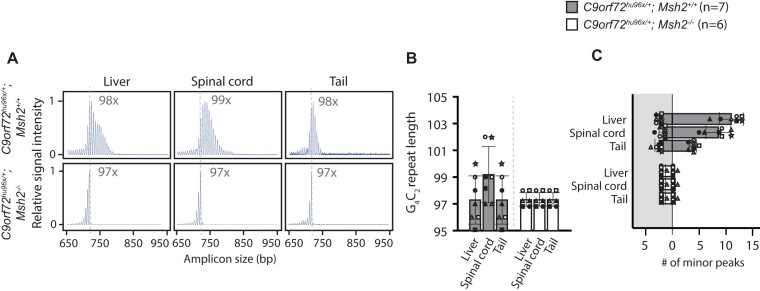
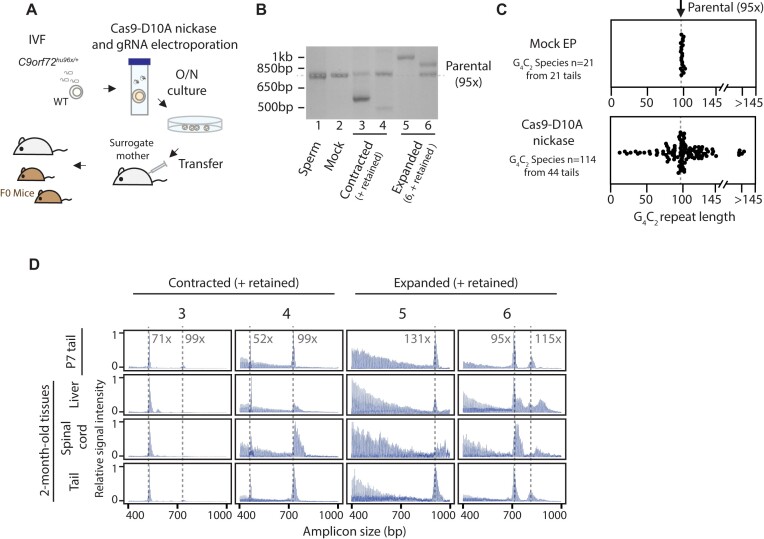
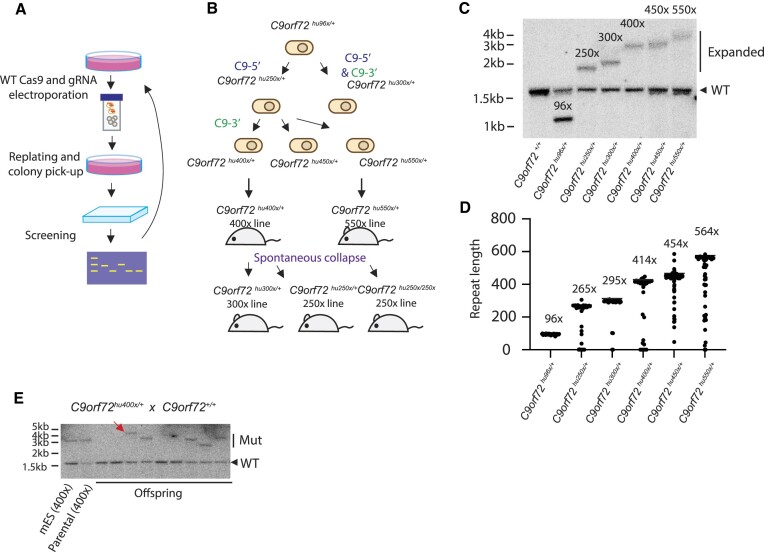
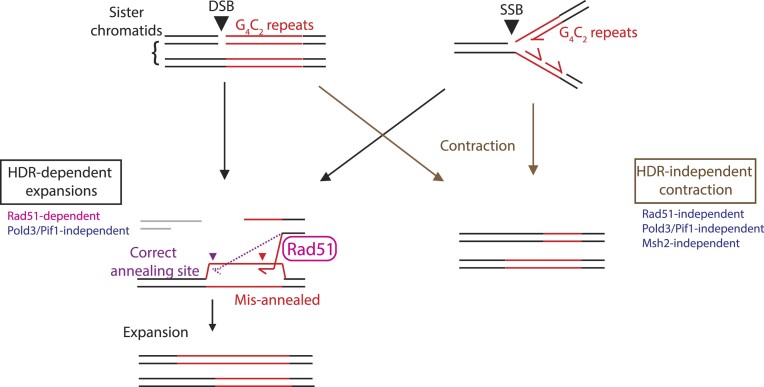
Expansion of a G4C2 repeat in the C9orf72 gene is associated with familial Amyotrophic Lateral Sclerosis (ALS) and Frontotemporal Dementia (FTD). To investigate the underlying mechanisms of repeat instability, which occurs both somatically and intergenerationally, we created a novel mouse model of familial ALS/FTD that harbors 96 copies of G4C2 repeats at a humanized C9orf72 locus. In mouse embryonic stem cells, we observed two modes of repeat expansion. First, we noted minor increases in repeat length per expansion event, which was dependent on a mismatch repair pathway protein Msh2. Second, we found major increases in repeat length per event when a DNA double- or single-strand break (DSB/SSB) was artificially introduced proximal to the repeats, and which was dependent on the homology-directed repair (HDR) pathway. In mice, the first mode primarily drove somatic repeat expansion. Major changes in repeat length, including expansion, were observed when SSB was introduced in one-cell embryos, or intergenerationally without DSB/SSB introduction if G4C2 repeats exceeded 400 copies, although spontaneous HDR-mediated expansion has yet to be identified. These findings provide a novel strategy to model repeat expansion in a non-human genome and offer insights into the mechanism behind C9orf72 G4C2 repeat instability.


Figures

Graphical Abstract
Graphical Abstract
Figure 1.
Figure 1.
Humanized C9orf72 alleles. (A) Humanized C9orf72 allele schematic. Orange: mouse; blue: human; yellow hexagons: G4C2 repeats. TSS: Transcription start site. (B) 2-primer gene-specific PCR analysis of the G4C2 repeats in targeted ES cells. (C) RP-PCR analysis of the targeting vectors, C9orf72hu3x/+ ES cells (passages 7 and 10), C9orf72hu96x/+ ES cells (passages 4 and 7). Capillary electrophoresis (CE) traces of gene-specific PCR products shown. (D) The G4C2 repeat length after a single subcloning C9orf72hu3x/+ ES cells and C9orf72hu96x/+ ES cells. n = 190 and n = 471 subclones analyzed respectively. Parental repeat lengths shown as dotted lines.
Figure 2.
Figure 2.
Somatic and intergenerational repeat instability in C9orf72hu96/+ mice. (A) Representative 3-primer RP-PCR CE traces from 6 months-old C9orf72hu96x/+ tissues. The G4C2 repeat length (the G4C2 repeat copy number corresponding to the highest peak in the CE traces) is indicated in the graphs. Sk muscle: skeletal muscle. (B) The G4C2 repeat length in tissues. Each circle, triangle and square represents an individual sample. White bars indicate mean values. n = 3 mice analyzed. (C) Quantification of the minor G4C2 repeat species. The number of peaks larger (white background), and smaller (grey background) than the highest peak in indicated tissues is shown. Each circle, triangle, and square represents an individual sample. White bars indicate mean values. n = 3 mice analyzed. (D) Intergenerational repeat instability. The repeat length in the offspring from C9orf72hu96x/+ heterozygous mice bred with WT. n = 72 and n = 62 mice analyzed from paternal and maternal inheritance respectively.
Figure 3.
Figure 3.
G4C2 repeat expansions induced by a DNA DSB or SSB in mES cells. (A) G4C2 repeat length changes by H2O2 treatment. C9orf72hu96x/+ ES cells were treated with H2O2 or vehicle for 15 min and the repeat length was analyzed after subcloning. Parental repeat length shown as dotted line. (B) DSB/SSB introduction by CRISPR-Cas9 at the C9orf72 G4C2 locus. Schematic of the C9orf72 G4C2 locus shown on the top. Green arrows indicate PCR primers. C9-R1 reverse primer is FAM-labelled for CE analysis. C9-F4 forward primer serves as a G4C2 repeat-priming for RP-PCR. C9-F1/C9-R1 and C9-F1/C9-F4/C9-R1 were used for 2-primer gene-specific PCR and 3-primer RP-PCR respectively. Cas9 guide sequences and cleavage sites are shown in the bottom. (C) Analysis of the G4C2 repeat locus by 2-primer gene-specific PCR after 5′-DSB introduction in mES cells. Gel electrophoresis of amplicons from representative clones shown. A dotted line indicates the G4C2 repeat length in the parental clone (96 copies of G4C2 repeats). (D) 3-primer RP-PCR CE traces from representative clones after 5′-DSB introduction in mES cells. The numbers at top right corner correspond to the lane number in (C). The G4C2 repeat length corresponding to the highest CE peak is indicated in the panels. A dotted line indicates the G4C2 repeat length in the parental clone (96 copies of G4C2 repeats). In the top parental panel, RP-PCR products derived from repeat-primed reaction (C9-F4/C9-R1 reaction in B) and gene-specific (GS) PCR products derived from C9orf72 gene sequence-specific reaction (C9-F1/C9-R1) are indicated. (E) Analysis of the G4C2 repeat locus by 2-primer gene-specific PCR after 3′-DSB introduction in mES cells. (F) 3-primer RP-PCR CE traces from representative clones after 3′-DSB introduction in mES cells. The numbers at top right corner correspond to the lane number in (E). (G) Analysis of the G4C2 repeat locus by 2-primer gene-specific PCR after 5′-SSB introduction in mES cells. (H) 3-primer RP-PCR CE traces from representative clones after 5′-SSB introduction in mES cells. The numbers at top right corner correspond to the lane number in (G). Cont: contracted; Ret: retained; Exp: expanded. (I) The G4C2 repeat length after introducing indicated DNA lesions in mES cells. Representative data from a 96-well plate analysis shown. Dotted lines indicate the G4C2 repeat length in the parental clone (96 copies of G4C2 repeats). Due to the assay detection limit, those clones with >145 copies of G4C2 repeats were grouped in the graphs.
Figure 4.
Figure 4.
Repeat expansions by a DNA DSB at the Tcf4 CTG repeats and the Fxn GAA repeats in mES cells. (A) Humanized Tcf4 allele schematic. gRNA sequence and Cas9 cleavage site are shown in the bottom. (B) The Tcf4 CTG repeat expansions by 5′-DSB in mES cells. 2-primer gene-specific PCR amplicons from two largest repeat expanded clones shown. A dotted line indicates parental repeat length (60 copies of CTG). (C) Humanized Fxn allele schematic. gRNA sequence and Cas9 cleavage site are shown in the bottom. (D) The Fxn GAA repeat expansions by 3′-DSB in mES cells. 2-primer gene-specific PCR amplicons from repeat expanded clones shown. A dotted line indicates parental repeat length (400 copies of GAA). (E) Nanopore sequencing/STRique repeat analysis. Most frequently called repeat length(s) shown as horizontal bars and numbers. The numbers on X-axis correspond to the lane numbers in (D). The number of nanopore sequence reads used for STRique analysis were, 2 (n = 763), 3 (n = 693) and 4 (n = 899), respectively. Orange: mouse; blue: human; yellow hexagons: gene-specific repeats. TSS: transcription start site.
Figure 5.
Figure 5.
DNA DSB/SSB-induced repeat expansions are HDR-dependent. (A) Top, Msh2 null allele schematic. gRNA locations for gene deletion indicated. Bottom, western blotting analysis to confirm deletion of Msh2 in C9orf72hu96x/+; Msh2−/− ES cells. (B) 3-primer RP-PCR CE traces from C9orf72hu96x/+; Msh2+/+ and C9orf72hu96x/+; Msh2−/− ES cells. A dotted line indicates the G4C2 repeat length in the parental clone (97 copies of G4C2 repeats). (C) 3-primer RP-PCR CE traces from C9orf72hu96x/+; Msh2−/− ES cells at indicated passages. A dotted line indicates 97 copies of G4C2 repeats. (D) The G4C2 repeat length after a single subcloning C9orf72hu96x/+; Msh2−/− ES cells. n = 198 subclones analyzed. A dotted line indicates the G4C2 repeat length in the parental clone (97 copies of G4C2 repeats). (E) The G4C2 repeat length analysis after indicated DNA lesions in C9orf72hu96x/+; Msh2−/− ES cells. n = 198, n = 163 and n = 106 clones were analyzed in unperturbed condition, or after 5′-DSB and 5′-SSB, respectively. A dotted line indicates the G4C2 repeat length in the parental clone (97 copies of G4C2 repeats). Due to the assay detection limit, those clones with >145 copies of G4C2 repeat were grouped in the graphs. (F) Anti-Rad51 western blotting analysis to confirm siRNA efficiency in C9orf72hu96x/+ ES cells. (GH) Frequencies of the indicated changes after 5′-DSB (G) or 5′-SSB (H) introduction with Rad51 siRNA in C9orf72hu96x/+ ES cells. Four (G) and three (H) independent experiments were performed respectively. * P< 0.05. NS, not significant. NA, not applicable.
Figure 6.
Figure 6.
G4C2 somatic repeat instability in C9orf72hu96x/+; Msh2−/ mice. (A) Representative 3-primer RP-PCR CE traces from 2 months-old C9orf72hu96x/+; Msh2+/+ and C9orf72hu96x/+; Msh2−/− tissues. The G4C2 repeat length (the G4C2 repeat copy number of the most abundant species corresponding to the highest peak in CE) is indicated in the graphs. Dotted lines represent the repeat length (97 copies of G4C2 repeats) in the C9orf72hu96x/+; Msh2−/− mES cells. (B) The G4C2 repeat length in C9orf72hu96x/+; Msh2+/+ and C9orf72hu96x/+; Msh2−/− tissues. Each symbol represents individual sample. Vertical bars indicate mean values. (C) Quantification of the minor G4C2 repeat species. The number of peaks larger (white background), and smaller (grey background) than the highest peak shown. Same symbols in (B) and (C) (within the same group) represent samples derived from the same animal.
Figure 7.
Figure 7.
Repeat expansions by DNA SSB in one-cell embryos. (A) One-cell embryo Cas9-D10A nickase and gRNA injection workflow. In vitro fertilized embryos received Cas9-D10A nickase and C9-5′ gRNA by electroporation. Embryos were cultured overnight and transferred into pseudo-pregnant females. Tails and other tissues from resulting mice were analyzed at P7 (tails) and at 2 months of age (tissues). IVF, in vitro fertilization. Grey mice, surrogate mother. Brown mice, VelociMice (100% ES cell-derived F0 mice). (B) Gene-specific 2-primer PCR products following Cas9-D10A nickase and gRNA one-cell embryo injection. Gel electrophoresis of amplicons from representative P7 tail genomic DNA samples shown. Dotted line indicates the G4C2 repeat length in sperm donor (95 copies of G4C2). (C) The G4C2 repeat species in tails from mice generated by mock (top) or Cas9-D10A nickase (bottom) one-cell embryo injection. 114 G4C2 repeat species detected from total of 44 mice analyzed in nickase injection group. No mosaicism was observed in mock injection group. See Supplementary Figure S8 for detailed characterization in individual mouse. Dotted line indicates the G4C2 repeat length in sperm donor (95 copies of G4C2). (D) RP-PCR CE traces from C9orf72hu96x/+ P7 tails and 2-month-old C9orf72hu96x/+ tissues that received Cas9-D10A and gRNA at one-cell embryo stage. The numbers on top of each column correspond to the lanes in (B). The dotted lines correspond to the peaks detected in P7 tail samples.
Figure 8.
Figure 8.
Generating larger C9orf72 repeat alleles. (A,B) Workflow to generate larger C9orf72 G4C2 repeat alleles in ES cells and mice. 96 copies of G4C2 repeats in C9orf72hu96x/+ mES cell clone was expanded by WT Cas9 and gRNAs. The repeat expansions were screened by 2-primer gene specific PCR, and selected clones were subjected to the second round of repeat expansion (A). C9orf72hu250x/+ and C9orf72hu300x/+ mES clones were obtained from C9orf72hu96x/+ mES cell clone, and C9orf72hu400x/+, C9orf72hu450x/+ and C9orf72hu550x/+ mES cell clones were obtained from C9orf72hu250x/+ mES cell clone. In mice, during colony maintenance, novel 250× and 300× lines were generated from 400× and 550× lines (B). (C) Southern blotting analysis of the repeat length of humanized C9orf72 allelic series in mES cells. Estimated G4C2 repeat length indicated. Note the Southern blotting probe was designed to recognize both WT and humanized alleles. (D) STRique analysis of the humanized C9orf72 allelic series in mES cells using nanopore sequencing reads. Most frequently called repeat length shown as horizontal bars and numbers. Number of nanopore sequence reads used for the STRique analysis were, C9orf72hu96x/+ (n = 79), C9orf72hu250x/+ (n = 50), C9orf72hu300x/+ (n = 44), C9orf72hu400x/+ (n = 33), C9orf72hu450x/+ (n = 143) and C9orf72hu550x/+ (n = 50). (E) A representative C9orf72 repeat length analysis using tail biopsies by Southern blotting. A litter of offspring from breeding pair C9orf72hu400x/+ male and WT female mice were analyzed. One of the offspring had approximately 700 copies of G4C2 repeats (red arrow).
Figure 9.
Figure 9.
Model of the repeat expansions and contractions by a DNA DSB or SSB. Following a DSB introduction adjacent to the G4C2 repeats (repeats shown in red), a broken DNA end with G4C2 repeat sequence, after end-processing, invades into the sister-chromatid but can misalign within the G4C2 repeats at ‘out-of-register’ position, which could result in the repeat expansion. A SSB during S phase can generate one-ended or two-ended DSB (one of the ends shown in light grey lines indicating possibilities of both one-ended and two-ended DSB). Misalignment during HDR could also explain SSB-induced expansions. These SSB-induced expansions, as well as DSB-induced expansions, occurred in a Pold3- or Pif1-independent manner. DSB and SSB also induced repeat contractions, but they occurred mainly via non-HDR pathways.

Similar articles

Cited by

  • Intersection of the fragile X-related disorders and the DNA damage response.
    Kumari D, Grant-Bier J, Kadyrov F, Usdin K. Kumari D, et al. DNA Repair (Amst). 2024 Dec;144:103785. doi: 10.1016/j.dnarep.2024.103785. Epub 2024 Nov 7. DNA Repair (Amst). 2024. PMID: 39549538 Review.
  • Recurrent DNA nicks drive massive expansions of (GAA)n repeats.
    Li L, Scott WS, Khristich AN, Armenia JF, Mirkin SM. Li L, et al. Proc Natl Acad Sci U S A. 2024 Dec 3;121(49):e2413298121. doi: 10.1073/pnas.2413298121. Epub 2024 Nov 25. Proc Natl Acad Sci U S A. 2024. PMID: 39585990 Free PMC article.
  • C9orf72 repeat expansion creates the unstable folate-sensitive fragile site FRA9A.
    Mirceta M, Schmidt MHM, Shum N, Prasolava TK, Meikle B, Lanni S, Mohiuddin M, McKeever PM, Zhang M, Liang M, van der Werf I, Scheers S, Dion PA, Wang P, Wilson MD, Abell T, Philips EA, Sznajder ŁJ, Swanson MS, Mehkary M, Khan M, Yokoi K, Jung C, de Jong PJ, Freudenreich CH, McGoldrick P, Yuen RKC, Abrahão A, Keith J, Zinman L, Robertson J, Rogaeva E, Rouleau GA, Kooy RF, Pearson CE. Mirceta M, et al. NAR Mol Med. 2024 Nov 12;1(4):ugae019. doi: 10.1093/narmme/ugae019. eCollection 2024 Oct. NAR Mol Med. 2024. PMID: 39669124 Free PMC article.

References

    1. Lander E.S., Linton L.M., Birren B., Nusbaum C., Zody M.C., Baldwin J., Devon K., Dewar K., Doyle M., FitzHugh W. et al. . Initial sequencing and analysis of the human genome. Nature. 2001; 409:860–921. - PubMed
    1. Khristich A.N., Mirkin S.M. On the wrong DNA track: molecular mechanisms of repeat-mediated genome instability. J. Biol. Chem. 2020; 295:4134–4170. - PMC - PubMed
    1. Depienne C., Mandel J.L. 30 years of repeat expansion disorders: what have we learned and what are the remaining challenges?. Am. J. Hum. Genet. 2021; 108:764–785. - PMC - PubMed
    1. McMurray C.T. Mechanisms of trinucleotide repeat instability during human development. Nat. Rev. Genet. 2010; 11:786–799. - PMC - PubMed
    1. Dion V. Tissue specificity in DNA repair: lessons from trinucleotide repeat instability. Trends Genet. 2014; 30:220–229. - PubMed