. 2024 Jun 3;221(6):e20231236.
doi: 10.1084/jem.20231236. Epub 2024 Apr 10.

TL1A is an epithelial alarmin that cooperates with IL-33 for initiation of allergic airway inflammation

Affiliations

TL1A is an epithelial alarmin that cooperates with IL-33 for initiation of allergic airway inflammation

Pauline Schmitt et al. J Exp Med. .

Abstract

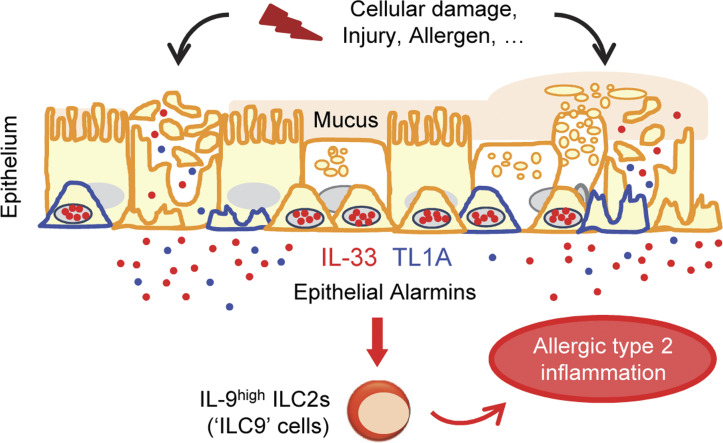
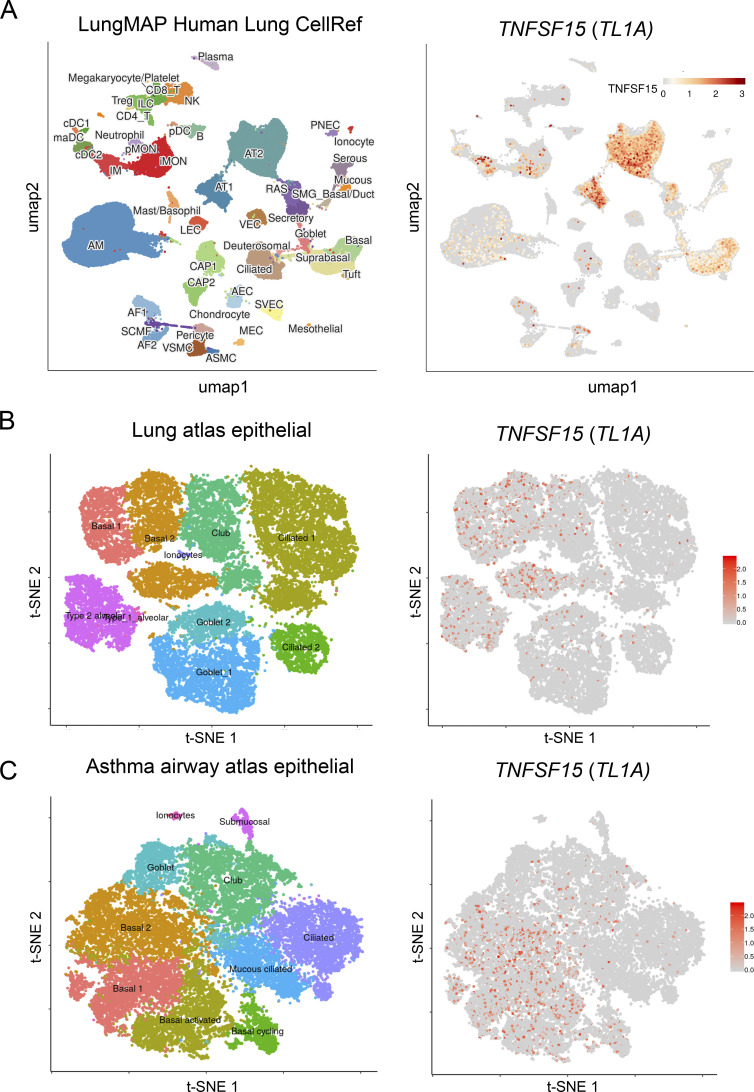
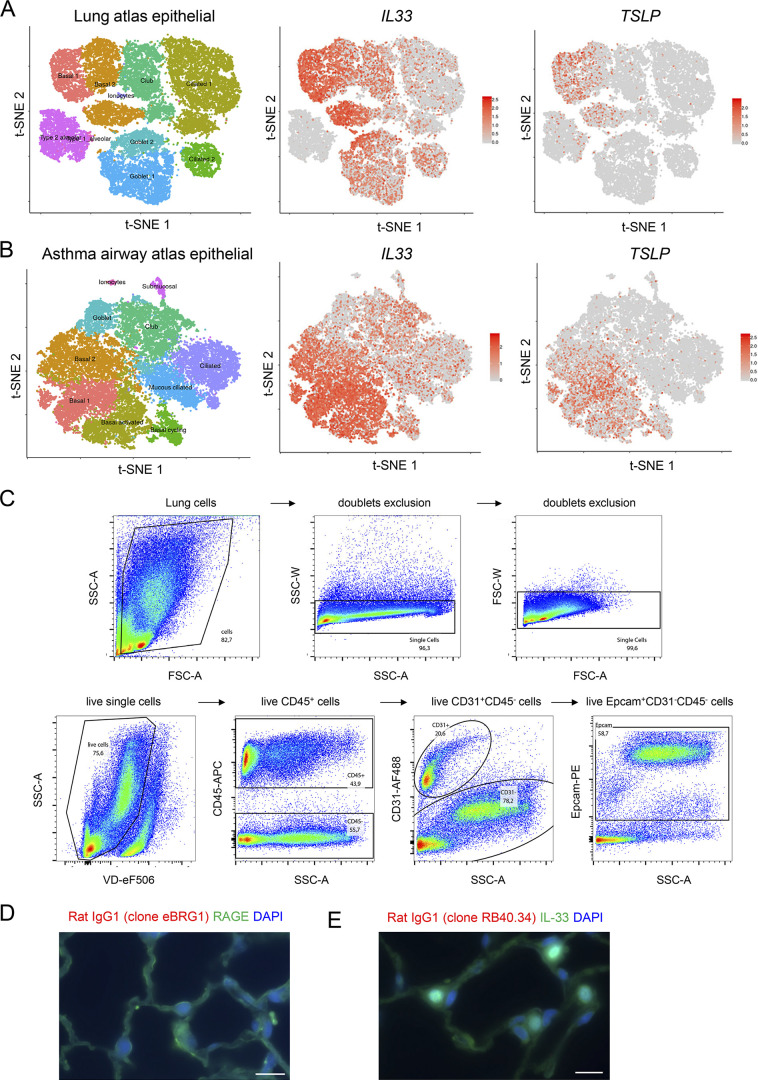
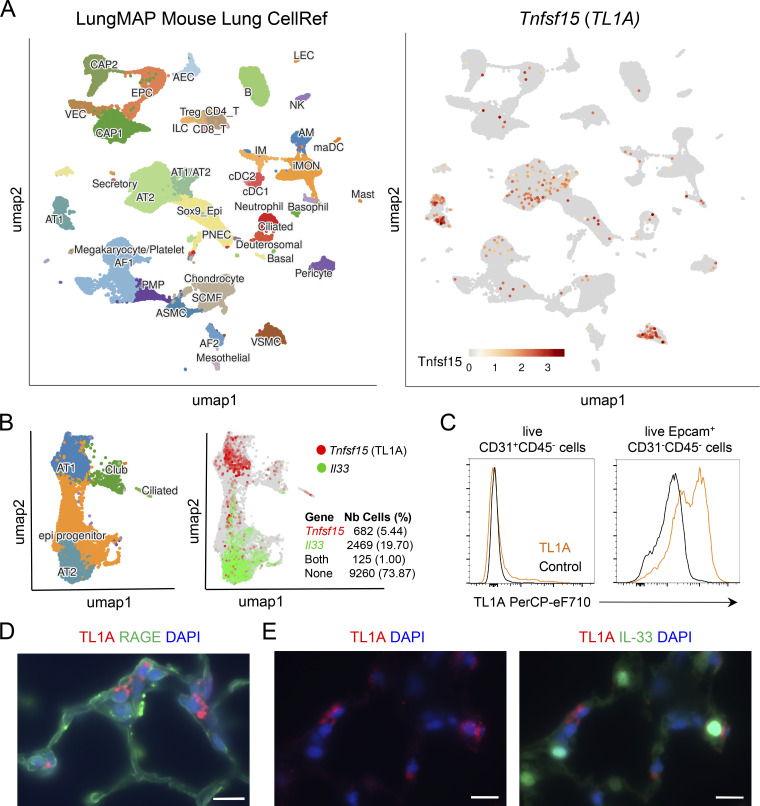
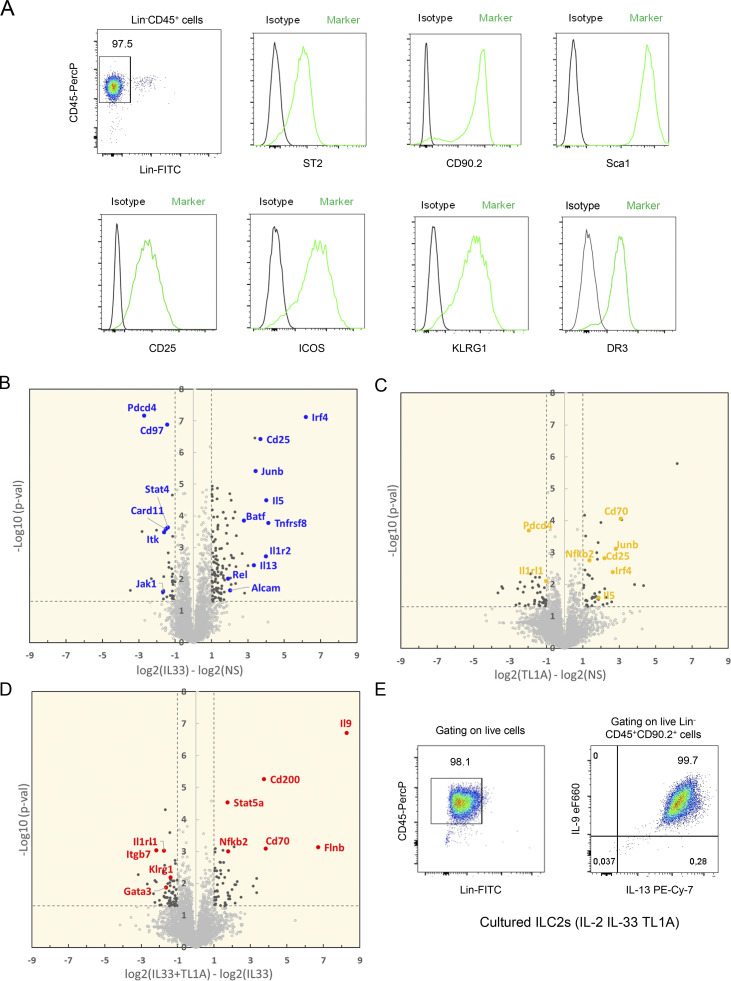
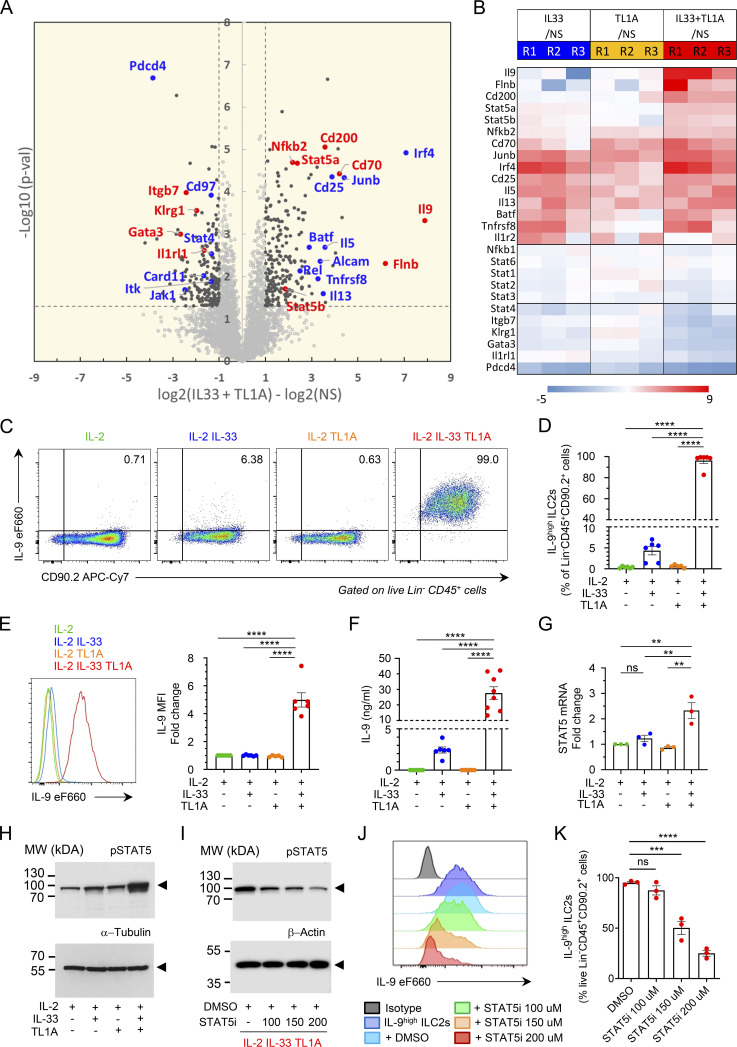
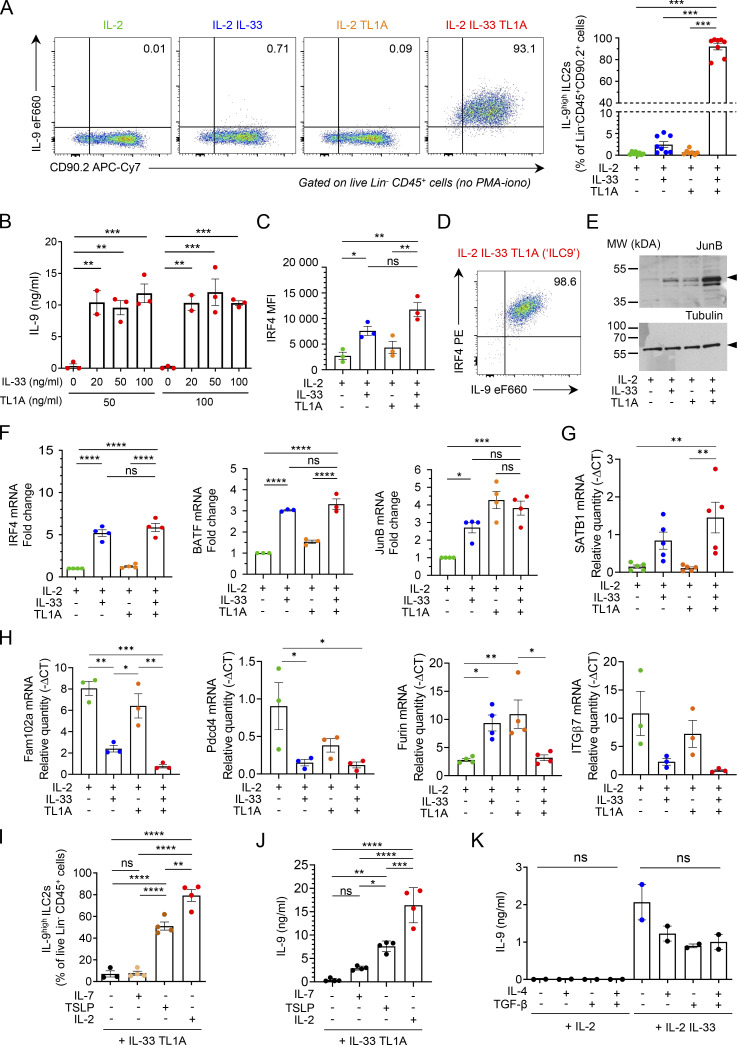
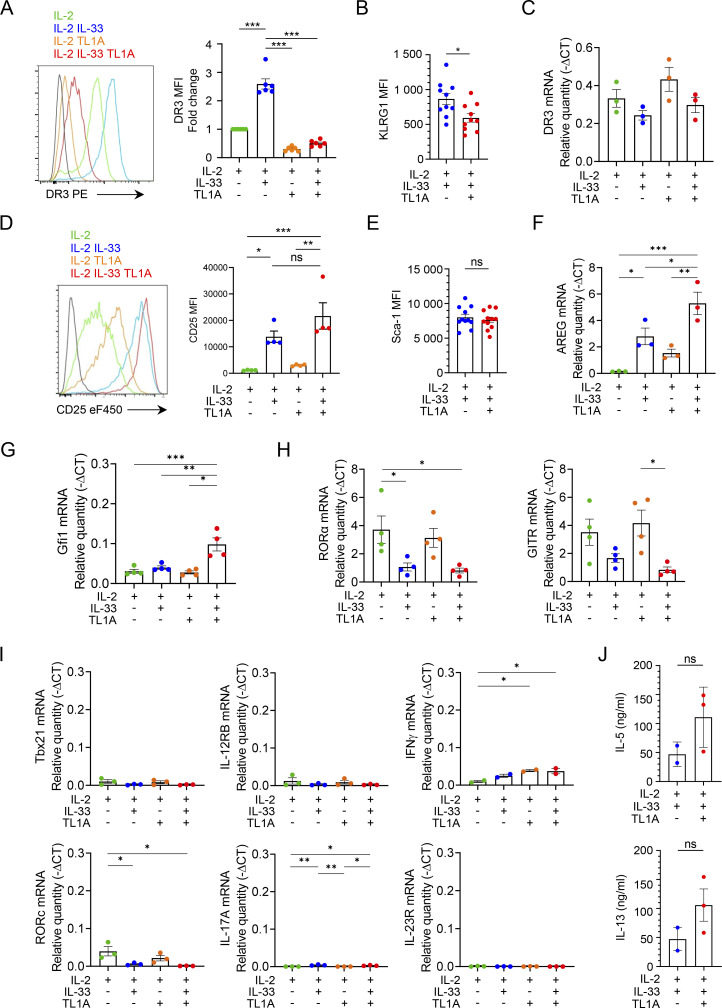
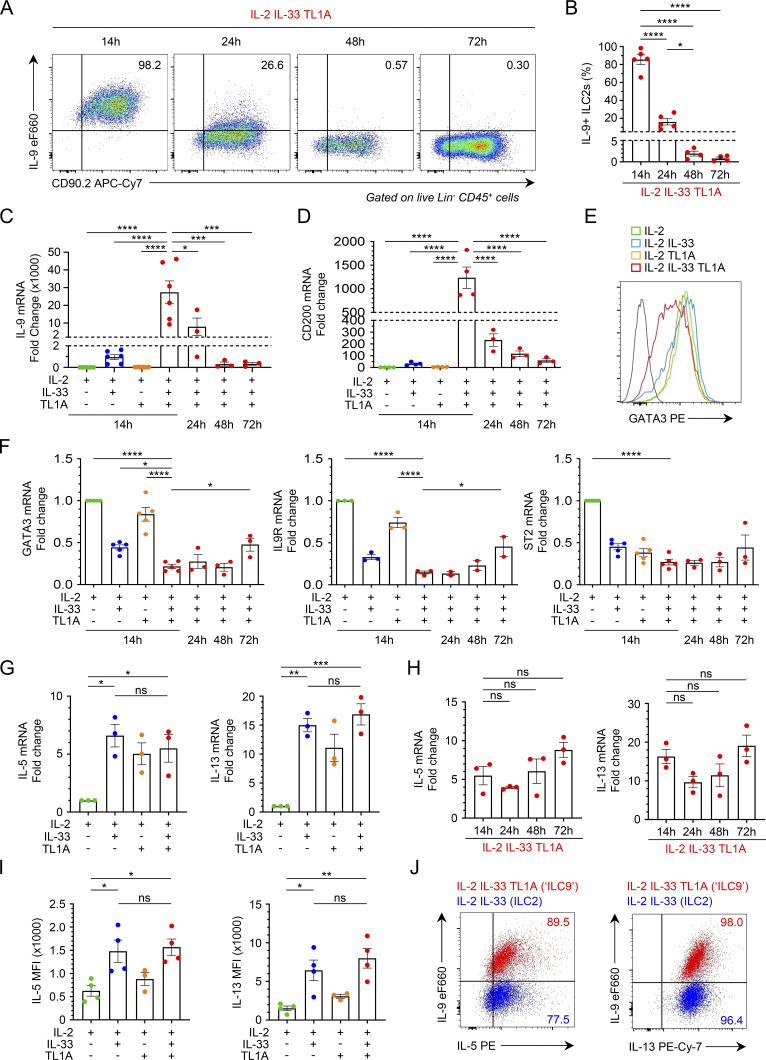
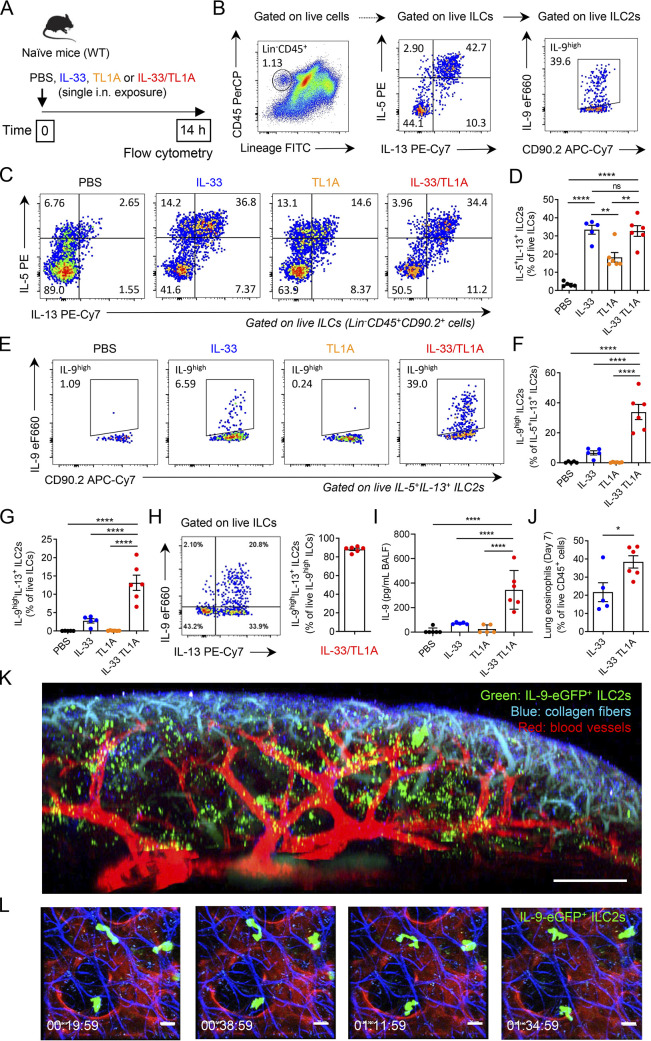
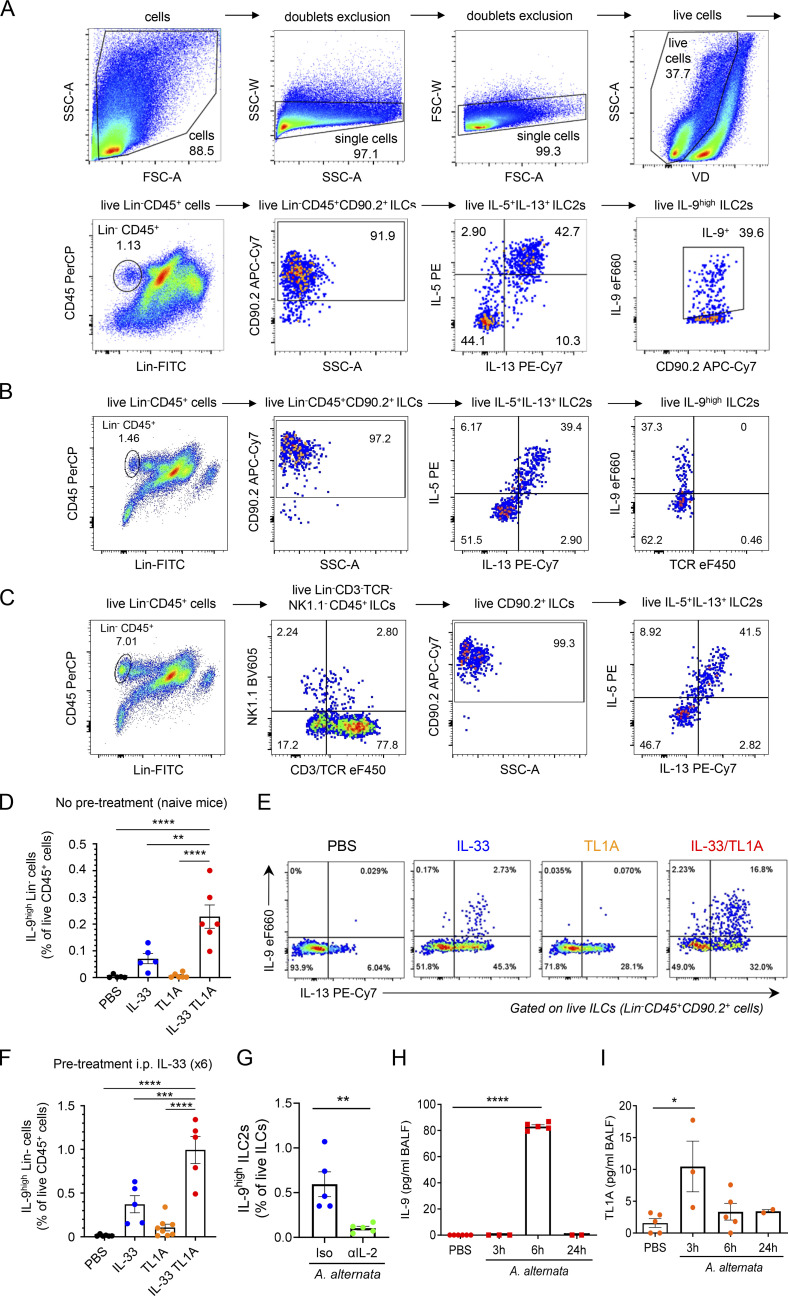
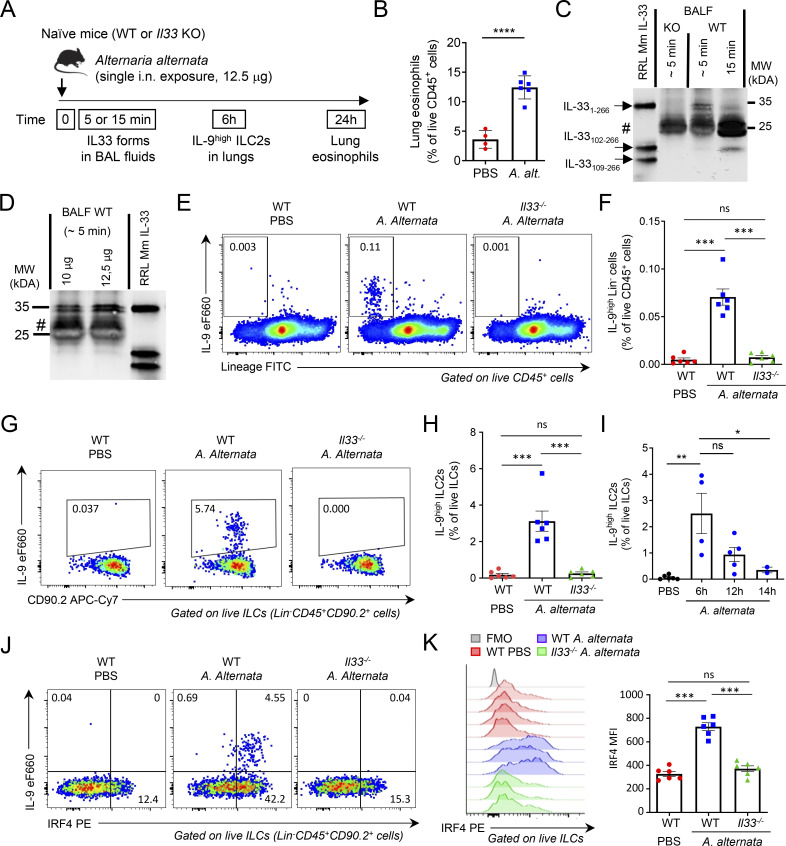
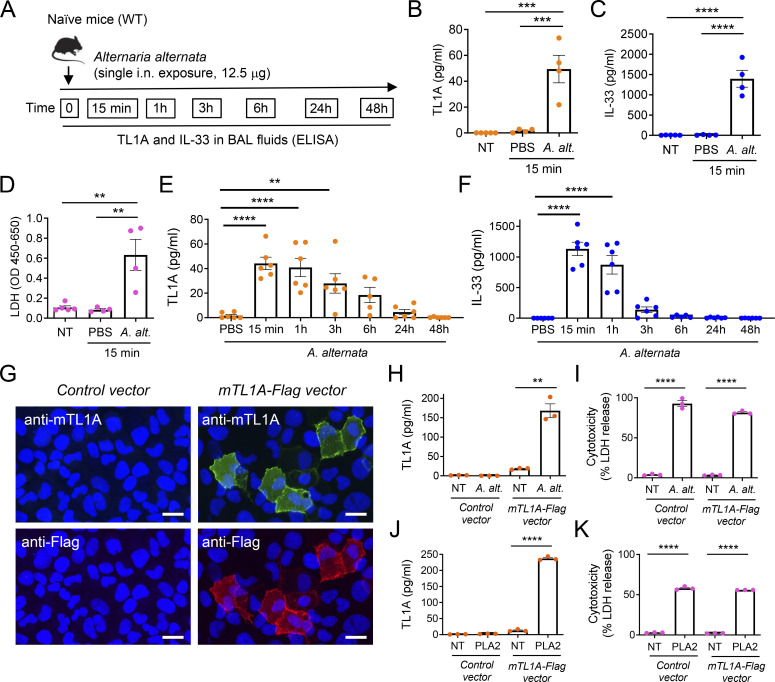
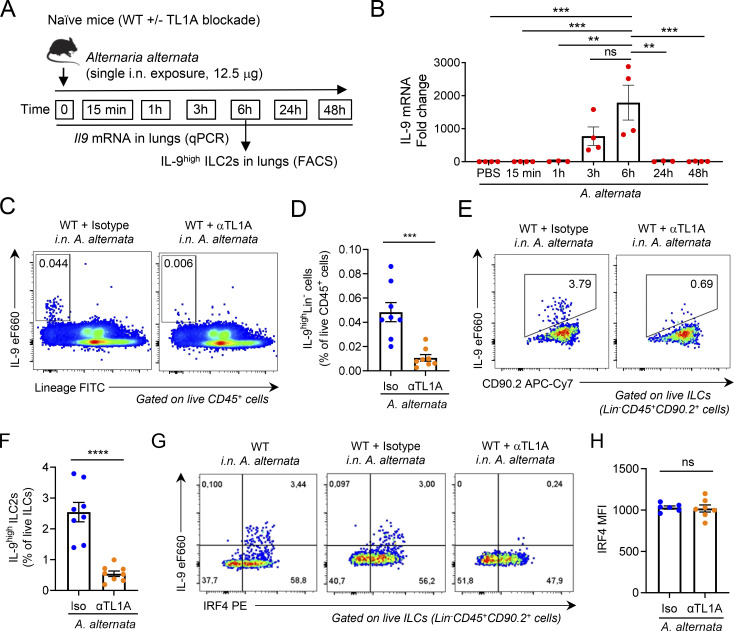
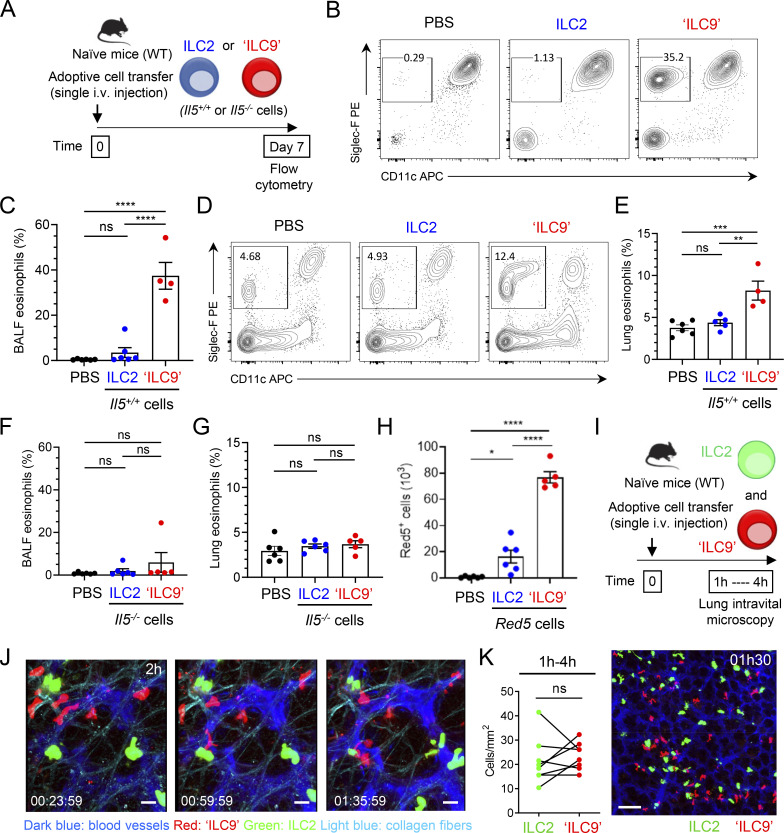
Epithelium-derived cytokines or alarmins, such as interleukin-33 (IL-33) and thymic stromal lymphopoietin (TSLP), are major players in type 2 immunity and asthma. Here, we demonstrate that TNF-like ligand 1A (TL1A) is an epithelial alarmin, constitutively expressed in alveolar epithelium at steady state in both mice and humans, which cooperates with IL-33 for early induction of IL-9high ILC2s during the initiation of allergic airway inflammation. Upon synergistic activation by IL-33 and TL1A, lung ILC2s acquire a transient IL-9highGATA3low "ILC9" phenotype and produce prodigious amounts of IL-9. A combination of large-scale proteomic analyses, lung intravital microscopy, and adoptive transfer of ILC9 cells revealed that high IL-9 expression distinguishes a multicytokine-producing state-of-activated ILC2s with an increased capacity to initiate IL-5-dependent allergic airway inflammation. Similar to IL-33 and TSLP, TL1A is expressed in airway basal cells in healthy and asthmatic human lungs. Together, these results indicate that TL1A is an epithelium-derived cytokine and an important cofactor of IL-33 in the airways.


Conflict of interest statement

Disclosures: The authors declare no competing interests exist.

Figures

None
Graphical abstract
Figure 1.
Figure 1.
TL1A is an epithelial cytokine expressed in alveolar epithelium and airway basal cells in human healthy and asthmatic lungs. (A) Single-cell RNA-seq analysis of TNFSF15 (TL1A) expression in the LungMAP single-cell human lung atlas. Uniform manifold projection (UMAP) plots show the clustering of 347,970 lung cells (10 single-cell datasets, 148 normal human lung samples from 104 donors: adult, child, and adolescent). Results are visualized using ShinyCell (Ouyang et al., 2021) and are based upon data generated by the LungMAP Consortium (Guo et al., 2023) and downloaded from http://www.lungmap.net (Gaddis et al., 2024). (B and C) Single-cell RNA-seq analysis of TNFSF15 (TL1A) expression in epithelial cells from human healthy (B) and asthmatic (C) lungs. t-SNE plots show clustering of 26,154 epithelial cells in upper and lower airways and lung parenchyma in healthy lungs (B; 17 human samples: 6 alveoli and parenchyma, 9 bronchi, 2 nasal), and 25,146 epithelial cells from lower airways in healthy and asthmatic lungs (C; 12 human samples: 15,033 cells from 6 asthma bronchi; 10,113 cells from 6 control bronchi). t-SNE plots were extracted from data obtained by the human lung single-cell atlas (Vieira Braga et al., 2019) and downloaded from https://asthma.cellgeni.sanger.ac.uk.
Figure S1.
Figure S1.
Single-cell RNA-seq analysis of IL33 and TSLP expression in human lungs and gating strategy for analysis of mouse lung epithelial cells by flow cytometry. (A and B) Single-cell RNA-seq analysis of IL33 and TSLP expression in epithelial cells from human healthy (A) and asthmatic (B) lungs. t-SNE plots show clustering of 26,154 epithelial cells in upper and lower airways and lung parenchyma in healthy lungs (A; 17 human samples: 6 alveoli and parenchyma, 9 bronchi, 2 nasal), and 25,146 epithelial cells from lower airways in healthy and asthmatic lungs (B; 12 human samples: 15,033 cells from 6 asthma bronchi; 10,113 cells from 6 control bronchi). t-SNE plots were extracted from data obtained by the human lung single-cell atlas (Vieira Braga et al., 2019), and downloaded from https://asthma.cellgeni.sanger.ac.uk. (C) Gating strategy of Epcam+ epithelial cells and CD31+ endothelial cells in the lung of a naïve WT mouse. (D and E) Immunohistofluorescence staining of lung tissue sections (naïve wild type C57BL/6J mouse, steady state) with two distinct rat IgG1 isotype controls (rat IgG1 clone eBRG1, D, red; rat IgG1 clone RB40.34, E, red) for the anti-TL1A antibody (rat IgG1, MAB7441, clone 293327). Double staining was performed with antibodies against RAGE (D, green) or IL-33 (E, green). Images are representative of two independent experiments. Scale bar, 10 μm.
Figure 2.
Figure 2.
TL1A is expressed in mouse alveolar epithelium at steady state. (A) Visualization of Tnfsf15 (TL1A) expressing cells in the LungMAP single-cell mouse lung atlas. UMAP plots show the clustering of 95,658 lung cells (17 samples from late developmental stage to postnatal day 28). The different cell types in the lungs of naïve mice are indicated on the left. Results are visualized using ShinyCell (Ouyang et al., 2021) and are based upon data generated by the LungMAP Consortium (Guo et al., 2023) and downloaded from http://www.lungmap.net (Gaddis et al., 2024). (B) Single-cell RNA-seq analysis of Tnfsf15/TL1A and Il33 gene expression in mouse lung epithelium. UMAP plots show clustering and cell type annotation of 12,536 mouse lung epithelial cells (seven samples from the emergence of the alveolus to postnatal day 28) (Zepp et al., 2021). The number and percentage of epithelial cells expressing Tnfsf15/TL1A, Il33, or both are indicated on the right. Results are visualized using ShinyCell (Ouyang et al., 2021) and are based upon data obtained by Zepp et al. (2021) and downloaded from http://www.lungmap.net (Gaddis et al., 2024). (C) Flow cytometry analysis of cell surface TL1A expression on live CD31+CD45 endothelial cells and Epcam+CD31CD45 epithelial cells in the lung of a naïve wild type C57BL/6J mouse at steady state. (D and E) Immunohistofluorescence staining of lung tissue sections (naïve wild type C57BL/6J mouse, steady state) with antibodies against TL1A (D and E) and RAGE (D) or IL-33 (E) proteins. A tyramide signal amplification (TSA)-based immunofluorescence method was used to detect TL1A-expressing cells in situ. Images are representative of two independent experiments. Scale bar, 10 μm.
Figure S2.
Figure S2.
High throughput proteomic analyses of lung ILC2s stimulated ex vivo with IL-33 and/or TL1A. (A) Flow cytometry of cultured lung ILC2s ex vivo. Representative histograms of ST2, CD90.2, Sca-1, CD25, ICOS, KLRG1, and DR3 expression at the surface of cultured ILC2s, 3 days after ILC2 cell isolation from the lung and ex vivo culture in the presence of IL-2. Phenotypic analysis was performed on live LinCD45+ cells. (B–D) Large-scale label-free proteomic analyses of mouse lung ILC2s after ex vivo overnight stimulation with rIL-2 ± rIL-33 ± rTL1A. Volcano plots of IL-33-stimulated ILC2s (B) or TL1A-stimulated ILC2s (C) compared with non-stimulated cells (NS; in culture with IL-2 alone). Volcano plot of IL-33/TL1A-stimulated ILC2s compared to IL-33-stimulated cells (D). Statistical analysis of protein abundance values was performed from different biological replicate experiments (n = 6 for NS and IL33 stimulation; n = 3 for TL1A and IL33/TL1A stimulations), using a Student’s t test (log10 P value, vertical axis). Proteins found as significantly over or under-expressed (P < 0.05 and abs[log2 fold change] >1) are shown in black. Representative examples of proteins found modulated in each comparison are shown in color. (E) Flow cytometry of cultured lung ILC2s after 14 h of co-stimulation with IL-33 and TL1A in the presence of IL-2 (ILC2 culture used in Fig. 3 C). Intracellular cytokine staining revealed that >99% of ILC2s co-expressed IL-9 and IL-13 intracellularly. Phenotypic analysis was performed on live LinCD45+CD90.2+ cells.
Figure 3.
Figure 3.
TL1A synergizes with IL-33 to induce an IL-9-producing ILC9 phenotype in lung ILC2s. (A and B) Large-scale label-free proteomic analyses of ILC2s isolated from pooled lungs of IL-33-treated Rag2−/− C57BL/6 J mice (Schmitt et al., 2018) and cultured with IL-2 (Fig. S2 A) prior to overnight stimulation with rIL-2 ± rIL-33 ± rTL1A. Volcano plot of IL-33/TL1A-stimulated ILC2s (ILC9 cells) compared with nonstimulated cells (NS; in culture with IL-2 alone) (A). Statistical analysis of protein abundance values was performed from different biological replicate experiments (n = 6 for NS; n = 3 for IL33/TL1A stimulation) using a Student’s t test (log10 P value, vertical axis). Proteins found as significantly over or under-expressed (P < 0.05 and abs[log2 fold change] >1) are shown in black. Examples of proteins modulated in both IL-33/TL1A-stimulated ILC2s and IL-33-stimulated ILC2s are shown in blue. Proteins shown in red are representative of molecules specifically modulated in IL-33/TL1A-stimulated ILC2s (A). Heat-map of fold changes of selected proteins in three independent biological replicates (B). (C–K) Analysis of ILC2s isolated from pooled lungs of IL-33-treated Rag2−/− C57BL/6 J mice (Schmitt et al., 2018), and cultured with IL-2 prior to 14 h stimulation with rIL-2 ± rIL-33 ± rTL1A. Flow cytometry analysis of live Lin CD45+ cells (C, E, and J), frequency of IL-9high ILC2s (percentage of live Lin CD45+ CD90.2+ cells) (D and K), and MFI fold change of IL-9 in ILC2s (E), after cytokines treatment and restimulation by PMA, ionomycin, and brefeldin A (4 h, C–E) or brefeldin A (4 h, J and K). Concentration of IL-9 secreted by ILC2s, measured by ELISA (F). Relative STAT5 mRNA expression levels measured by real-time qPCR (G). Samples were normalized to the expression of HPRT and are shown relative to IL-2-stimulated ILC2s. Immunoblot analysis of activated phosphorylated STAT5 (pSTAT5) and α-tubulin (H) or β-actin (I); Arrowheads indicate the migration of the protein of interest; cropped images. Cultured ILC2s were treated with rIL-2 + rIL-33 + rTL1A and increasing doses of a STAT5 inhibitor (STA5i, CAS 285986-31-4) or control vehicle (DMSO) (I–K). Numbers inside outlined areas (C) indicate percent of cells in the relevant gate. Each symbol represents an individual biological replicate (D–G and K). Data are pooled from six (D and E), six to eight (F) or three (G and K) independent experiments, or are representative of six (C and E) or three (H–J) independent experiments. Data are expressed as mean (±SEM) with P values determined by one-way ANOVA followed by Tukey’s multiple-comparisons test (D–G and K): ns not significant, ** P < 0.01, *** P < 0.001, **** P < 0.0001. Source data are available for this figure: SourceData F3.
Figure S3.
Figure S3.
IL-33 and TL1A synergistically induce IL-9-producing ILC2s ex vivo. (A) Analysis of cultured lung ILC2s 14 h after ex vivo stimulation by rIL-2 (20 ng/ml) ± rIL-33 (20 ng/ml) ± rTL1A (50 ng/ml). Flow cytometry analysis of live Lin CD45+ cells and frequency of IL-9high ILC2s (percentage of live Lin CD45+ CD90.2+ cells) after cytokine treatment and incubation with brefeldin A (4 h), without restimulation by PMA and ionomycin. Numbers inside outlined area indicate percent of cells in the relevant gate and data are representative of eight independent experiments. (B) Concentration of IL-9 secreted by ILC2s treated with rIL-2 (20 ng/ml) and various concentrations of rIL-33 and rTL1A measured by ELISA. (C and D) MFI of nuclear factor IRF4 (C) and flow cytometry (D) of ILC2s 14 h after ex vivo stimulation of cultured ILC2s by rIL-2 (20 ng/ml) ± rIL-33 (20 ng/ml) ± rTL1A (50 ng/ml). Numbers inside outlined areas (D) indicate percent of cells in the relevant gate and data are representative of three independent experiments. (E) Immunoblot analysis of JunB and α-tubulin14 h after cytokine stimulation of lung ILC2s; Arrowheads indicate the migration of the protein of interest; cropped image. Data are representative of three independent experiments. (F–H) Relative mRNA expression levels by real time qPCR, 14 h after cytokine stimulation of lung ILC2s. Samples were normalized to the expression of HPRT and data are expressed relative to IL-2-stimulated ILC2s (F) or relative to HPRT mRNA quantity (G and H). (I and J) Analysis of mouse lung ILC2s 14 h after ex vivo stimulation by rIL-33 + rTL1A ± rIL-2 ± rIL-7 ± rTSLP. Frequency of IL-9high ILC2s (Lin CD45+ CD90.2+ cells), after cytokines treatment and re-stimulation by PMA, ionomycin and brefeldin A (4 h, I). Concentration of IL-9 secreted by ILC2s, measured by ELISA (J). (K) Concentration of IL-9 (ELISA) secreted by ILC2s 14 h after ex vivo stimulation by rIL-2 ± rIL-33 ± rIL-4 ± rTGF-β. Each symbol represents an individual biological replicates with n = 2–5 independent experiments (A–C and F–K). Data are expressed as mean (±SEM) with P values determined by one-way ANOVA followed by Tukey’s (A, C, and F–J) or Dunnett’s (B and K) multiple-comparisons tests: ns, not significant, * P < 0.05, ** P < 0.01, *** P < 0.001, **** P < 0.0001. In H, all significant P values are annotated with stars, all other comparisons are not significant. Source data are available for this figure: SourceData FS3.
Figure S4.
Figure S4.
IL-33 and TL1A induce phenotypic changes in cultured lung ILC2s at the protein and mRNA levels. (A–J) Analysis of mouse lung ILC2s 14 h after ex vivo stimulation by rIL-2 ± rIL-33 ± rTL1A. MFI of the indicated cell surface markers determined by flow cytometry (A, B, D, and E). Relative mRNA expression levels of various genes (C and F–I), including genes characteristic of ILC1s or ILC3s (I), determined by real-time qPCR, 14 h after cytokine stimulation of lung ILC2s. Samples were normalized to the expression of HPRT and data are expressed as relative to HPRT mRNA quantity. Concentration of IL-5 or IL-13 in cell supernatants, measured by ELISA assay (J). Each symbol represents an individual biological replicate from independent experiments (A–J). Data are expressed as mean (±SEM) with P values determined by unpaired two-tailed Student’s t test (B, E, and J) or one-way ANOVA followed by Tukey’s multiple-comparisons test (A, C, D, and F–I): ns, not significant, * P < 0.05, ** P < 0.01, *** P < 0.001. In I, all significant P values are annotated with stars, all other comparisons are not significant.
Figure 4.
Figure 4.
The ILC9 phenotype corresponds to a transient IL-9highGATA3low multicytokine producing state of activated ILC2s. (A–J) Analysis of ILC2s isolated from pooled lungs of IL-33-treated Rag2−/− C57BL/6 J mice (Schmitt et al., 2018) and cultured with IL-2 prior to stimulation with rIL-2 ± rIL-33 ± rTL1A. The cells are stimulated for 14 h (E, G, I, and J), except for the kinetic experiments for which the stimulation time is indicated on the graph (A–D, F, and H). Flow cytometry analysis of IL-9, GATA3, IL-5, or IL-13 expression in cultured lung ILC2s (live Lin CD45+ CD90.2+ cells) after cytokine treatment and incubation with brefeldin A (4 h), with (A) or without restimulation by PMA and ionomycin (E, I, and J). Numbers inside outlined areas indicate the percent of cells in the relevant gate and data are representative of two to three independent experiments. Frequency of IL-9high ILC2s (Lin CD45+CD90.2+ cells) (B), MFI of IL-5 and IL-13 in ILC2s (I), and relative mRNA expression levels of IL-9 (C), CD200 (D), GATA3, IL9R, ST2 (IL1RL1) (F), IL-5 and IL-13 (G and H) by real-time qPCR, 14 h (G and I) or at different time points (B–D, F, and H) after stimulation of lung ILC2s. Samples were normalized to the expression of HPRT and are shown relative to IL-2-stimulated ILC2s (C, D, and F–H). Each symbol (B–D and F–I) represents an individual biological replicate from two to six independent experiments. Data are expressed as mean (±SEM) with P values determined by one-way ANOVA followed by Tukey’s multiple-comparisons test (B–D and F–I): ns, not significant, * P < 0.05, ** P < 0.01, *** P < 0.001, **** P < 0.0001.
Figure 5.
Figure 5.
TL1A cooperates with IL-33 for induction of IL-9high ILC2s in vivo. (A) Treatment schedule of naïve wild type (WT, C57BL/6J) mice. (B) Gating strategy of IL-9high IL-5+IL-13+ ILC2s. (C–I) Flow cytometry of IL-5+IL-13+ ILC2s gated on live ILCs (LinCD45+CD90.2+ cells) (C) and IL-9high ILC2s gated on live IL-5+IL-13+ ILC2s (E), frequency of lung IL-5+IL-13+ ILC2s among live ILCs (D), IL-9high ILC2s among live IL-5+IL-13+ ILC2s (F), and IL-9highIL-13+ ILC2s among live ILCs (G) or IL-9high ILCs (H), and concentration of IL-9 in BAL fluids (ELISA assay, I) of WT mice 14 h after a single i.n. administration of PBS or rIL-33 (1 μg) and/or rTL1A (5 μg). Numbers inside outlined areas indicate the percent of cells in the relevant gate and data are representative of two independent experiments (C and E). Each symbol represents an individual mouse and data are pooled from two independent experiments. Data are expressed as mean (±SEM) with P values determined by one-way ANOVA followed by Tukey’s (D) or Dunnett’s (F, G, and I) multiple-comparisons tests: ns, not significant, ** P < 0.01, **** P < 0.0001. (J) Frequency of lung eosinophils (Gr1lowSiglec-F+CD11c cells) among live CD45+ cells, at day 7 after a single i.n. exposure to rIL-33 or rIL-33 plus rTL1A. Each symbol represents an individual mouse and data are pooled from two independent experiments. Data are expressed as mean (±SEM) with P values determined by unpaired two-tailed Student’s t test: * P < 0.05. (K and L) Multiphoton imaging (K) and intravital microscopy (L) of whole lungs of INFER IL-9 fluorescent reporter mice, with detection of IL-9-eGFP+ ILC2s (green) and staining of blood vessels (red) and collagen fibers (blue), 16–18 h after a single i.n. administration of IL-33/TL1A combination (1 μg rIL-33 plus 5 μg rTL1A). To increase the numbers of lung IL-9high ILC2s accessible to in vivo imaging, the single i.n. exposure to IL-33/TL1A combination was performed after prior expansion of lung ILC2s by repeated i.p. injections of IL-33 (K and L). Multiphoton image (K) is a 3D reconstitution of stitched images (7 × 7 tiles and 181 z-stack). Time-lapse images (L) illustrate the migratory behavior of IL-9-eGFP+ ILC2s. Time in h/min/s. Scale bars: K, 300 μm; L, 20 μm.
Figure S5.
Figure S5.
IL-33 and TL1A synergistically induce IL-9-producing ILC2s in vivo. (A) Gating strategy and representative flow cytometry plots of live lung ILCs (live LinCD45+CD90.2+ cells), live lung IL-5+IL-13+ ILC2s (live IL-5+IL-13+ ILCs) and live lung IL-9high ILC2s (live IL-9high IL-5+IL-13+ ILC2s) in vivo in wild type (WT) C57BL/6J mouse, 14 h after a single i.n. administration of rIL-33 (1 μg) and rTL1A (5 μg). (B) Verification of the absence of contamination of the IL-5+IL-13+ ILC2s and IL-9high ILC2s populations by TCR+ cells (T cells and NKT cells) using anti-TCRβ and anti-TCRγδ antibodies. (C) Confirmation of the expression of IL-5 and IL-13 in live LinCD3/TCRNK1.1CD45+CD90.2+ lung ILCs using antibodies against CD3/TCR and NK1.1 with a different fluorescence from the Lin cocktail (CD4, CD19, CD45R, CD11b, CD11c, Ter119, Ly6G, FcεRI). (D and E) Frequency of lung IL-9highLin cells among live CD45+ cells (D), and flow cytometry of IL-9highIL-13+ ILC2s (live IL-9highIL-13+LinCD45+CD90.2+ cells) (E) of WT mice 14 h after a single i.n. administration of PBS or rIL-33 (1 μg) and/or rTL1A (5 μg). Numbers inside outlined areas indicate the percent of cells in the relevant gate. (F) Frequency of lung IL-9highLin cells among live CD45+ cells of WT mice pretreated with six daily i.p. injections of rIL-33 (days 1–6) prior to one i.n. injection of PBS or rIL-33 and/or rTL1A (day 7). Flow cytometry analyses were performed on day 8. (G) Frequency of IL-9high ILC2s among live ILCs (LinCD45+CD90.2+ cells) in the lungs of WT mice 6 h after a single i.n. administration of A. alternata extract (12.5 μg), with (αIL-2 mAb) or without (Iso, isotype control mAb) IL-2 blockade. (H and I) Analysis of IL-9 and TL1A release in BAL fluids by ELISA at different time points after the third exposure to A. alternata in a chronic exposure model (repeated i.n. administration of 12.5 μg A. alternata at days 0, 3, and 6). Each symbol represents an individual mouse and data are pooled from two (D and G) or three (F, H, and I) independent experiments. Data are expressed as mean (±SEM) with P values determined by unpaired two-tailed Student’s t tests (G) or one-way ANOVA followed by Dunnett’s multiple-comparison test (D, F, H, and I): * P < 0.05, ** P < 0.01, *** P < 0.001, **** P < 0.0001.
Figure 6.
Figure 6.
Endogenous IL-33 is essential for the induction of IL-9high ILC2s during the initiation of allergic airway inflammation. (A) Treatment schedule of naïve wild type (WT, C57BL/6J) and Il33−/− (KO, C57BL/6J) mice. (B) Frequency of eosinophils (among live CD45+ cells) in the lungs of WT mice 24 h after treatment with a single dose (12.5 μg) of A. alternata. (C and D) IL-33 forms in BAL fluids from KO mice and WT littermates were analyzed by pull-down assays with ST2-Fc followed by immunoblot with anti-mouse IL-33 antibodies. Recombinant full-length IL-33 (IL-331–266), IL-33102–266, and IL-33109–266 murine proteins were used as controls in the assays. Naïve mice were exposed to a single i.n. dose of A. alternata extracts using different times of exposure (C, 12.5 μg of A. alternata) or different amounts of the allergen (D). #, non-specific bands. Blots are representative of two independent experiments. (E–H) Flow cytometry and frequency of IL-9highLin cells among live CD45+ cells (E and F) and IL-9high ILC2s among live ILCs (LinCD45+CD90.2+ cells) (G and H) in the lungs of WT (Charles River) or Il33 KO mice 6 h after a single i.n. exposure to A. alternata. (I) Frequency of IL-9high ILC2s among live ILCs (LinCD45+CD90.2+ cells) in the lungs of WT mice at different time points after a single allergen exposure. (J and K) Flow cytometry analysis of IL-9 and IRF4 expression in ILC2s (J) and MFI of IRF4 in ILC2s (K) in the lungs of WT (Charles River) or Il33 KO mice 6 h after a single allergen exposure. Numbers inside outlined areas indicate the percent of cells in the relevant gate (E, G, and J), and data are representative of two independent experiments (mice per group: n = 6). Each symbol represents an individual mouse (B, F, H, I, and K) and data are pooled from two (B, F, H, and K) or three (I) independent experiments. Data are expressed as mean (±SEM) with P values determined by unpaired two-tailed Student’s t test (B) or one-way ANOVA followed by Tukey’s multiple-comparisons test (F, H, I, and K): ns, not significant, * P < 0.05, ** P < 0.01, *** P < 0.001, **** P < 0.0001. Source data are available for this figure: SourceData F6.
Figure 7.
Figure 7.
Endogenous TL1A functions as an epithelial alarmin rapidly released after allergen exposure. (A) Treatment schedule of naïve wild type (WT, C57BL/6J) mice. (B–F) Analysis of TL1A and IL-33 release in BAL fluids after a single allergen exposure. TL1A (B and E), IL-33 (C and F), and LDH (D) levels in BAL fluids were determined by ELISA (B, C, E, and F) or LDH (D) assays, 15 min (B–D) or at different time points (E and F) after a single i.n. administration of A. alternata extract (12.5 μg). Each symbol represents an individual mouse and data are pooled from two independent experiments (B–F). Data are expressed as mean (±SEM) with P values determined by one-way ANOVA followed by Tukey’s (B–D) or Dunnett’s (E and F) multiple-comparisons tests: ** P < 0.01, *** P < 0.001, **** P < 0.0001. (G–K) Analysis of TL1A release in cell supernatants after exposure of TL1A-expressing cells to A. alternata or bee venom phospholipase A2 (PLA2). U2OS epithelial cells transfected with a mouse TL1A-Flag expression vector (mTL1A-Flag vector) or control vector were analyzed by indirect immunofluorescence microscopy with anti-mTL1A and anti-Flag antibodies (G). Scale bar, 20 μm. TL1A (H and J) and LDH (I and K) levels in cell supernatants were determined by ELISA (H and J) or LDH cytotoxicity assays (I and K) 15 min after treatment with A. alternata extract (A. alternata, H and I) or 1 h after treatment with bee venom PLA2 (J and K). NT, not treated. Each symbol represents an individual biological replicate and data are pooled from three independent experiments (H–K). Data are expressed as mean (±SEM) with P values determined by unpaired two-tailed Student’s t tests (treatment versus NT): ** P < 0.01, **** P < 0.0001.
Figure 8.
Figure 8.
Endogenous TL1A is important for early induction of IL-9high ILC2s after allergen exposure. (A) Treatment schedule of naïve WT mice. (B) IL-9 mRNA levels in the lungs analyzed by qPCR at different time points after a single allergen exposure. Data are expressed as relative to IL-9 mRNA levels in mice treated with PBS. (C–H) Flow cytometry and frequency of IL-9highLin cells among live CD45+ cells (C and D) and IL-9high ILC2s among live ILCs (LinCD45+CD90.2+ cells) (E and F), flow cytometry (G), and MFI of IRF4 expression in ILC2s (H), in the lungs of WT mice 6 h after a single i.n. administration of A. alternata extract (12.5 μg), with (αTL1A mAb) or without (Iso, isotype control mAb) TL1A blockade. Numbers inside outlined areas indicate the percent of cells in the relevant gate (C, E, and G) and data are representative of two (G) or three (C and E) independent experiments. Each symbol represents an individual mouse and data are pooled from three (D and F) or two (B and H) independent experiments. Data are expressed as mean (±SEM) with P values determined by one-way ANOVA followed by Tukey’s multiple-comparisons test (B) or unpaired two-tailed Student’s t tests (D, F, and H): ns, not significant, *** P < 0.001, **** P < 0.0001.
Figure 9.
Figure 9.
ILC9 cells have an increased capacity to initiate IL-5-dependent allergic airway inflammation. (A) Treatment schedule of naïve wild type (WT, C57BL/6J) mice by a single i.v. adoptive cell transfer of classical IL-33-activated ILC2s (ILC2) or IL-33/TL1A-activated ILC2s (ILC9). (B–H) Flow cytometry (B and D) and frequency of eosinophils (Gr1lowSiglec-F+CD11c cells) among live CD45+ cells from BALF (C and F) or lung (E and G), and number of Red5+ ILC2s or ILC9s in total lung of mice (H), at day 7 after a single i.v. adoptive transfer of 5 × 10⁵ ILC2s or ILC9s in separate host mice. Adoptively transferred ILC2s and ILC9s were prepared from Rag2−/− mice (Il5+/+ cells) (B–E) or Red5 mice (Il5−/− cells) (F–H). Control mice received an intravenous injection of PBS. Red5+ cells indicate the activity of the Il5 promoter. Each symbol represents an individual mouse and data are representative (B and D) or pooled (C and E–H) from two independent experiments. (I–K) Live imaging of ILC2s and ILC9 cells in the lung. Lung intravital microscopy was performed 1–4 h after adoptive transfer of 6 × 10⁵ of each cell type in the same host (green, classical IL-33-activated ILC2s-CFSE+; red, IL-33/TL1A-activated ILC9 cells-CTO+) (I). Imaging of the migratory behavior of ILC2s and ILC9 cells in the lung (J) and cell quantification from lung intravital microscopy data (K). Time-lapse images, 2 h after adoptive cell transfer (J). A maximum intensity projection of stitched images (2 × 2 tiles and 18 z-stack) is shown (K). Time in h/min/s. Scale bars: J, 20 μm; K, 100 μm. Lung intravital microscopy data are representative (J and K) or analyzed (K) from three adoptive transfer experiments on four mice. Data are expressed as mean (±SEM) with P values determined by paired two-tailed Student’s t test (K) or one-way ANOVA followed by Tukey’s multiple-comparisons test (C and E–H): ns, not significant, * P < 0.05, ** P < 0.01, *** P < 0.001, **** P < 0.0001.

References

    1. Bartemes, K.R., Iijima K., Kobayashi T., Kephart G.M., McKenzie A.N., and Kita H.. 2012. IL-33-responsive lineage- CD25+ CD44(hi) lymphoid cells mediate innate type 2 immunity and allergic inflammation in the lungs. J. Immunol. 188:1503–1513. 10.4049/jimmunol.1102832 - DOI - PMC - PubMed
    1. Brusselle, G.G., and Koppelman G.H.. 2022. Biologic therapies for severe asthma. N. Engl. J. Med. 386:157–171. 10.1056/NEJMra2032506 - DOI - PubMed
    1. Bush, R.K., and Prochnau J.J.. 2004. Alternaria-induced asthma. J. Allergy Clin. Immunol. 113:227–234. 10.1016/j.jaci.2003.11.023 - DOI - PubMed
    1. Cayrol, C. 2021. IL-33, an alarmin of the IL-1 family involved in allergic and non allergic inflammation: Focus on the mechanisms of regulation of its activity. Cells. 11:107. 10.3390/cells11010107 - DOI - PMC - PubMed
    1. Cayrol, C., Duval A., Schmitt P., Roga S., Camus M., Stella A., Burlet-Schiltz O., Gonzalez-de-Peredo A., and Girard J.P.. 2018. Environmental allergens induce allergic inflammation through proteolytic maturation of IL-33. Nat. Immunol. 19:375–385. 10.1038/s41590-018-0067-5 - DOI - PubMed