. 2024 Jun 3;221(6):e20232192.
doi: 10.1084/jem.20232192. Epub 2024 Apr 10.

Interstitial macrophages are a focus of viral takeover and inflammation in COVID-19 initiation in human lung

Affiliations

Interstitial macrophages are a focus of viral takeover and inflammation in COVID-19 initiation in human lung

Timothy Ting-Hsuan Wu et al. J Exp Med. .

Abstract

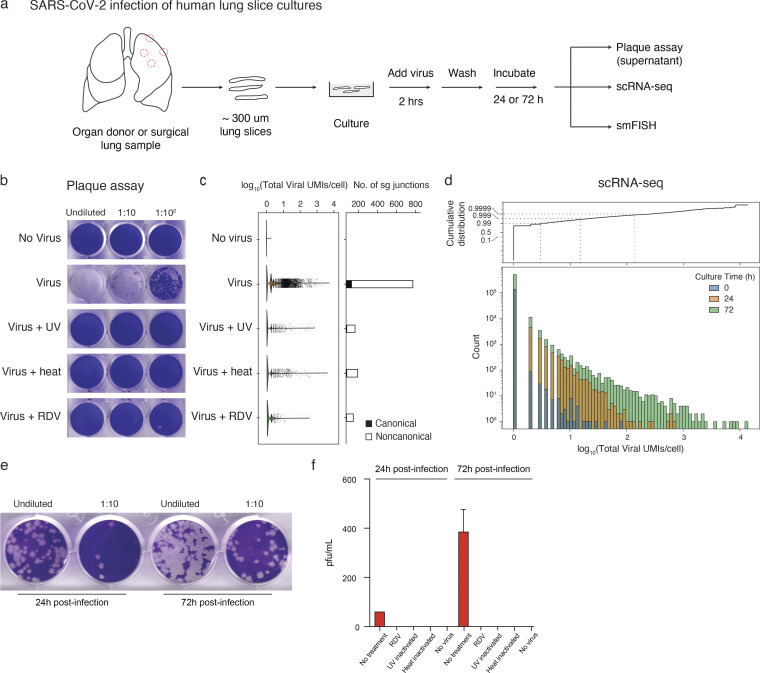
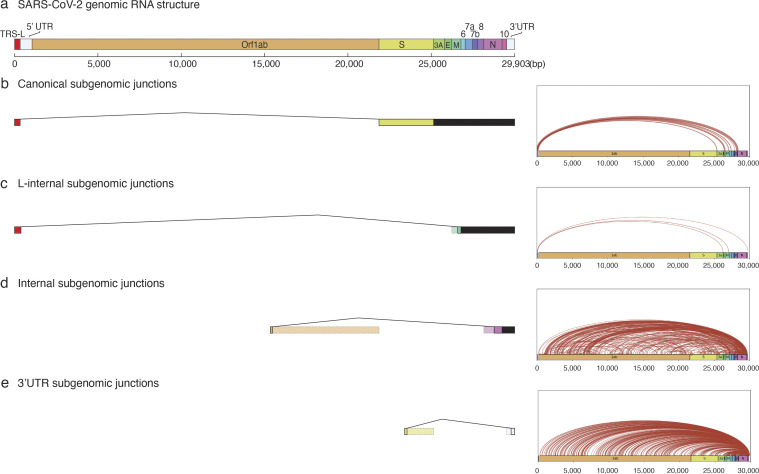
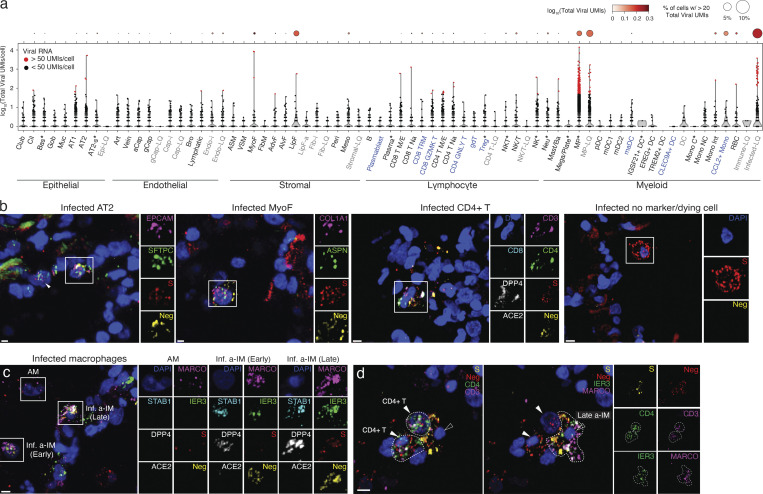
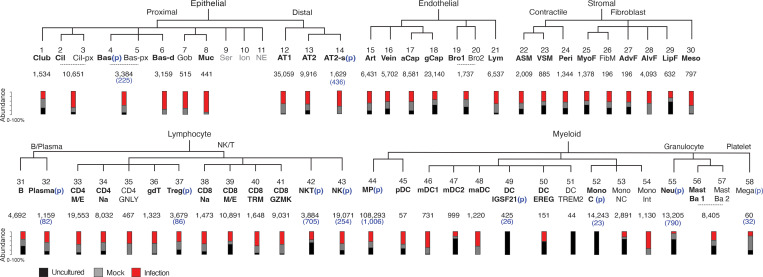
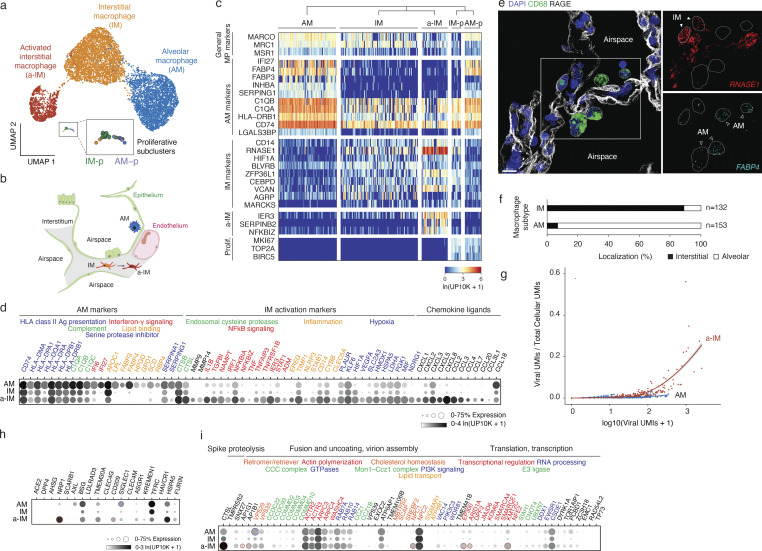
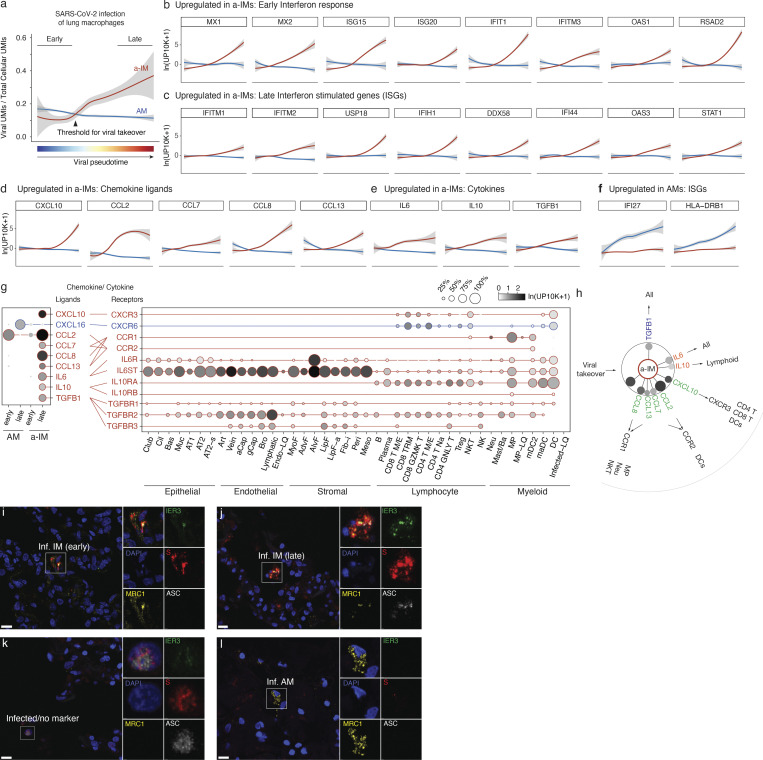
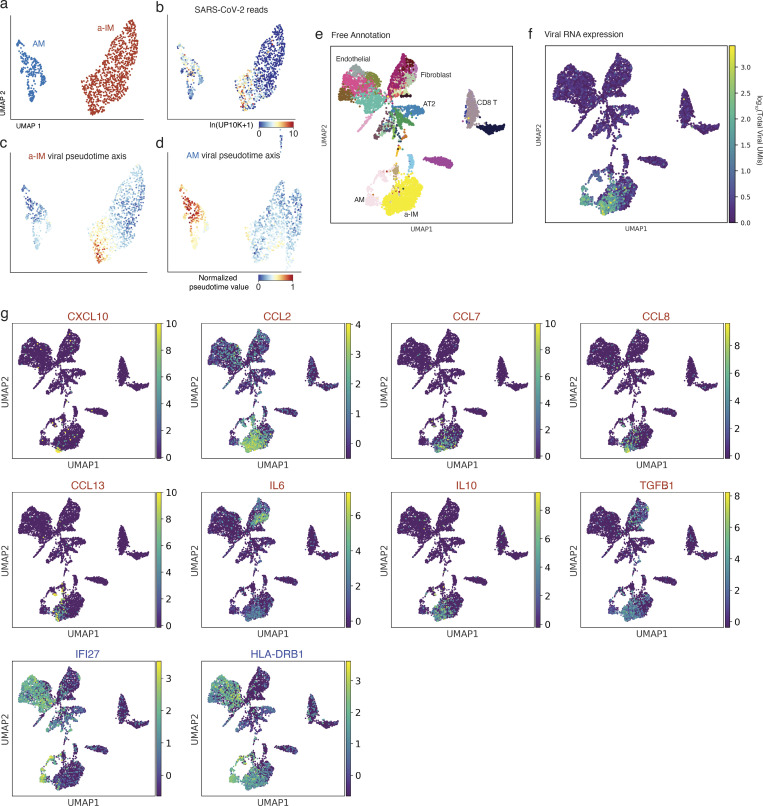
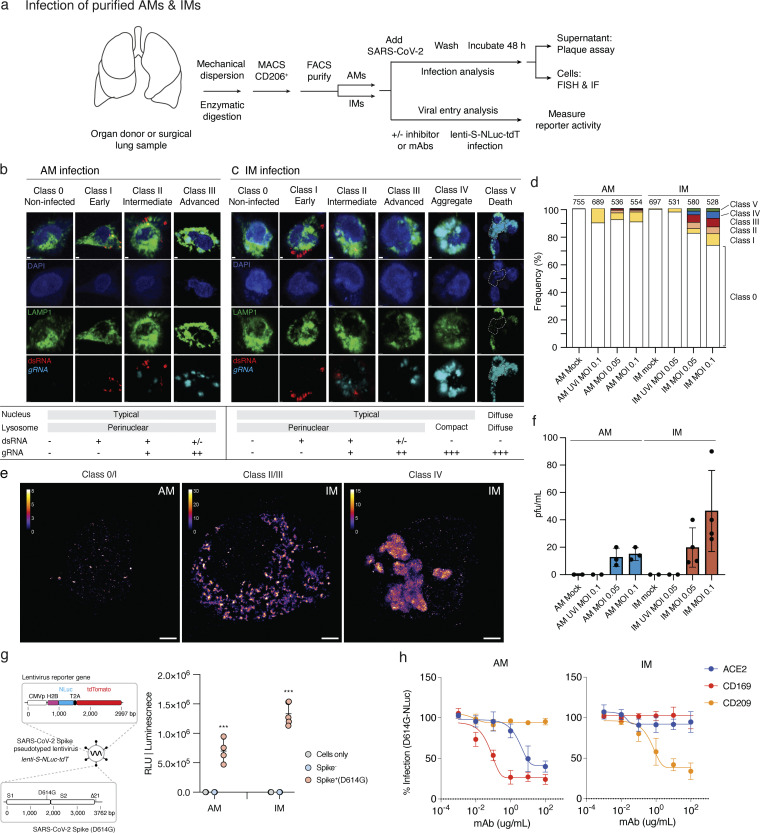
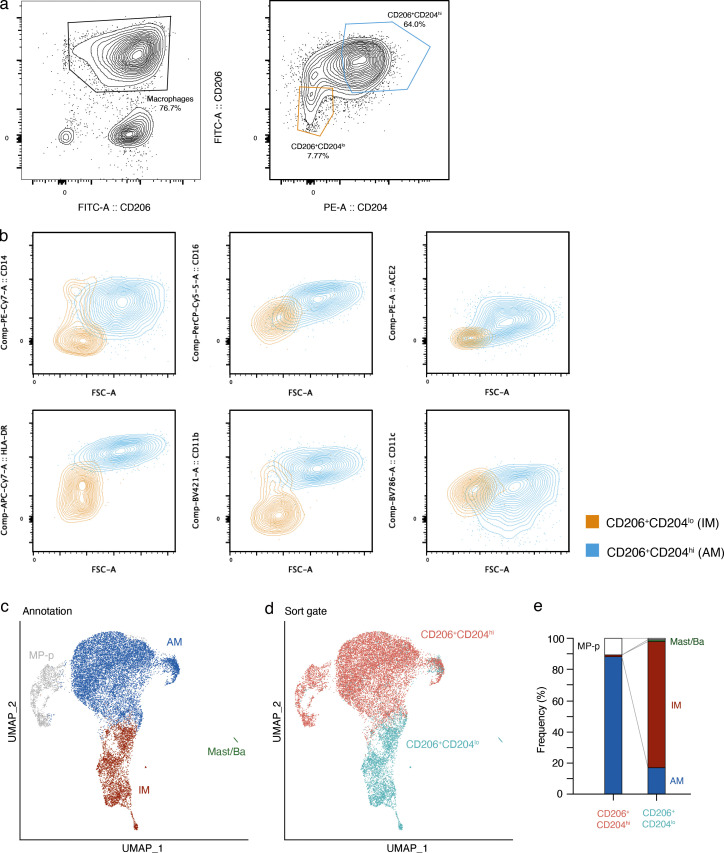
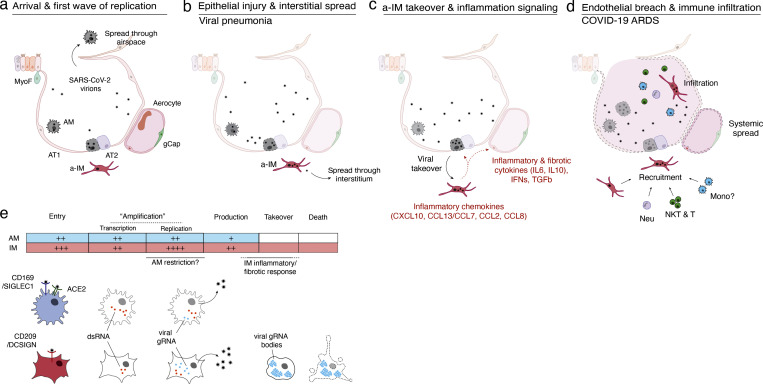
Early stages of deadly respiratory diseases including COVID-19 are challenging to elucidate in humans. Here, we define cellular tropism and transcriptomic effects of SARS-CoV-2 virus by productively infecting healthy human lung tissue and using scRNA-seq to reconstruct the transcriptional program in "infection pseudotime" for individual lung cell types. SARS-CoV-2 predominantly infected activated interstitial macrophages (IMs), which can accumulate thousands of viral RNA molecules, taking over 60% of the cell transcriptome and forming dense viral RNA bodies while inducing host profibrotic (TGFB1, SPP1) and inflammatory (early interferon response, CCL2/7/8/13, CXCL10, and IL6/10) programs and destroying host cell architecture. Infected alveolar macrophages (AMs) showed none of these extreme responses. Spike-dependent viral entry into AMs used ACE2 and Sialoadhesin/CD169, whereas IM entry used DC-SIGN/CD209. These results identify activated IMs as a prominent site of viral takeover, the focus of inflammation and fibrosis, and suggest targeting CD209 to prevent early pathology in COVID-19 pneumonia. This approach can be generalized to any human lung infection and to evaluate therapeutics.


Conflict of interest statement

Disclosures: J.B. Shrager reported personal fees from Merck, Inc. outside the submitted work. No other disclosures were reported.

Figures

Figure 1.
Figure 1.
Detection of virion production, viral RNA amplification, and subgenomic RNA in cultured human lung tissue infected ex vivo by SARS-CoV-2. (a) Strategy for slicing, culturing, infecting, and analyzing human lung tissue from healthy, surgically resected, or organ donor lungs. In each case, distal and proximal lung regions (e.g. dashed red circles, left) were sampled and sliced into 300–500 μm sections. Slices were cultured (DMEM/F12 medium supplemented with 10% FBS) at 37°C and subsequently exposed to SARS-CoV-2 for 2 h, washed to remove free virus, and cultured in supplemented DMEM/F12 for 24 or 72 h to allow infection to proceed before assaying supernatant for virion production by plaque assay, preserving tissue in 10% NBF for histological staining and multiplex smFISH, or dissociating tissue for 10x scRNA-seq. (b) Productive infection of lung slices from Case 5 measured by plaque assay. Lung slices were mock-infected for 72 h (“No virus”) or infected with purified SARS-CoV-2/WA1 virions (estimated multiplicity of infection ∼1; see Materials and methods) without pretreatment of the virus (“Virus”) or controls with virus pretreated with ultraviolet-C light (“Virus + UV”) or heat (“Virus + heat”) to inactivate virus, or with virus-infected culture treated with the viral RdRp inhibitor remdesivir at 10 μM final concentration (“Virus + RDV”). The supernatant was then harvested and plaque assay was performed on VeroE6 cells (Case 5; 1 donor bio-replicate). (c) scRNA-seq analysis of cultured lung slices from Case 5 infected with the virus and indicated control conditions as in panel b. Violin plot (left) shows viral RNA expression levels (total number of unique molecular identifiers [UMIs] for detected viral RNAs) in single cells, and bar plot (right) shows the number of viral subgenomic RNA junctions detected by SICILIAN (Dehghannasiri et al., 2021). Canonical, transcription-regulatory sequence (TRS) mediated junctions from the 5′ leader (TRS-L) to the 5′ end of open reading frames in the gene body (TRS-B); noncanonical, all other subgenomic junctions detected that pass SICILIAN statistical test (Case 5; 1 donor bio-replicate). (d) Bar graph (bottom) showing dynamic range of viral RNA molecules expressed (total number of viral UMIs/cell) in profiled single cells (Count) from scRNA-seq of infected lung slice cultures from all cases as in a but from lung slices cultured as indicated for 0, 24, or 72 h following exposure to SARS-CoV-2. Dashed lines (in cumulative distribution, top), expression levels for 99%, 99.9%, and 99.99% of profiled cells (Case 5; 1 donor bio-replicate). (e) Plaque assays on VeroE6/TMPRSS2 cells of supernatant collected serially at 24 and 72 h from the same lung slice culture. Slices were washed and media was completely replaced after the harvest of the supernatant at 24 h (Case 1; 1 donor bio-replicate). (f) Quantification of panel e showing plaques at 24 and 72 h, along with similar quantification of plaque assay results for remdesivir (RDV) treatment, UV viral inactivation, heat inactivation, and no virus controls. Values shown are the mean + SD of technical duplicates of the plaque assay (Case 1; 1 donor bio-replicate). pfu, plaque-forming units.
Figure S1.
Figure S1.
Classes and abundance of canonical and novel subgenomic junctions detected in cultured human lung slices infected by SARS-CoV-2. SARS-CoV-2 subgenomic RNA junctions were identified in scRNA-seq analysis of infected lung slice cultures from lung slices infected in all cases as individual sequence reads that mapped discontinuously on the viral genome, as called by SICILIAN (single cell precise splice estimation) (Dehghannasiri et al., 2021) using generalized linear statistical modeling for precise unannotated splice junction quantification in single cells. (a) Diagram of full-length SARS-CoV-2 genomic RNA (29,903 nt) showing annotated ORF positions, the common 5′ “leader” transcription-regulatory sequence (TRS-L, red fill) that connects in viral subgenomic RNAs to gene body TRS-B elements (not shown) adjacent to each of the canonically recognized ORFs (other colors), and the 5′ and 3′ untranslated regions (UTRs, open fill) of the viral genome. (b–d) Examples of inferred subgenomic RNA structures (left panel) based on the type of subgenomic junction detected, alongside arc plots (right panel) visualizing all novel junctions detected for that subgenomic junction type across all infection replicates. (b) “Canonical” subgenomic junctions connect the common 5′ leader transcription-regulatory sequence (TRS-L) to gene body (TRS-B) adjacent to each of the canonically recognized ORFs. (c–e) “Noncanonical” subgenomic junctions, which are consistent with previous long read sequencing results from in vitro infections of diverse cell lines by different viral isolates (Kim et al., 2020; Nomburg et al., 2020). (c) Rare “L-internal” junctions connect TRS-L to cryptic gene body fusion sites. These could represent aberrant jumps during discontinuous transcription. (d) “Internal” junctions occur between any two internal sites within the gene body. (e) The most abundant “3′ UTR” junctions occur between any internal site within the gene body and the 3′ UTR of the genome. These are likely overrepresented due to the predominant bias in sequence reads to the 3′-end in the scRNA-seq technology employed (10x Genomics).
Figure 2.
Figure 2.
A comprehensive map of SARS-CoV-2 cell tropism in the human lung. (a) Violin plot of viral RNA expression level (log10-transformed viral UMIs) in the single cells of each of the molecular cell types detected by scRNA-seq of the lung slice infections from Cases 1–4. The dot plot above shows the pseudo-bulk viral RNA expression level for each cell type; dot size indicates the percentage of cells in each type with detected expression of viral RNA (thresholded at >20 viral UMI), and the shading shows mean level of expression for the cells that passed detected expression threshold. Asterisk indicates cell types in which a proliferative subpopulation was detected but merged with the non-proliferating population in this plot (note these include basal, macrophage, and NKT cells, none of which were previously found to include a proliferating subpopulation in the native lung); blue text indicates additional cell types not detected or annotated in our native human lung cell atlas (Travaglini et al., 2020); gray text indicates cell types only observed in cultured lung slices. (b–d) RNAscope multiplex smFISH of infected lung slice culture from Case 2, fixed 72 h after infection. (b) Close-ups (boxed, split channels at right) of canonical (alveolar epithelial type 2 [AT2]) and novel (myofibroblast [MyoF], CD4 T cell) lung cell targets of the virus, as well as an infected cell at a late stage of infection as indicated by high expression of positive-strand viral RNA detected with S probe (red) and little or no expression of negative strand viral RNA (Neg, yellow) or the cell type markers examined. Probes were: positive strand viral RNA (viral S, red), negative strand viral RNA (Neg, antisense viral orf1ab, yellow), the canonical SARS-CoV-2 receptor ACE2 (white), compartment markers for the epithelium (EPCAM, magenta), stroma (COL1A1, magenta), and cell type markers identifying alveolar epithelial type 2 (AT2) cells (SFTPC, green), myofibroblasts (MyoF; ASPN, green), CD4 T cells (CD3, magenta; CD4, green; CD8, cyan). (c) RNAscope smFISH of lung slice cultures as above detecting infected macrophage subtypes: viral S (red), negative-strand RNA (antisense Orf1ab, yellow), the canonical SARS-CoV-2 receptor ACE2 (white), and a receptor (DPP4) used by the related MERS coronavirus (white), general macrophage marker MARCO (magenta), and a-IM markers STAB1 (cyan) and IER3 (green). Close-ups of boxed regions (right) show AMs (MARCO+STAB1IER3) that express few S puncta and no negative puncta, and a-IMs (MARCO+STAB1IER3+) in early infection (“early a-IM”) expressing few S puncta and abundant negative puncta, and a-IMs in late infection (“late a-IM”) with abundant S and negative puncta. (d) RNAscope smFISH detecting interaction between infected a-IM (MARCO+IER3+) expressing viral S and negative strand RNA (antisense Orf1ab), and two CD4 T cells (CD3+CD4+) expressing viral negative-strand RNA but not viral S. Split panels at right show individual channels. Scale bars, 10 µm.
Figure S2.
Figure S2.
Identity and abundance of canonical and novel lung cell types detected in human lung slice cultures by scRNA-seq. Hierarchical tree showing human lung molecular cell types and their annotations in the indicated tissue compartments following iterative clustering of scRNA-seq profiles of cells from Cases 1–4 in each compartment. Numbers below the cell type name show the total abundance of the cell type, and the stacked bar plot indicates proportions detected from each condition of freshly profiled uncultured (Uncultured), cultured, and mock-infected (Mock), or cultured and infected (Infection). Black, canonical cell types per our healthy reference human lung cell atlas (Travaglini et al., 2020) (bolded, detected in >1 lung slice dataset). Cell types in which a proliferative subpopulation was detected is indicated (p) with the number of proliferative cells given in parenthesis. Cell types that were difficult to distinguish via 10x expression profiles without full-length transcriptome were merged. Abbreviations: Cil, ciliated; Cil-px, proximal ciliated; Bas, basal; Bas-px, proximal basal; Bas-d, differentiating basal; Gob, goblet; Ser, serous; Ion, ionocyte; NE, neuroendocrine; AT1, alveolar epithelial type 1; AT2, alveolar epithelial type 2; AT2-s, signaling alveolar epithelial type 2. Art, artery; aCap, capillary aerocyte; gCap, general capillary; Bro, bronchial vessel; Lym, lymphatic. ASM, airway smooth muscle; VSM, vascular smooth muscle; Peri, pericyte; MyoF, myofibroblast; FibM, fibromyocte; AdvF, adventitial fibroblast; AlvF, alveolar fibroblast; LipF, lipofibroblast; Meso, mesothelial. CD4 M/E, CD4 memory/effector T cells; CD4 Na, CD4 naïve T cells; Treg, regulatory T cells; CD8 TRM, CD8 tissue resident memory T cells; NK, natural killer cell; MP, macrophage; pDC, plasmacytoid dendritic cell; mDC, myeloid dendritic cell; maDC, mature dendritic cell; Mono C, classical monocyte; Mono NC, nonclassical monocyte; Mono Int, intermediate monocyte; Neu, neutrophil; Mast Ba, mast/basophil; Mega, megakaryocyte.
Figure 3.
Figure 3.
Identity, tissue localization, and viral takeover of molecularly distinct macrophage populations in the human lung. (a) UMAP projection of molecularly distinct macrophage subpopulations in cultured human lung slices from Cases 1 and 4 identified by computational clustering of their individual 10x scRNA-seq expression profiles (colored dots). Note three major molecular types: AM and newly designated (see panel e) IM and a-IM, plus a minor cluster of proliferating macrophages (boxed) that using distinguishing markers shown in panel c could be subclassified as proliferative AMs (AM-p) or proliferative IMs (IM-p) (expanded box). (b) Schematic of alveoli, with the epithelial barrier (green) comprised of AT1, AT2, and AT2-s cells, and the endothelial barrier of underlying capillary comprised of aerocytes and general capillary cells. AMs reside in the airspace, while IMs and a-IMs reside in the interstitium (gray) bounded by the basal surfaces of epithelium and endothelium of neighboring alveoli. (c) Heatmap of expression of general macrophage marker genes (rows) in the individual macrophages from panel a (columns) of the indicated subtypes (for visualization, randomly downsampled to <80 cells), and top differentially expressed genes that distinguish the subtypes. Note all clusters express general macrophage marker genes, but each has its own set of selectively expressed markers. (d) Dot plot showing the fraction of expressing cells and mean expression (among expressing cells) of AM markers and IM activation markers in the macrophage subtypes from panel a. Encoded proteins with related functions are indicated by the color of the gene names. (e) Tissue localization of macrophage subtypes by RNAscope smFISH and immunostaining in control, non-cultured human lung from Case 2. Markers shown: general macrophage antigen CD68 (green, protein), AT1 antigen RAGE (white, protein), AM marker FABP4 (cyan, RNA), and IM marker RNASE1 (red, RNA). Scale bar, 30 µm. Note AMs localized to the apical side of AT1 cells that comprise alveolar epithelium (interpreted to be alveolar airspace), whereas IMs are localized to the basal side of AT1 cells and are bounded by epithelium (interpreted to be the interstitial space). (f) Quantification of anatomical localization of AMs and IMs in control, non-cultured human lung from Case 2. Cells with substantial (>80%) colocalization with RAGE AT1 antigen were scored as interstitial, and those without substantial colocalization with RAGE AT1 antigen (<20% to account for AMs contacting the apical side of AT1 cells, as schematized in panel b) and any other cells were scored as alveolar. (g) Viral RNA takeover of the host transcriptome (Viral UMIs/Total Cellular UMIs) graphed against viral expression (Total Viral UMIs) in single cells of AMs (blue dots) and a-IMs (red dots) from the infected human lung slices from Case 1. Note that beginning at ∼70 viral RNA molecules (UMIs) per cell, viral RNA begins to rapidly increase to thousands of viral molecules per cell and dominate (“takeover”) the host cell transcriptome (25–60% total cellular UMIs) in a-IMs, whereas in AMs viral RNA never exceeded a few hundred UMI per cell and 1–2% of the host transcriptome, even at corresponding viral RNA cellular loads. (h and i) Dot plot of scRNA-seq results of freshly profiled human lung slice cultures from Cases 1 and 4, showing for each indicated macrophage subtype (AM, alveolar macrophage; IM, interstitial macrophage; a-IM, activated interstitial macrophage) the fraction of expressing cells (% Expression) and mean expression value among expressing cells (ln(UP10K+1)) of (h) proposed canonical and alternative cellular receptors, and (i) other key proviral host factors in the SARS-CoV-2 replication cycle previously identified in CRISPR-based functional genetic screens (Baggen et al., 2021). Genes are grouped based on different steps of the viral life cycle (black font) and their normal cellular functions (colored font). Dots representing genes differentially upregulated in a-IMs are outlined in red, and dots representing genes differentially upregulated in AMs are outlined in blue (adjusted P value <0.05). Although DC-SIGN/CD209 is consistently differential expressed between both IM subtypes and AMs, its enrichment shown in a-IMs compared with IMs was variable in other cases.
Figure 4.
Figure 4.
Differential induction of host response and inflammatory genes in activated interstitial and alveolar macrophages shown by infection pseudotime. (a) Viral takeover (viral UMIs/total cellular UMIs) graphed against viral infection pseudotime for AMs (blue) and a-IMs (red) from the infected human lung slices from Case 1; gray shading indicates a 95% confidence interval. Pseudotime was separately computed for AMs and a-IMs by taking a linear combination of principal components that best correlated with the monotonic increase in viral expression, then linearly rescaling between 0 and 1. Early cells in each infection pseudotime trajectory were defined by normalized pseudotime <0.2, and late cells were defined by normalized pseudotime >0.8. (b–f) Host gene expression profiles of AMs and a-IMs plotted along infection pseudotime, as in panel a. A differential expression test was performed on the top 250 genes with the highest loadings for the infection pseudotime axis, and the selected genes presented (b–f) (visualized for the AMs and a-IMs in infected human lung slices from Case 1) were among those that had a statistically significant association with infection pseudotime as indicated. (b) Early interferon response genes were significantly associated with a-IM pseudotime trajectory. (c) Late interferon stimulated genes (ISGs) that were significantly associated with a-IM pseudotime trajectory. (d) Chemokine ligands that were significantly associated with a-IM pseudotime trajectory. (e) Cytokines that were significantly associated with a-IM pseudotime trajectory. (f) ISGs that were significantly associated with AM pseudotime trajectory. (g) Dot plots (left) showing discretized expression of chemokine/cytokine ligands that were differentially expressed between early and late pseudotime a-IMs (CXCL10, CCL2, CCL7, CCL8, CCL13, IL6, IL10, TGFB1) and AMs (CXCL16), and their cognate receptors (right) in human lung cells (all infected conditions from Cases 1–4); only cell types and chemokines with detected expression are shown. Lines connect ligands with cognate receptor. Red, virally induced in a-IMs; blue, differentially virally induced in AMs. (h) Summary schematic depicting the six cytokine and chemokine genes induced in a-IMs during viral takeover (dot sizes scaled to percentage expression and shaded with mean expression as in panel g), and the lung cell targets of the encoded inflammatory signals predicted from the expression of the cognate receptor genes. Outbound arrows from a-IMs, cytokine signaling to lung cell targets or chemokine recruitment of immune cells toward a-IMs. (i–l) Micrographs of RNAscope smFISH and immunostaining of an infected human lung slice culture from Case 2, 72 h after infection (as in Fig. 2 b) examining inflammasome activation state (ASC speck+) of infected alveolar (AM, MRC1+IER3-S+) and interstitial (IM, MRC1+IER3+S+) macrophages, and terminally infected cells that express none of these markers. ASC immunostaining was rare overall, but could be occasionally detected in late infected IMs (j), and late infected “no marker” cells (k), marked by abundant Spike staining, and the presence of ASC specks.
Figure S3.
Figure S3.
Viral infection pseudotime and the organ-wide landscape of the a-IM inflammatory signals in infected human lung slice cultures. (a) UMAP projection of AM and a-IM in infected human lung slices from 10x scRNA-seq from infections 1 and 4, as in Fig. 3. (b) Normalized expression of SARS-CoV-2 RNA in each cell as shown by the heat map scale. (c) Normalized value of a-IM viral pseudotime value as shown in Fig. 4 a. (d) Normalized value of AM viral pseudotime value as shown in Fig. 4 a. (e–g) UMAP visualizing the molecular cell types, SARS-CoV-2 viral load, and expression of the inflammatory chemokine and cytokine ligands that had a statistically significant association with infection pseudotime in a-IM (red text), or AMs (blue text) as in Fig. 4, in each of the molecular cell types detected by scRNA-seq of infected human lung slice cultures from Case 1. Note the focus of chemokine and cytokine expression that colocalizes with the single cells that express high viral RNA levels.
Figure 5.
Figure 5.
SARS-CoV-2 entry, replication, and productive infection of purified AMs and IMs. (a) Strategy for purification, culture, and infection of human lung macrophages with SARS-CoV-2 virions or a SARS-CoV-2 Spike-pseudotyped lentivirus. Human lung tissue obtained from surgical resections or organ donors was dissociated fresh, then enriched for macrophages by MACS using antibodies against the general lung macrophage antigen CD206, followed by specific AM or IM purification using FACS for distinguishing markers (Fig. S4). Purified AMs (CD206+CD204hi) or IMs (CD206+CD204lo) were cultured at 37°C in DMEM/F12 medium with 10% FBS, and either infected with SARS-CoV-2 virions and analyzed as indicated (Cases 11–12, panels b–f), or tested for viral entry and the effect of inhibitors and mABs using a SARS-CoV-2 Spike-pseudotyped lentivirus lenti-S-NLuc-tdT that encodes an NLuc reporter (Cases 6–10, 5 bio-replicates, panels g and h). For SARS-CoV-2 infections, purified AMs or IMs were mock-infected or exposed for 2 h to untreated or UV-inactivated (UVi) SARS-CoV-2 virions (MOI 0.05 or 0.01), washed to remove free virions, and infection continued for 48 h before assaying supernatant for virion production by plaque assay or analyzing the infected cells by fluorescence in situ hybridization (FISH using HCR) and IF staining (one bio-replicate shown). (b and c) Infection intermediates and morphologies of SARS-CoV-2–infected AMs (b) or IMs (c) generated as above and then fixed and IF-labeled for lysosomal antigen LAMP1 (green) and the infection dsRNA intermediate (red), followed by HCR for viral genomic RNA (light blue) and DAPI nuclear counterstain (dark blue). Examples of the observed infection classes are shown and their features summarized at panel bottom: Class 0 (non-infected), no expression of either dsRNA or viral gRNA; Class I (early infection): expression of dsRNA only; Class II (intermediate infection): co-expression of dsRNA and viral gRNA; Class III (advanced infection): expression of viral gRNA only; Class IV (aggregates): expression of globular viral gRNA bodies; Class V (cell destruction/death): weak or non-staining of DAPI nuclear stain and LAMP1, and expression of viral RNA. Scale bars, 1 µm. (d) Quantification of panels b and c showing the relative abundance of each infection class. Values above each bar, number of cells scored per condition. (e) SR microscopy of viral gRNA for Class 0/I AM, Class II/III IM, and Class IV IM from panels b and c. Note the large, globular viral gRNA aggregates (“RNA bodies”) throughout the cytoplasm in the class IV IM. Scale bars, 2 µm. (f) SARS-CoV-2 virions released into the medium by the above infected AMs or IMs, as determined by plaque assay of the indicated culture supernatants on a monolayer of VeroE6 cells. pfu, plaque-forming units. (g) Viral entry into AMs and IMs depends on SARS-CoV-2 Spike. Left: Diagram of lenti-S-NLuc-tdT, a lentivirus pseudotyped to express full length SARS-CoV-2 Spike, encoding both S1 and S2 subunits from the D614G variant (Spike+, D614G) protein on its surface and also engineered to express the reporter gene (boxed) encoding nuclear-targeted nanoluciferase (H2B- NLuc) and tdTomato fluorescent protein, separated by a self-cleaving T2A peptide. Right: Lenti-S-NLuc-tdT (Spike+ [D614G]) or a non-pseudotyped control lentivirus (Spike−) were added to purified AMs or IMs (Cases 11–12, two bio-replicates) in culture, and, after 4 h, free virions were washed off and infections continued for 48 h before quantification of infection by expression level (luminescence) of the NLuc reporter. Uninfected AMs or IMs (cells only) served as background control. RLU, relative light units. NLuc luciferase values are presented as mean ± SD from two independent experiments, with values normalized to control (non-neutralized) viral infections in each plate. Statistical test used was the unpaired t test. P values are computed by comparing Spike+(D614G) to Spike-controls. ***, P < 0.001. (h) Neutralization of lenti-S-NLuc-tdT entry into purified AMs (left) or IMs (right) from Cases 6–10 (five bio-replicates) by the indicated blocking antibodies against ACE2, CD169, or CD209.
Figure S4.
Figure S4.
FACS and scRNA-seq characterization of purified AMs and IMs. (a–e) FACS gating and scRNA-seq or purified AMs and IMs from Case 11 (one bio-replicate shown). (a) Sequential FACS data and sorting gates (red) for dissociated human lung cells, following MACS enrichment of lung resident macrophage (MACS CD206+) cells. Cells were first gated on viable single cells that were CD45+ and CD206+ (left panel), then two gates were subsequently sorted (right panel) for 10x scRNA-seq transcriptomic profiling: CD206+CD204hi (putative AMs), and CD206+CD204lo (putative IMs). (b) Flow cytometry of the sorted AMs and IMs, with flow gating defined as in Fig. S4. Results are shown for staining of various surface antigens reported to distinguish AMs and IMs, including CD14 (upper left), CD16 (center top), HLA-DR (left bottom), CD11b (center bottom), and CD11c (lower right), as well as for staining of the canonical SARS-CoV-2 receptor ACE2 (upper right). Note that although neither AMs nor IMs express ACE2 mRNA (Fig. 3 h), AMs, but not IMs, express ACE2 protein. (c) UMAP projection of sorted putative AMs and putative IMs from (a), with the transcriptomic molecular cell annotations indicated, including AMs, IMs, proliferating macrophages, and rare mast/basophils. (d) The same UMAP projection colored by sorting gate metadata. Note the correspondence between the scRNA-seq molecular annotation and the gating metadata. (e) The relative frequencies of the molecular types of AMs and IMs in each of the indicated sorting gates; in the CD206+CD204hi channel, AMs were 88%, IMs were 1%, and proliferating macrophages were 11%; in the CD206+CD204lo channel, IMs were 81%, AMs were 17%, proliferating macrophages were 1%, and mast/basophils were 1%.
Figure S5.
Figure S5.
Effect on macrophage entry of therapeutic mAbs targeting the SARS-CoV-2 receptor binding domain. Luminescence readout (RLU, relative light units) of neutralization of SARS-CoV-2 pseudovirus (lenti-S-NLuc-tdT, diluted in DMEM/F12 medium, supplemented with polybrene, 1:1,000, vol/vol) by 0.1 μg/ml of the indicated monoclonal antibodies (mAbs) against SARS-CoV-2 receptor binding domain (RBD) in cultured purified AMs (a) or IMs (b) from Cases 5–6 (two bio-replicates). To allow mAb binding, virions were pretreated with the mAb for 1 h before the addition of virions to the cells. NLuc luciferase values are presented as mean ± SD from two independent experiments. The statistical test used was Dunnett’s multiple comparisons test versus control (no antibody). **, P < 0.01; *, P < 0.05; n.s., non-significant.
Figure 6.
Figure 6.
Model of initiation, transition, and pathogenesis of COVID-19 and the viral lifecycle in AMs and IMs. (a–d) Model of COVID-19 initiation in the human lung and transition from viral pneumonia to lethal COVID-19 ARDS. (a) SARS-CoV-2 virion dissemination and arrival in the alveoli. Luminal AM encounter virions shed from the upper respiratory tract that enter the lung. AMs can express low to moderate numbers of viral RNA molecules and can propagate the infection but “contain” the viral RNA from taking over the total transcriptome and show only a very limited host cell inflammatory response to viral infection. (b) Replication and epithelial injury. SARS-CoV-2 virions enter AT2 cells through ACE2, its canonical receptor, and “replicate” to high viral RNA levels, producing infectious virions and initiating viral pneumonia. (c) a-IM takeover and inflammation signaling. SARS-CoV-2 virions spread to the interstitial space through either transepithelial release of virions by AT2 cells or injury of the epithelial barrier, and enter a-IMs. Infected a-IMs can express very high levels of viral RNA that dominate (“take over”) the host transcriptome and can propagate the infection. Viral takeover triggers induction of the chemokines and cytokines shown, forming a focus of inflammatory and fibrotic signaling. (d) Endothelial breach and immune infiltration. The a-IM inflammatory cytokine IL6 targets structural cells of the alveolus causing epithelial and endothelial breakdown, and the inflammatory cytokines recruit the indicated immune cells from the interstitium or bloodstream, which flood and infiltrate the alveolus causing COVID-19 ARDS. Local inflammatory molecules are amplified by circulating immune cells, and reciprocally can spread through the bloodstream to cause systemic symptoms of cytokine storm. (e) Comparison of the SARS-CoV-2 viral lifecycle in AMs and IMs. Although both can produce infectious virions, note differences in viral entry receptors (AMs can use ACE2 and CD169/SIGLEC1, whereas IMs use CD209); viral RNA transcription of dsRNA intermediates (greater in AMs); replication of full-length genomic RNA (greater in IMs); viral takeover, formation of RNA bodies, and induction of a robust host cell inflammatory response (only in IMs), and cell destruction/death (only in IMs).

Similar articles

Cited by

References

    1. Adams, T.S., Schupp J.C., Poli S., Ayaub E.A., Neumark N., Ahangari F., Chu S.G., Raby B.A., DeIuliis G., Januszyk M., et al. . 2020. Single-cell RNA-seq reveals ectopic and aberrant lung-resident cell populations in idiopathic pulmonary fibrosis. Sci. Adv. 6:eaba1983. 10.1126/sciadv.aba1983 - DOI - PMC - PubMed
    1. Anderson, R.N.; CDC . 1999. Deaths: Leading causes for 1999. Natl. Vital Stat. Rep. 49:1–87. - PubMed
    1. Andronov, L., Genthial R., Hentsch D., and Klaholz B.P.. 2022. splitSMLM, a spectral demixing method for high-precision multi-color localization microscopy applied to nuclear pore complexes. Commun. Biol. 5:1100. 10.1038/s42003-022-04040-1 - DOI - PMC - PubMed
    1. Andronov, L., Han M., Zhu Y., Roy A.R., Barentine A.E.S., Garhyan J., Qi L.S., and Moerner W.E.. 2023. Nanoscale cellular organization of viral RNA and proteins in SARS-CoV-2 replication organelles. bioRxiv. 10.1101/2023.11.07.566110 (Preprint posted November 07, 2023). - DOI - PMC - PubMed
    1. Baggen, J., Vanstreels E., Jansen S., and Daelemans D.. 2021. Cellular host factors for SARS-CoV-2 infection. Nat. Microbiol. 6:1219–1232. 10.1038/s41564-021-00958-0 - DOI - PubMed