

Associations Between HbA1c and Glucose Time in Range Using Continuous Glucose Monitoring in Type 1 Diabetes: Cross-Sectional Population-Based Study
- PMID: 38598054
- PMCID: PMC11096286
- DOI: 10.1007/s13300-024-01572-z
Associations Between HbA1c and Glucose Time in Range Using Continuous Glucose Monitoring in Type 1 Diabetes: Cross-Sectional Population-Based Study
Abstract
Introduction: Continuous glucose monitoring (CGM) introduces novel indicators of glycemic control.
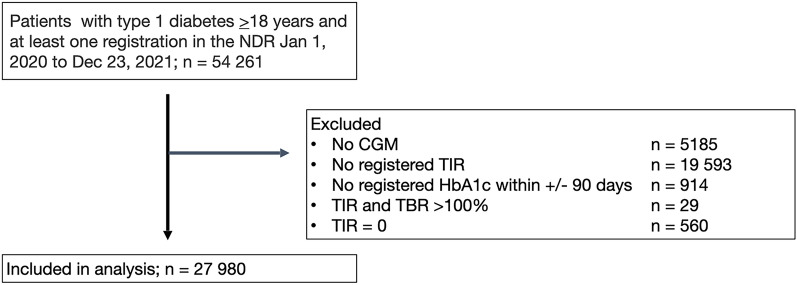
Methods: This cross-sectional study, based on the Swedish National Diabetes Register, examines 27,980 adults with type 1 diabetes. It explores the relationships between HbA1c (glycated hemoglobin) and various CGM-derived metrics, including TIR (time in range, representing the percentage of time within the range of 4-10 mmol/l for 2 weeks), TAR (time above range), TBR (time below range), mean glucose, standard deviation (SD), and coefficient of variation (CV). Pearson correlation coefficients and linear regression models were utilized for estimation.
Results: The analysis included 46% women, 30% on insulin pump, 7% with previous coronary heart disease and 64% with retinopathy. Mean ± SD values were age 48 ± 18 years, diabetes duration 25 ± 16 years, HbA1c 58.8 ± 12.8 mmol/mol, TIR 58.8 ± 19.0%, TAR 36.3 ± 20.0%, TBR 4.7 ± 5.4%, mean sensor glucose 9.2 ± 2.0 mmol/l, SD 3.3 ± 1.0 mmol/l, and CV 36 ± 7%. The overall association between HbA1c and TIR was - 0.71 (Pearson's r), with R2 0.51 in crude linear regression and 0.57 in an adjusted model. R2 values between HbA1c and CGM mean glucose were 0.605 (unadjusted) 0.619 (adjusted) and TAR (unadjusted 0.554 and fully adjusted 0.568, respectively), while fully adjusted R2 values were 0.458, 0.175 and 0.101 between HbA1c and CGM SD, CGM CV and TBR, respectively.
Conclusions: This descriptive study demonstrates that the degree of association between HbA1c and new and readily available CGM-derived metrics, i.e., time in range (TIR), time above range (TAR), and CGM mean glucose, is robust in assessing the management of individuals with type 1 diabetes in clinical settings. Metrics from CGM that pertain to variability and hypoglycemia exhibit only weak correlations with HbA1c.
Keywords: Continuous glucose measurement; Epidemiology; HbA1c; Type 1 diabetes.
© 2024. The Author(s).
Conflict of interest statement
Björn Eliasson reports personal fees from Amgen, AstraZeneca, Boehringer Ingelheim, Eli Lilly, Merck Sharp and Dohme, Mundipharma, Novo Nordisk and Sanofi, all outside the submitted work. Elin Allansson Kjölhede declare no conflict of interest relevant to this article. Sofia Salö and Nick Fabrin Nielsen are employed by NovoNordisk. However, the views expressed in this study are their own and not those of NovoNordisk. Katarina Eeg-Olofsson has received personal lecture fees and/or honoraria for consulting from Sanofi, Eli Lilly, Novo Nordisk and Abbott, all outside the submitted work.
Figures

References
LinkOut - more resources
Full Text Sources
