. 2024 Apr 10:12:RP90437.
doi: 10.7554/eLife.90437.

Bone canonical Wnt signaling is downregulated in type 2 diabetes and associates with higher advanced glycation end-products (AGEs) content and reduced bone strength

Affiliations

Bone canonical Wnt signaling is downregulated in type 2 diabetes and associates with higher advanced glycation end-products (AGEs) content and reduced bone strength

Giulia Leanza et al. Elife. .

Abstract

Type 2 diabetes (T2D) is associated with higher fracture risk, despite normal or high bone mineral density. We reported that bone formation genes (SOST and RUNX2) and advanced glycation end-products (AGEs) were impaired in T2D. We investigated Wnt signaling regulation and its association with AGEs accumulation and bone strength in T2D from bone tissue of 15 T2D and 21 non-diabetic postmenopausal women undergoing hip arthroplasty. Bone histomorphometry revealed a trend of low mineralized volume in T2D (T2D 0.249% [0.156-0.366]) vs non-diabetic subjects 0.352% [0.269-0.454]; p=0.053, as well as reduced bone strength (T2D 21.60 MPa [13.46-30.10] vs non-diabetic subjects 76.24 MPa [26.81-132.9]; p=0.002). We also showed that gene expression of Wnt agonists LEF-1 (p=0.0136) and WNT10B (p=0.0302) were lower in T2D. Conversely, gene expression of WNT5A (p=0.0232), SOST (p<0.0001), and GSK3B (p=0.0456) were higher, while collagen (COL1A1) was lower in T2D (p=0.0482). AGEs content was associated with SOST and WNT5A (r=0.9231, p<0.0001; r=0.6751, p=0.0322), but inversely correlated with LEF-1 and COL1A1 (r=-0.7500, p=0.0255; r=-0.9762, p=0.0004). SOST was associated with glycemic control and disease duration (r=0.4846, p=0.0043; r=0.7107, p=0.00174), whereas WNT5A and GSK3B were only correlated with glycemic control (r=0.5589, p=0.0037; r=0.4901, p=0.0051). Finally, Young's modulus was negatively correlated with SOST (r=-0.5675, p=0.0011), AXIN2 (r=-0.5523, p=0.0042), and SFRP5 (r=-0.4442, p=0.0437), while positively correlated with LEF-1 (r=0.4116, p=0.0295) and WNT10B (r=0.6697, p=0.0001). These findings suggest that Wnt signaling and AGEs could be the main determinants of bone fragility in T2D.

Keywords: AGEs; Wnt signaling; biochemistry; bone; chemical biology; diabetes; histomorphometry; human; medicine.

Plain language summary

Type 2 diabetes is a long-term metabolic disease characterised by chronic high blood sugar levels. This in turn has a negative impact on the health of other tissues and organs, including bones. Type 2 diabetes patients have an increased risk of fracturing bones compared to non-diabetics. This is particularly true for fragility fractures, which are fractures caused by falls from a short height (i.e., standing height or less), often affecting hips or wrists. Usually, a lower bone density is associated with higher risk of fractures. However, patients with type 2 diabetes have increased bone fragility despite normal or higher bone density. One reason for this could be the chronically high levels of blood sugar in type 2 diabetes, which alter the properties of proteins in the body. It has been shown that the excess sugar molecules effectively ‘react’ with many different proteins, producing harmful compounds in the process, called Advanced Glycation End-products, or AGEs. AGEs are – in turn –thought to affect the structure of collagen proteins, which help hold our tissues together and decrease bone strength. However, the signalling pathways underlying this process are still unclear. To find out more, Leanza et al. studied a signalling molecule, called sclerostin, which inhibits a signalling pathway that regulates bone formation, known as Wnt signaling. The researchers compared bone samples from both diabetic and non-diabetic patients, who had undergone hip replacement surgery. Analyses of the samples, using a technique called real-time-PCR, revealed that gene expression of sclerostin was increased in samples of type 2 diabetes patients, which led to a downregulation of Wnt signaling related genes. Moreover, the downregulation of Wnt genes was correlated with lower bone strength (which was measured by compressing the bone tissue). Further biochemical analysis of the samples revealed that higher sclerostin activity was also associated with higher levels of AGEs. These results provide a clearer understanding of the biological mechanisms behind compromised bone strength in diabetes. In the future, Leanza et al. hope that this knowledge will help us develop treatments to reduce the risk of bone complications for type 2 diabetes patients.


Conflict of interest statement

GL, FC, MF, CP, VV, FT, NP, GV, AP, RS, FZ, AB, ES, ST, RC, MM, RP, NN No competing interests declared

Figures

Figure 1.
Figure 1.. Gene expression analysis in trabecular bone samples.
(A) SOST mRNA levels resulted higher in type 2 diabetes (T2D) subjects versus non-diabetic subjects (p<0.0001). (B) DKK-1 mRNA expression level was not different between groups (p=0.2022). (C) LEF-1 mRNA levels resulted lower in T2D subjects versus non-diabetics subjects (p=0.0136). (D) WNT10B mRNA expression level was lower in T2D subjects versus non-diabetic subjects (p=0.0302). (E) WNT5A mRNA resulted higher in T2D subjects versus non-diabetics subjects (p=0.0232). (F) COL1A1 mRNA levels resulted lower in T2D subjects versus non-diabetic subjects (p=0.0482). (G) GSK3B mRNA levels resulted higher in T2D subjects versus non-diabetic subjects (p=0.0456). (H–J) AXIN2, BETA-CATENIN, SFRP5 mRNA levels were not different between groups (p=0.2296, p=0.3073, p=0.1390). Data are expressed as fold changes over beta-actin. Medians and interquartile ranges, differences between non-diabetics and T2D subjects were analyzed using Mann-Whitney test.
Figure 2.
Figure 2.. Relationship between advanced glycation end-products (AGEs) (µg quinine/g collagen) bone content and mRNA level of the Wnt signaling key genes in type 2 diabetes (T2D) and non-diabetic subjects.
(A) LEF-1 negatively correlated with AGEs (r=−0.7500; p=0.0255). (B) COL1A1 negatively correlated with AGEs (r=−0.9762; p=0.0004). (C) SOST mRNA level expression positively correlated with AGEs (r=0.9231; p<0.0001). (D) WNT5A mRNA expression level positively correlated with AGEs (r=0.6751; p=0.0322). (E) WNT10B mRNA expression level was not correlated with AGEs (r=−0.4883; p=0.1938). (F) DKK1 mRNA expression level was not correlated with AGEs (r=0.0476; p=0.9349). (G) GSK3B mRNA expression level was positively correlated with AGEs (r=0.7500; p=0.0255). (H) SFRP5 mRNA expression level was positively correlated with AGEs (r=0.7167; p=0.0369). (I) AXIN2 and (J) SFRP5 mRNA expression levels were not correlated with AGEs (r=0.5500, p=0.1328; r=0.2167, p=0.5809). Data were analyzed using nonparametric Spearman correlation analysis and r represents the correlation coefficient.
Figure 3.
Figure 3.. Relationship between fasting glucose levels (mg/dl) and disease duration with SOST and WNT5A mRNA levels.
(A) SOST positively correlated with fasting glucose levels (r=0.4846; p=0.0043). (B) SOST positively correlated with disease duration (r=0.7107; p=0.0174). (C) WNT5A positively correlated with fasting glucose levels (r=0.5589; p=0.0037). (D) GSK3B positively correlated with fasting glucose levels (r=0.4901; p=0.0051). Data were analyzed using nonparametric Spearman correlation analysis and r represents the correlation coefficient.
Figure 3—figure supplement 1.
Figure 3—figure supplement 1.. Relationship between fasting glucose levels (mg/dl) and LEF 1, WNT5A, WNT10B, DKK-1, COL1A1 mRNA levels.
(A–E) Data showed negative correlations between fasting glucose levels (mg/dl) and (A) LEF-1 (r=–0.3649; p=0.0613), (B) WNT10B (r=–0.0041; p=0.9863), (C) COL1A1 (r=–0.1157; p=0.5354), (D) DKK-1 (r=–0.0947; p=0.6522) mRNA levels. Data showed positive correlations between fasting glucose levels (mg/dl) with (E) AXIN2 (r=0.0993; p=0.6442), (F) BETA-CATENIN (r=0.2371; p=0.1991), and (G) SFRP5 (r=0.3767; p=0.0696). Data were analyzed using nonparametric Spearman correlation analysis and r represents the correlation coefficient.
Figure 4.
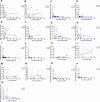
Figure 4.. Relationship between Young’s modulus (MPa), ultimate strength (MPa), and yield strength (MPa) with mRNA levels of the Wnt signaling key genes in type 2 diabetes (T2D) and non-diabetic subjects.
(A) SOST negatively correlated with Young’s modulus (MPa); (r=−0.5675; p=0.0011). (B) LEF-1 positively correlated with Young’s modulus (MPa); (r=0.4116; p=0.0295). (C) WNT10B positively correlated with Young’s modulus (MPa); (r=0.6697; p=0.0001). (D) AXIN2 negatively correlated with Young’s modulus (MPa); (r=−0.5523; p=0.0042). (E) BETA-CATENIN negatively correlated with Young’s modulus (MPa); (r=−0.5244; p=0.0050). (F) SFRP5 negatively correlated with Young’s modulus (MPa); (r=−0.4442; p=0.0437). (G) WNT10B positively correlated with ultimate strength (MPa); (r=0.5392; p=0.0054). (H) AXIN2 negatively correlated with ultimate strength (MPa); (r=−0.4180; p=0.0472). (I) BETA-CATENIN negatively correlated with ultimate strength (MPa); (r=−0.5528; p=0.0034). (J) LEF-1 positively correlated with yield strength (MPa); (r=0.4338; p=0.0495). (K) WNT10B positively correlated with yield strength (MPa); (r=0.6632; p=0.0020). (L) GSK3B negatively correlated with yield strength (MPa); (r=−0.4674; p=0.0245). (M) AXIN2 negatively correlated with yield strength (MPa); (r=−0.5067; p=0.0319). (N) BETA-CATENIN negatively correlated with yield strength (MPa); (r=−0.5491; p=0.0149). (O) SFRP5 negatively correlated with yield strength (MPa); (r=−0.5357; p=0.0422). Data were analyzed using nonparametric Spearman correlation analysis and r represents the correlation coefficient.
Figure 4—figure supplement 1.
Figure 4—figure supplement 1.. Relationship between Young’s modulus (MPa), ultimate strength (MPa), and yield strength (MPa) with mRNA levels of the Wnt signaling genes in type 2 diabetes (T2D) and non-diabetic subjects.
(A) DKK-1 positively correlated with Young’s modulus (MPa); (r=0.02857; p=0.9022). (B) COL1A1 positively correlated with Young’s modulus (MPa); (r=0.2991; p=0.1397). (C) GSK3B negatively correlated with Young’s modulus (MPa); (r=0.3127; p=0.0814). (D) SOST negatively correlated with ultimate strength (MPa); (r=-0.1468; p=0.4001). (E) DKK-1 negatively correlated with ultimate strength (MPa); (r=0.1353; p=0.5694). (F) LEF-1 positively correlated with ultimate strength (MPa); (r=0.2790; p=0.1588). (G) WNT5A negatively correlated with ultimate strength (MPa); (r=-0.0143; p=0.9469). (H) COL1A1 positively correlated with ultimate strength (MPa); (r=0.2138; p=0.3047). (I) GSK3B negatively correlated with ultimate strength (MPa); (r=-0.3482; p=0.0594). (J) SFPR5 negatively correlated with ultimate strength (MPa); (r=-0.3789; p=0.0994). (K) SOST positively correlated with yield strength (MPa); (r=0.1009; p=0.6390). (L) DKK-1 positively correlated with yield strength (MPa); (r=0.2786; p=0.3139). (M) WNT10B negatively correlated with yield strength (MPa); (r=–0.0079; p=0.9744). (N) COL1A1 positively correlated with yield strength (MPa); (r=0.2196; p=0.3260). (O) BETA-CATENIN negatively correlated with Young’s modulus strength (MPa); (r=–0.1667; p=0.4953). (P) BETA-CATENIN negatively correlated with ultimate strength (MPa); (r=–0.2797; p=0.2610). (Q) BETA-CATENIN negatively correlated with yield strength (MPa); (r=–0.1813; p=0.5537). Data were analyzed using nonparametric Spearman correlation analysis and r represents the correlation coefficient.
Figure 5.
Figure 5.. A graphical summary of the study.
Author response image 1.

Update of

  • doi: 10.1101/2023.10.06.23296647
  • doi: 10.7554/eLife.90437.1
  • doi: 10.7554/eLife.90437.2

References

    1. Andrade VFC, Chula DC, Sabbag FP, da Cavalheiro DS, Bavia L, Ambrósio AR, da Costa CRV, Dos Reis LM, Borba VZC, Moreira CA. Bone histomorphometry in young patients with type 2 diabetes is affected by disease control and chronic complications. The Journal of Clinical Endocrinology and Metabolism. 2020;105:dgz070. doi: 10.1210/clinem/dgz070. - DOI - PubMed
    1. Bennett CN, Longo KA, Wright WS, Suva LJ, Lane TF, Hankenson KD, MacDougald OA. Regulation of osteoblastogenesis and bone mass by Wnt10b. PNAS. 2005;102:3324–3329. doi: 10.1073/pnas.0408742102. - DOI - PMC - PubMed
    1. Chen Y, Chen L, Huang R, Yang W, Chen S, Lin K, Liu J. Investigation for GSK3β expression in diabetic osteoporosis and negative osteogenic effects of GSK3β on bone marrow mesenchymal stem cells under a high glucose microenvironment. Biochemical and Biophysical Research Communications. 2021;534:727–733. doi: 10.1016/j.bbrc.2020.11.010. - DOI - PubMed
    1. Dejmek J, Säfholm A, Kamp Nielsen C, Andersson T, Leandersson K. Wnt-5a/Ca2+-induced NFAT activity is counteracted by Wnt-5a/Yes-Cdc42-casein kinase 1alpha signaling in human mammary epithelial cells. Molecular and Cellular Biology. 2006;26:6024–6036. doi: 10.1128/MCB.02354-05. - DOI - PMC - PubMed
    1. Farr JN, Drake MT, Amin S, Melton LJ, McCready LK, Khosla S. In vivo assessment of bone quality in postmenopausal women with type 2 diabetes. Journal of Bone and Mineral Research. 2014;29:787–795. doi: 10.1002/jbmr.2106. - DOI - PMC - PubMed