. 2024 Jun 1;35(6):ar80.
doi: 10.1091/mbc.E24-01-0025. Epub 2024 Apr 10.

WHAMM functions in kidney reabsorption and polymerizes actin to promote autophagosomal membrane closure and cargo sequestration

Affiliations

WHAMM functions in kidney reabsorption and polymerizes actin to promote autophagosomal membrane closure and cargo sequestration

Alyssa M Coulter et al. Mol Biol Cell. .

Abstract

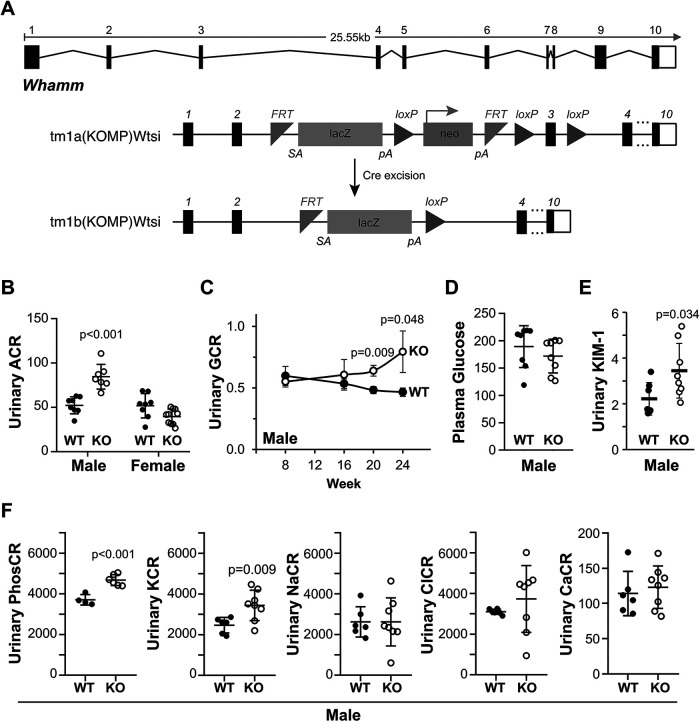
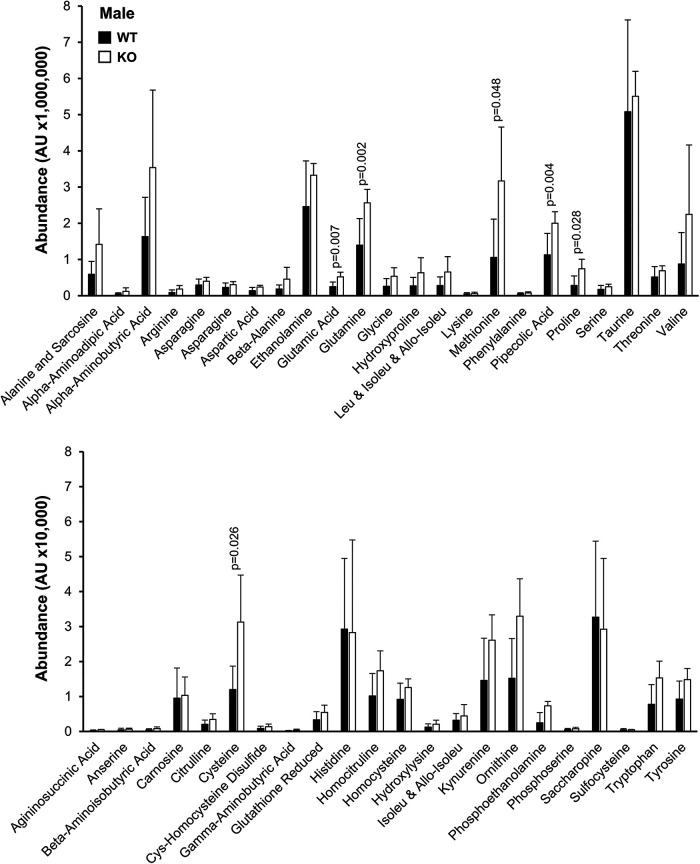
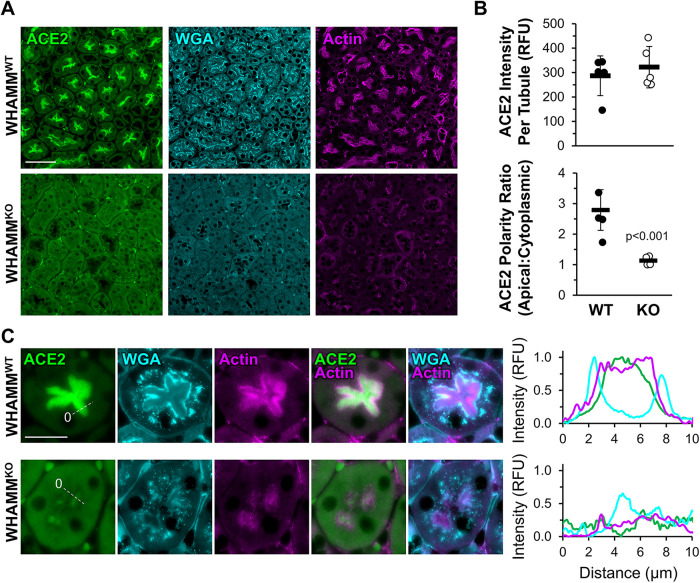
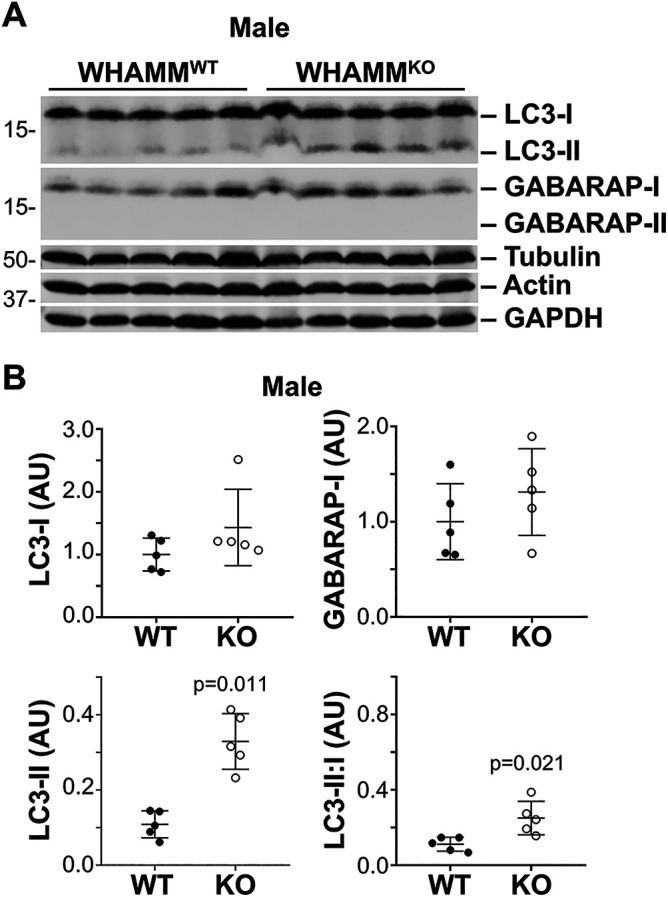
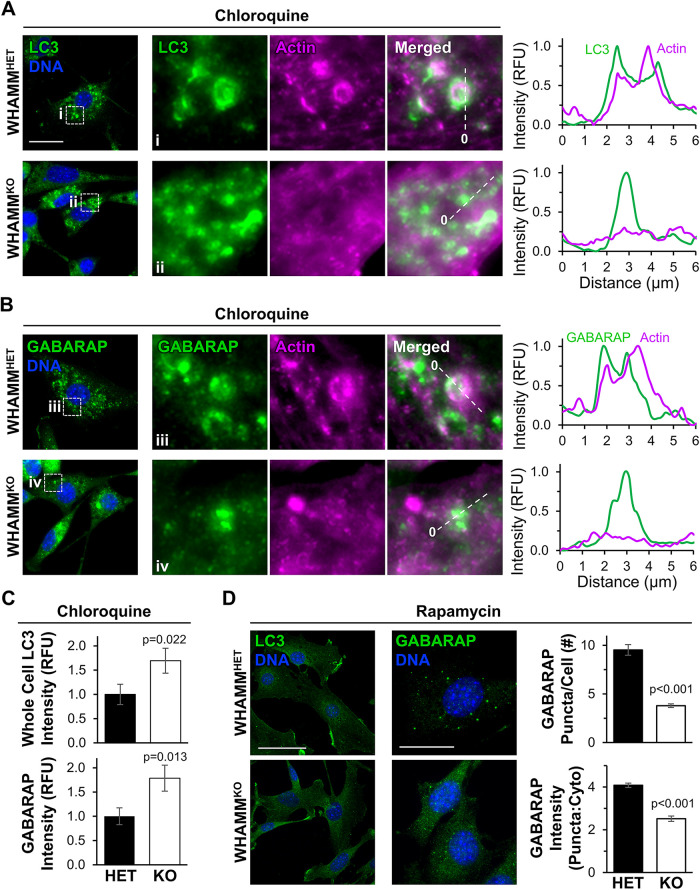
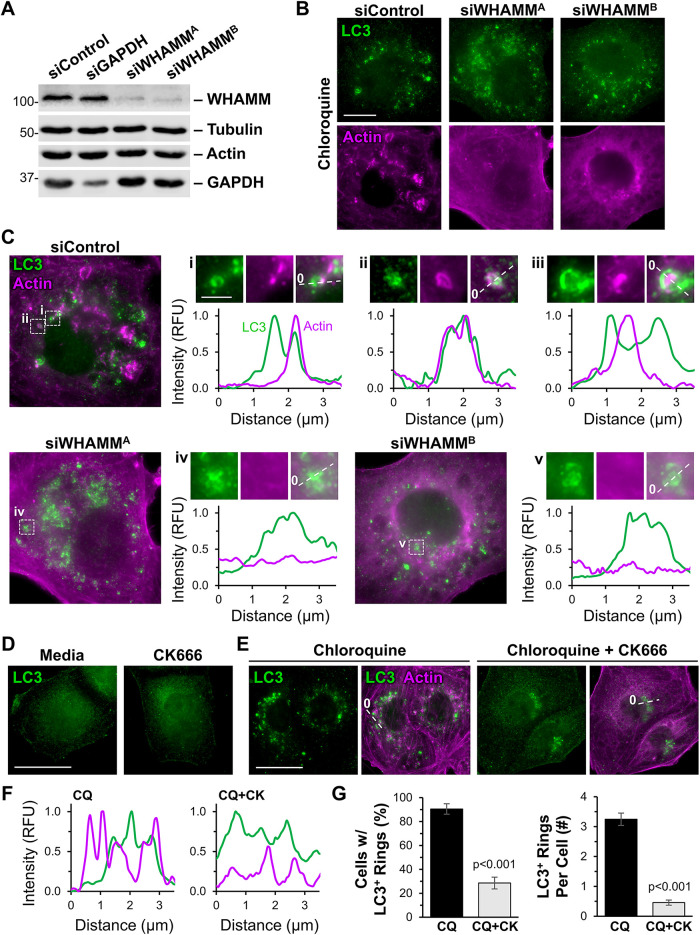
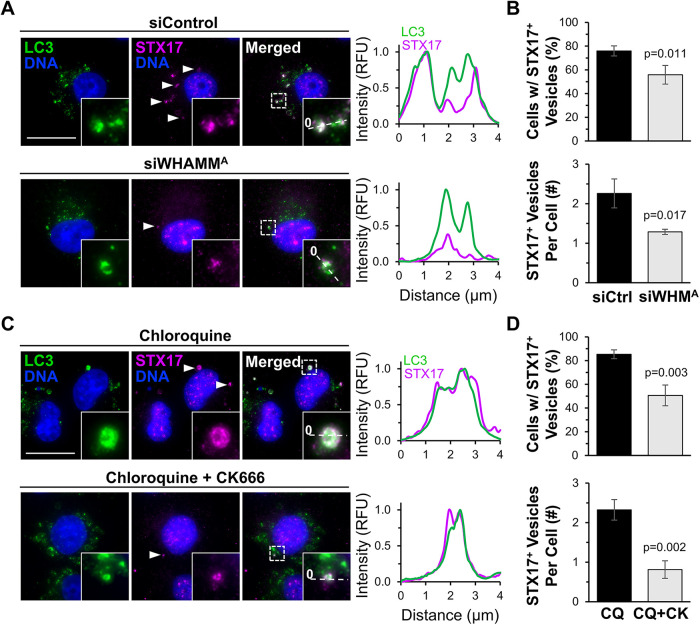
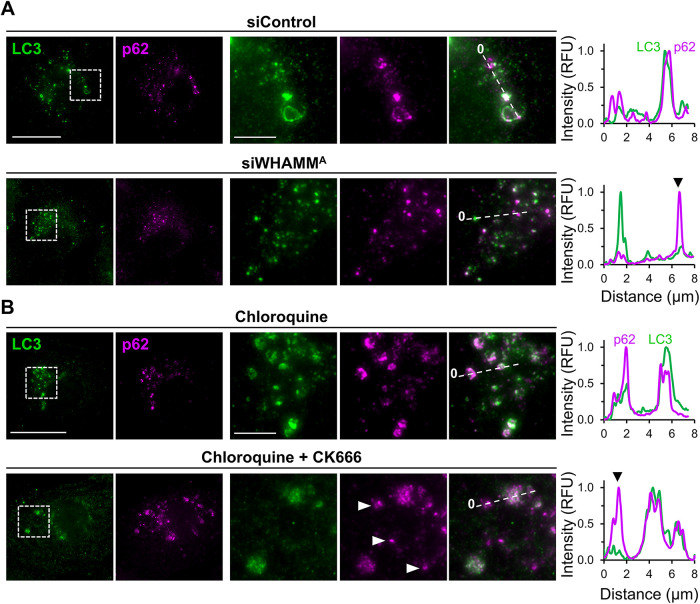
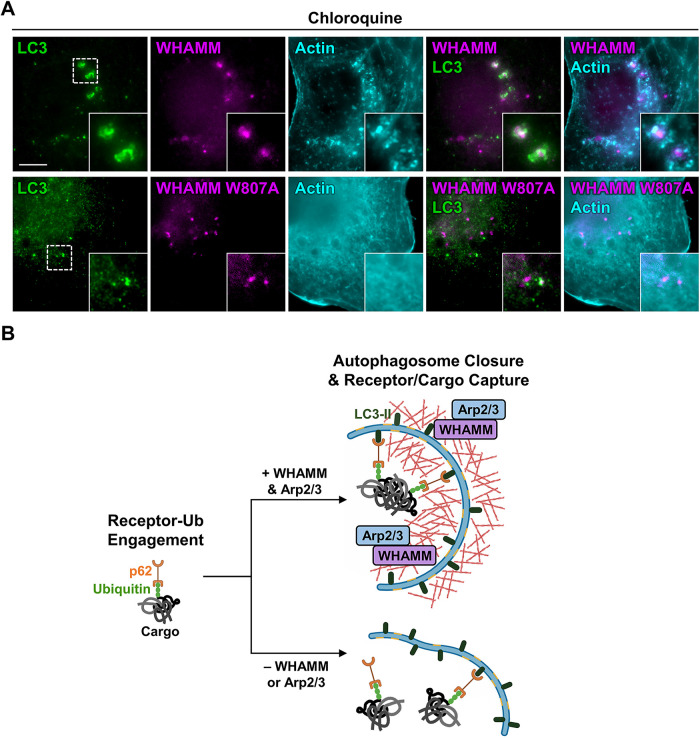
The actin cytoskeleton is essential for many functions of eukaryotic cells, but the factors that nucleate actin assembly are not well understood at the organismal level or in the context of disease. To explore the function of the actin nucleation factor WHAMM in mice, we examined how Whamm inactivation impacts kidney physiology and cellular proteostasis. We show that male WHAMM knockout mice excrete elevated levels of albumin, glucose, phosphate, and amino acids, and display structural abnormalities of the kidney proximal tubule, suggesting that WHAMM activity is important for nutrient reabsorption. In kidney tissue, the loss of WHAMM results in the accumulation of the lipidated autophagosomal membrane protein LC3, indicating an alteration in autophagy. In mouse fibroblasts and human proximal tubule cells, WHAMM and its binding partner the Arp2/3 complex control autophagic membrane closure and cargo receptor recruitment. These results reveal a role for WHAMM-mediated actin assembly in maintaining kidney function and promoting proper autophagosome membrane remodeling.


Figures

FIGURE 1:
FIGURE 1:
Male WHAMMKO mice excrete elevated levels of albumin, glucose, KIM-1, phosphate, and potassium in their urine. (A) The mouse Whamm gene is 25kb in length and contains 10 exons. A floxed allele containing IRES-lacZ and neo cassettes between exons 2 and 3, as well as loxP sites between the cassettes and flanking exon 3 was generated. Cre-mediated recombination created a knockout allele. Internal ribosome entry site (IRES); splice acceptor (SA); polyadenylation (pA); flippase recombination target (FRT). (B) Urine samples were collected from male and female wild type (WT; filled circles) or WHAMM knockout (KO; open circles) mice at 24 wk-of-age and subjected to urinalysis. Urinary albumin-to-creatinine (ACR) ratios are plotted. Each circle represents one mouse. Statistical bars display the mean ± SD from n = 7–10 mice. (C) Urinary glucose-to-creatinine (GCR) ratios for males from 8 to 24 wk-of-age are plotted. Each point represents the mean ± SE from n = 6–9 mice per genotype for each timepoint. (D) Plasma GCR for males at 24 wk-of-age are plotted. Statistical bars display the mean ±SD from n = 8 mice. (E) Urinary KIM-1 levels (ng/ml) from male mice at 16 wk are plotted. Each circle represents one mouse. Statistical bars display the mean ± SD from n = 7–8 mice. (F) Urinary phosphate (PhosCR), potassium (KCR), sodium (NaCR), chloride (ClCR), and calcium (CaCR) to creatinine ratios are plotted. Each circle represents one male mouse at 24 wk. Statistical bars display the mean ± SD from n = 4–8 mice. Significant p values are noted (unpaired t tests).
FIGURE 2:
FIGURE 2:
Male WHAMMKO mice excrete elevated levels of amino acids in their urine. Urine samples were collected from male wild type (WT; black bars) or WHAMM knockout (KO; white bars) mice at 24 wk-of-age, and urinary amino acids were measured using mass spectrometry. AU = arbitrary units. Each bar represents the mean ± SD from n = 5–6 mice. Significant p values are noted (ANOVA).
FIGURE 3:
FIGURE 3:
Polarized ACE2, WGA, and actin staining in the kidney proximal tubule is reduced in male WHAMMKO mice. (A) Kidney tissue sections from wild type (WHAMMWT) or WHAMM knockout (WHAMMKO) male mice were stained with ACE2 antibodies (green), WGA (cyan), and actin antibodies (magenta). Scale bar, 50 µm. (B) The ACE2 fluorescence intensity per tubule was calculated in ImageJ. Each circle represents the average ACE2 kidney staining from an individual mouse in which ∼ 75 tubules were examined. Statistical bars represent the mean ± SD from n = 5 mice. The ACE2 polarity ratio was calculated in ImageJ by dividing the fluorescence intensity in an apical region of the tubule by the intensity in a cytoplasmic region. Each circle represents the average ratio from an individual mouse in which 40 tubules were examined. Statistical bars represent the mean ± SD from n = 4 mice. (C) Kidney tissue sections from (A) were used to generate pixel intensity profiles. Lines were drawn through the center of the tubule, and the ACE2, WGA, and actin intensities along the line were plotted. The origin of each line is indicated with a zero. Plotted points represent the normalized mean fluorescence. RFU = relative fluorescence units. Significant p values are noted (unpaired t tests).
FIGURE 4:
FIGURE 4:
The lipidated form of the autophagosomal protein LC3 is more abundant in male WHAMMKO kidneys. (A) Kidneys were harvested from five male WHAMMWT and five male WHAMMKO mice. Fifty-microgram extract samples were subjected to SDS–PAGE and immunoblotted with antibodies to LC3, GABARAP, tubulin, actin, and GAPDH. (B) LC3 and GABARAP band intensities in (A) were quantified relative to tubulin, actin, and GAPDH, and the mean normalized values were plotted. The LC3-II:I ratio was calculated by dividing the LC3-II band intensity by the LC3-I band intensity within each nonnormalized sample. Statistical bars represent the mean ± SD from n = 5 mice. Significant p values are noted (unpaired t tests).
FIGURE 5:
FIGURE 5:
Autophagosome organization and actin recruitment are altered in WHAMM-deficient fibroblasts. (A and B) Male heterozygous (WHAMMHET) and WHAMM knockout (WHAMMKO) MEFs were treated with chloroquine for 16 h before being fixed and stained with LC3 antibodies (green), an actin antibody (magenta), and DAPI (DNA; blue). Scale bar, 25 µm. Magnifications highlight areas of (i, iii) actin recruitment to LC3- or GABARAP-positive structures in WHAMMHET cells and (ii, iv) a lack of actin enrichment at autophagosomal puncta in WHAMMKO cells. Lines were drawn through the images to measure pixel intensity profiles. The origin of each line is indicated with a zero. (C) Mean LC3 and GABARAP fluorescence values per cell were measured in ImageJ. Each bar represents the mean ± SD from n = 3 experiments (145–161 cells per bar). (D) WHAMMHET and WHAMMKO MEFs were treated with rapamycin for 16 h before being fixed and stained with LC3 or GABARAP antibodies (green) and DAPI (DNA; blue). Scale bars, 50 µm, 25 µm. The number (#) of GABARAP puncta per cell was counted manually. Each bar represents the mean ± SD from n = 3 experiments (30 cells per genotype per experiment). To calculate the puncta:cytoplasmic ratio of GABARAP fluorescence intensities, the mean fluorescence of GABARAP puncta was divided by the mean cytoplasmic GABARAP fluorescence in ImageJ. Each bar represents the mean ± SD from n = 3 experiments (four to seven puncta per cell; six to eight cells per genotype per experiment). Significant p values are noted (unpaired t tests).
FIGURE 6:
FIGURE 6:
WHAMM depletion or Arp2/3 complex inhibition disrupts LC3 and actin organization in proximal tubule cells. (A) Human kidney proximal tubule (HK-2) cells were transfected with control siRNAs, GAPDH siRNAs, or independent siRNAs targeting the WHAMM transcript before immunoblotting with antibodies to WHAMM, tubulin, actin, and GAPDH. (B) Transfected HK-2 cells were exposed to media containing chloroquine for 6 h before being fixed and stained with antibodies to LC3 (green) and actin (magenta). Scale bar, 10 µm. (C) Lines were drawn through the magnified images from (B) to measure pixel intensity profiles. Magnifications highlight areas of (i–iii) actin recruitment to LC3-positive structures in siControl cells and (iv–v) a lack of actin enrichment at autophagosomal puncta in siWHAMM cells. The parent image for (iii) is shown in Supplemental Figure S12. Scale bar, 2 µm. (D) HK-2 cells were treated with normal media or media containing CK666 for 6 h before being fixed and stained with LC3 antibodies. (E) Cells were treated with chloroquine, or chloroquine plus CK666 for 6 h before being fixed and stained with antibodies to LC3 (green) and actin (magenta). (F) Lines were drawn through the images in (E) to measure pixel intensity profiles. (G) The percentage (%) of cells with LC3-positive rings and the # of LC3-positive rings per cell were quantified. Each bar represents the mean ± SD from n = 3 experiments (150 cells per bar). Significant p values are noted (unpaired t tests).
FIGURE 7:
FIGURE 7:
WHAMM and the Arp2/3 complex are crucial for autophagosome closure. (A) HK-2 cells transfected with control siRNAs or siRNAs targeting WHAMM were treated with chloroquine for 6 h before being fixed and stained with STX17 antibodies (magenta), an LC3B antibody (green), and DAPI (DNA; blue). Arrowheads highlight STX17-positive vesicles. Lines were drawn through the magnified images to measure pixel intensity profiles. (B) The percentage of cells with STX17-positive vesicles and the # of STX17-positive vesicles per cell were quantified. Each bar represents the mean ± SD from n = 3 experiments (104–108 cells per bar). (C) HK-2 cells were treated with chloroquine, or chloroquine plus CK666 for 6 h before being fixed, stained, and analyzed as above. (D) The percentage of cells with STX17-positive vesicles and the # of STX17-positive vesicles per cell were quantified. Each bar represents the mean ± SD from n = 3 experiments (230 cells per bar). Significant p values are noted (unpaired t tests). Scale bars, 20 µm.
FIGURE 8:
FIGURE 8:
WHAMM and the Arp2/3 complex are important for cargo receptor recruitment to LC3-associated membranes. (A) HK-2 cells transfected with control siRNAs or siRNAs targeting WHAMM were treated with chloroquine for 6 h before being fixed and stained with antibodies to LC3 (green) and p62 (magenta). Arrowheads highlight LC3-independent p62 structures. Lines were drawn through the magnified images to measure pixel intensity profiles. (B) HK-2 cells were treated with media containing chloroquine or chloroquine plus CK666 for 6 h before being fixed, stained, and analyzed as above. Lines were drawn through the magnified images to measure pixel intensity profiles. Scale bars, 20 µm, 5 µm.
FIGURE 9:
FIGURE 9:
WHAMM promotes Arp2/3 complex-mediated actin assembly during autophagosomal membrane morphogenesis. (A) HK-2 cells expressing LAP-WHAMM wild type or a LAP-WHAMM W807A mutant deficient in Arp2/3 activation (both in magenta) were fixed and stained with antibodies to LC3 (green) and actin (cyan). Scale bar, 10 µm. (B) Model for WHAMM and Arp2/3 complex function in autophagosome closure during cargo/receptor capture. Aggregated protein cargo (gray) is ubiquitinated (green) before its engagement by autophagy receptors like p62 (orange). WHAMM (purple) and the Arp2/3 complex (blue) promote the assembly of actin filaments (red) necessary for autophagosome membrane morphogenesis. In the absence of WHAMM or the Arp2/3 complex, actin assembly at autophagic membranes is abrogated, resulting in inefficient receptor recruitment to LC3 and incomplete autophagosome closure.

Update of

Similar articles

Cited by

References

    1. Alekhina O, Burstein E, Billadeau DD (2017). Cellular functions of WASP family proteins at a glance. J Cell Sci 130, 2235–2241. - PMC - PubMed
    1. Arrondel C, Missoury S, Snoek R, Patat J, Menara G, Collinet B, Liger D, Durand D, Gribouval O, Boyer O, et al. (2019). Defects in t(6)A tRNA modification due to GON7 and YRDC mutations lead to Galloway-Mowat syndrome. Nat Commun 10, 3967. - PMC - PubMed
    1. Axe EL, Walker SA, Manifava M, Chandra P, Roderick HL, Habermann A, Griffiths G, Ktistakis NT (2008). Autophagosome formation from membrane compartments enriched in phosphatidylinositol 3-phosphate and dynamically connected to the endoplasmic reticulum. J Cell Biol 182, 685–701. - PMC - PubMed
    1. Ballabio A, Bonifacino JS (2020). Lysosomes as dynamic regulators of cell and organismal homeostasis. Nat Rev Mol Cell Biol 21, 101–118. - PubMed
    1. Ben-Omran T, Fahiminiya S, Sorfazlian N, Almuriekhi M, Nawaz Z, Nadaf J, Khadija KA, Zaineddin S, Kamel H, Majewski J, et al. (2015). Nonsense mutation in the WDR73 gene is associated with Galloway-Mowat syndrome. J Med Genet 52, 381–390. - PubMed

Publication types

LinkOut - more resources