. 2024 Jun 1;35(6):ar79.
doi: 10.1091/mbc.E24-01-0044. Epub 2024 Apr 10.

Bacterial growth dynamics in a rhythmic symbiosis

Affiliations

Bacterial growth dynamics in a rhythmic symbiosis

Liu Yang et al. Mol Biol Cell. .

Abstract

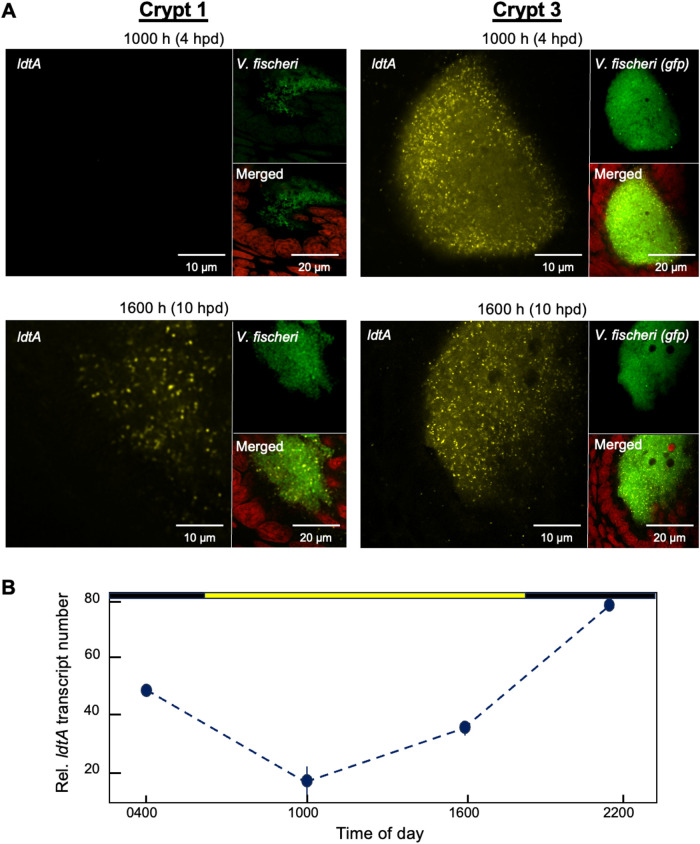
The symbiotic relationship between the bioluminescent bacterium Vibrio fischeri and the bobtail squid Euprymna scolopes serves as a valuable system to investigate bacterial growth and peptidoglycan (PG) synthesis within animal tissues. To better understand the growth dynamics of V. fischeri in the crypts of the light-emitting organ of its juvenile host, we showed that, after the daily dawn-triggered expulsion of most of the population, the remaining symbionts rapidly proliferate for ∼6 h. At that point the population enters a period of extremely slow growth that continues throughout the night until the next dawn. Further, we found that PG synthesis by the symbionts decreases as they enter the slow-growing stage. Surprisingly, in contrast to the most mature crypts (i.e., Crypt 1) of juvenile animals, most of the symbiont cells in the least mature crypts (i.e., Crypt 3) were not expelled and, instead, remained in the slow-growing state throughout the day, with almost no cell division. Consistent with this observation, the expression of the gene encoding the PG-remodeling enzyme, L,D-transpeptidase (LdtA), was greatest during the slowly growing stage of Crypt 1 but, in contrast, remained continuously high in Crypt 3. Finally, deletion of the ldtA gene resulted in a symbiont that grew and survived normally in culture, but was increasingly defective in competing against its parent strain in the crypts. This result suggests that remodeling of the PG to generate additional 3-3 linkages contributes to the bacterium's fitness in the symbiosis, possibly in response to stresses encountered during the very slow-growing stage.


Figures

FIGURE 1:
FIGURE 1:
Initial colonization and the subsequent daily cycle of the V. fischeri symbiont populations. (A) Cartoon depicting the interior and exterior of the bilobed light organ of E. scolopes. Planktonic V. fischeri cells enter one of three pores on the external surface of both sides of the organ. Each pore leads to an independent epithelium-lined region (Crypt 1, 2, or 3) in which the symbionts grow and induce bioluminescence. In the cartoon, the crypts can be distinguished from the more distil antechamber regions by their darker color. (B) The number of colony-forming units (CFUs) in the light organ reflects the dawn-cued expulsion of most of the symbionts, followed by a rapid regrowth phase and a transition into a slow-growth, slow-growing phase (indicated by the bottom gradient bar). The black circles (and red lines) represent the mean CFUs (and the standard deviation; SD); N = 30 light organs from three individual clutches for each of 11 sampling points. Each clutch was treated as an independent experimental trial. A Shapiro-Wilk test was used to confirm that the data distribution adhered to a normal distribution. In addition, a one-way ANOVA was used to show no significant differences between the clutches for the data shown in Supplemental Figure S1B. A paired t test on log-transformed values of CFU/light organ measured between 1 hpd and 3 hpd demonstrated a statistically significant decrease, with a p value of 1.3 × 10⁻¹³. Subsequent analysis of the CFU/light organ during the period between 3 and 6 hpd, applying a linear regression on log-transformed data, indicated a growth rate corresponding to a doubling time of 1.9 h, with an R2 = 0.81, underscoring the model’s efficacy in capturing the temporal dynamics of growth. (C) MFA diagrams indicating the number of copies of each gene along the length of the large (red) and small (blue) chromosomes of V. fischeri at three different ODs during an LBS-culture growth curve. The enrichment in the relative number of copies of genes located at the chromosomal origin (apex) decreases as the growth rate slows. (C’) MFA data obtained from symbionts removed at 2, 6, 10, and 14 h post dawn (hpd). While the limited number of symbiont cells that could be collected from the juvenile light organs limited the precision of these measurements, the MFA patterns indicate that the population has a reduced growth rate at 10 and 14 hpd relative to that during regrowth (i.e., at 2 hpd).
FIGURE 2:
FIGURE 2:
Activity of the V. fischeri cell division machinery decreases as the cells transition into stationary phase. (A) Representative phase micrographs showing the midcell position of the cell-division protein ZapA (ZapA-mCherry; red). Quantitative analyses of the ZapA-mCherry fluorescence localization, shown as demographs, at two OD values of a wild-type V. fischeri strain ES114 culture. The demograph is used to illustrate the fluorescence profiles of the population using a randomly chosen set of cells, where single-cell fluorescence profiles are sorted by cell length and stacked to generate the graph. The middle of the cells is indicated by a white dashed line. Scale bar = 2 µm. (B) ZapA-mCherry colocalizes with sites of new PG synthesis; Left, representative images of V. fischeri ZapA-mCherry cells at OD 0.5 that were briefly labeled with 1 mM HADA (cyan). Scale bar = 2 µm; Right, the fluorescence signal of HADA (cyan) and ZapA-mCherry (red) in each individual cell was quantitatively analyzed and their colocalization demonstrated in a demograph.
FIGURE 3:
FIGURE 3:
HADA-labeling patterns vary at different culture densities in V. fischeri. (A) Short-term HADA labeling of strain ES114. Left, representative phase micrographs of cells from cultures at two OD values that were fluorescently labeled with 0.5 mM HADA (cyan). Scale bar = 2 μm. Right, demographs quantifying the cellular location of HADA labeling in V. fischeri cells from the culture imaged on the left. The middle of the cells is indicated by a white dashed line. (B) Quantification of the average fluorescence intensity in cells that were pulse-labeled with HADA at different OD values. The fluorescence intensity at each OD was distinguished using distinct colors in the scatter plot, with each dot representing an individual cell. The red circle represents the mean fluorescence intensity at each OD, while the red line represents ± one SD; N = 80 for all points. The blue line shows the fitted curve. (C) Size (approximated by cross-sectional area) of V. fischeri cells from a culture at different OD values; the red circle indicates the mean and the red line indicates ± one SD; N = 80 for all points. The blue line shows the fitted curve.
FIGURE 4:
FIGURE 4:
Time-lapse analysis of individual V. fischeri cells taken from an LBS culture at two ODs. The cells were uniformly labeled with 1 mM HADA (cyan), followed by washing, transferring to glass slides, and mounting on pads saturated with LBS containing 1.5% agarose, without additional HADA label. Imaging of the cells was performed at 3-min intervals for a period of 33 min.
FIGURE 5:
FIGURE 5:
The dynamics of PG synthesis by V. fischeri symbionts at two times during the light organ’s daily cycle. (A, A’) Fluorescence microscopy images of symbiont-colonized crypts at two times after the dawn light cue (hpd = hours post dawn). Samples were treated at the indicated times with HADA (cyan) for 1 h to localize its incorporation into PG. Cell nuclei were counterstained using TO-PRO-3 (red). Insets provide a higher magnification of the bacterial cells indicated by arrows (a-h); white arrows point to bacteria adjacent to host cells, while yellow arrows indicate bacteria distant from host cells. (B) Analysis of per-cell fluorescence intensity of V. fischeri symbionts within Crypt 1, derived from images in panel (A) and Supplemental Figure S5. Data were collected at five different times in the diel cycle. (C) Analysis of per-cell fluorescence intensity of V. fischeri symbionts within Crypts 1 or 3 at two time points, as a function of their proximity to host cells lining the crypts. Data collection was limited to time points when the crypts were fully colonized (Crypt 1 was excluded from consideration at 4 hpd because it was not recolonized by this time). Each point denotes an individual biological replicate. TO-PRO-3 staining was used to segment bacterial cell nuclei, with the stain’s brightness adjusted to exclusively highlight the host cells. The black lines indicate the mean and the SD. Statistical significance was assessed using Mann-Whitney U tests, where **** denotes P < 0.0001, and “ns” indicates not significantly different.
FIGURE 6:
FIGURE 6:
Expression of V. fischeri ldtA in the light organ, depending on time and crypt. (A) Transcripts of ldtA (gold) were localized in juvenile light-organ crypts using HCR of GFP-labeled V. fischeri (green). Expression of ldtA by V. fischeri within Crypts 1 or 3, was determined at either 4 or 10 h post dawn (hpd). Nuclei of the crypt epithelia were stained with TO-PRO-3 (red). (B) The relative number of ldtA transcripts in the entire symbiont population (normalized to total mRNA) over a daily cycle of expulsion and regrowth, as measured by NanoString nCounter analysis.
FIGURE 7:
FIGURE 7:
Competitive colonization dynamics in E. scolopes between V. fischeri wild-type and ΔldtA mutant strains. Hatchling squid were exposed to a concentration of 4 × 10³ CFU/mL a 1:1 mixture of either: (i) the ΔldtA mutant tagged with an RFP-encoding plasmid (pVSV208), and unmarked wild-type V. fischeri (solid circles); or, (ii) the unmarked ΔldtA mutant, and wild type tagged with the RFP-encoding plasmid (open circles). Postinoculation, the squid were rinsed daily in fresh V. fischeri-free seawater, and the persistence of their symbiosis assessed by determining their luminescence. (A) RCI was determined as described in the Materials and Methods. Each point reflects the RCI obtained from a single juvenile. (B) Relative luminescence units (RLU) per CFU were used to quantify the bioluminescence from squid light organs colonized by the mixed population of wild-type and ΔldtA strains. Each data point corresponds to an individual squid. Error bars signify ± the SD.

References

    1. Adin DM, Engle JT, Goldman WE, McFall-Ngai MJ, Stabb EV (2009). Mutations in ampG and lytic transglycosylase genes affect the net release of peptidoglycan monomers from Vibrio fischeri. J Bacteriol 191, 2012–2022. - PMC - PubMed
    1. Alvarez L, Hernandez SB, Cava F (2021). Cell wall biology of Vibrio cholerae. Annu Rev Microbiol 75, 151–174. - PubMed
    1. Aschtgen MS, Wetzel K, Goldman W, McFall-Ngai M, Ruby E (2016). Vibrio fischeri-derived outer membrane vesicles trigger host development. Cellul Microbiol 18, 488–499. - PMC - PubMed
    1. Azimi S, Klementiev AD, Whiteley M, Diggle SP (2020). Bacterial quorum sensing during infection. Annu Rev Microbiol 74, 201–219. - PubMed
    1. Bennett BD, Essock-Burns T, Ruby EG (2020). HbtR, a heterofunctional homolog of the virulence regulator TcpP, facilitates the transition between symbiotic and planktonic lifestyles in Vibrio fischeri. mBio 11, e01624-20. - PMC - PubMed

Publication types

MeSH terms

LinkOut - more resources