. 2024 Apr;132(4):47005.
doi: 10.1289/EHP13435. Epub 2024 Apr 10.

In Vivo Tissue Distribution of Polystyrene or Mixed Polymer Microspheres and Metabolomic Analysis after Oral Exposure in Mice

Affiliations

In Vivo Tissue Distribution of Polystyrene or Mixed Polymer Microspheres and Metabolomic Analysis after Oral Exposure in Mice

Marcus M Garcia et al. Environ Health Perspect. 2024 Apr.

Abstract

Background: Global plastic use has consistently increased over the past century with several different types of plastics now being produced. Much of these plastics end up in oceans or landfills leading to a substantial accumulation of plastics in the environment. Plastic debris slowly degrades into microplastics (MPs) that can ultimately be inhaled or ingested by both animals and humans. A growing body of evidence indicates that MPs can cross the gut barrier and enter into the lymphatic and systemic circulation leading to accumulation in tissues such as the lungs, liver, kidney, and brain. The impacts of mixed MPs exposure on tissue function through metabolism remains largely unexplored.

Objectives: This study aims to investigate the impacts of polymer microspheres on tissue metabolism in mice by assessing the microspheres ability to translocate across the gut barrier and enter into systemic circulation. Specifically, we wanted to examine microsphere accumulation in different organ systems, identify concentration-dependent metabolic changes, and evaluate the effects of mixed microsphere exposures on health outcomes.

Methods: To investigate the impact of ingested microspheres on target metabolic pathways, mice were exposed to either polystyrene (5μm) microspheres or a mixture of polymer microspheres consisting of polystyrene (5μm), polyethylene (1-4μm), and the biodegradability and biocompatible plastic, poly-(lactic-co-glycolic acid) (5μm). Exposures were performed twice a week for 4 weeks at a concentration of either 0, 2, or 4mg/week via oral gastric gavage. Tissues were collected to examine microsphere ingress and changes in metabolites.

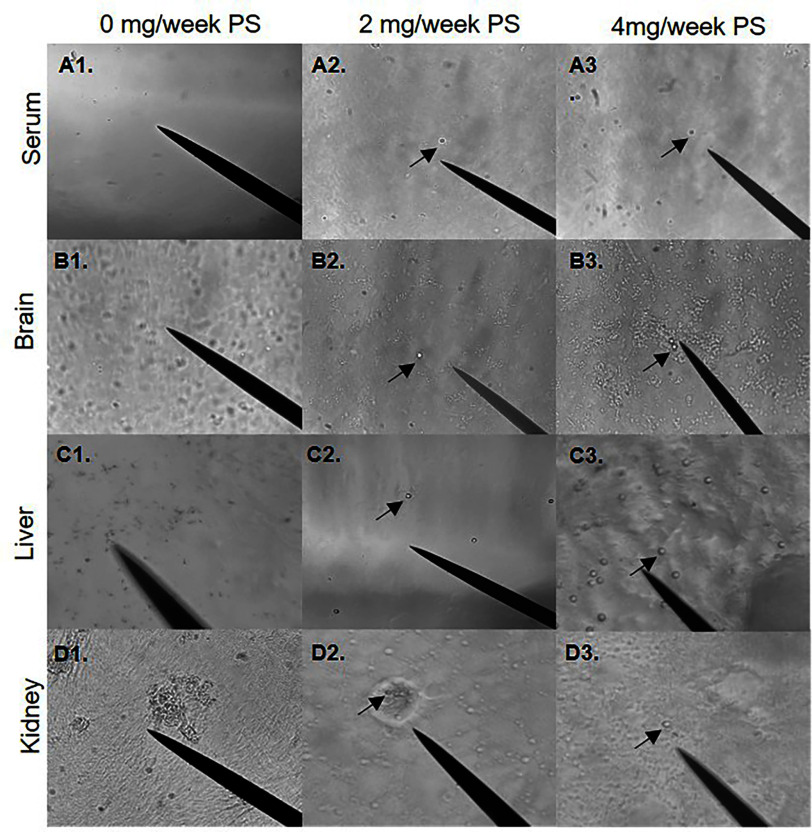
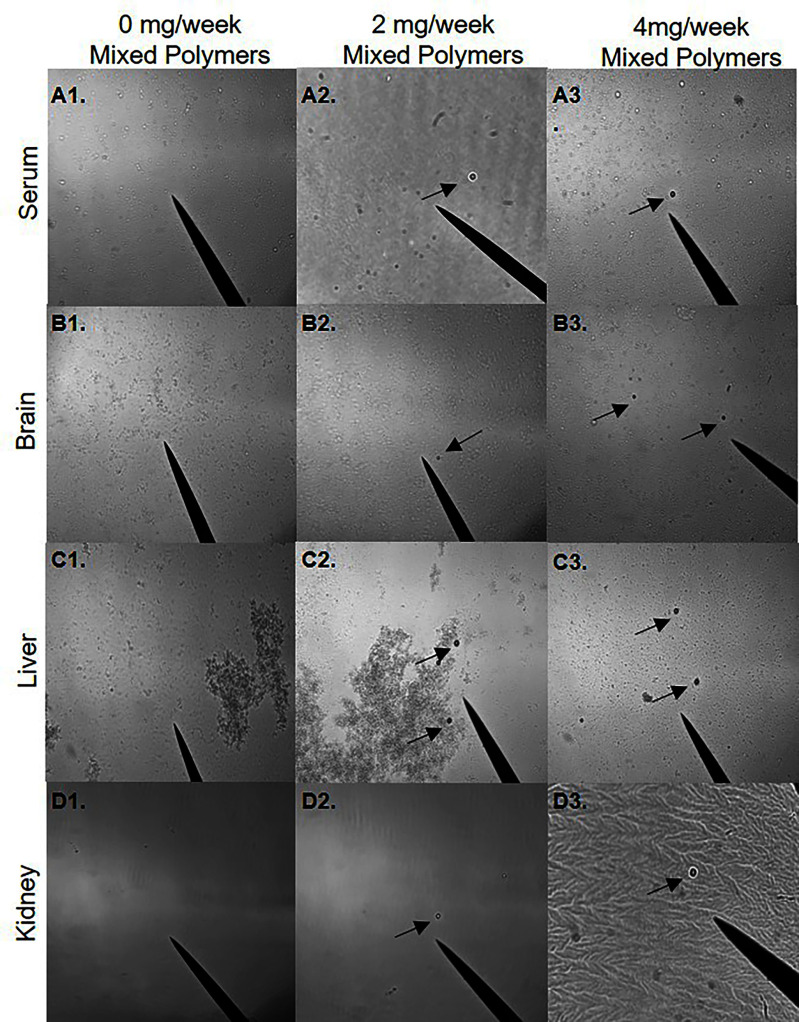
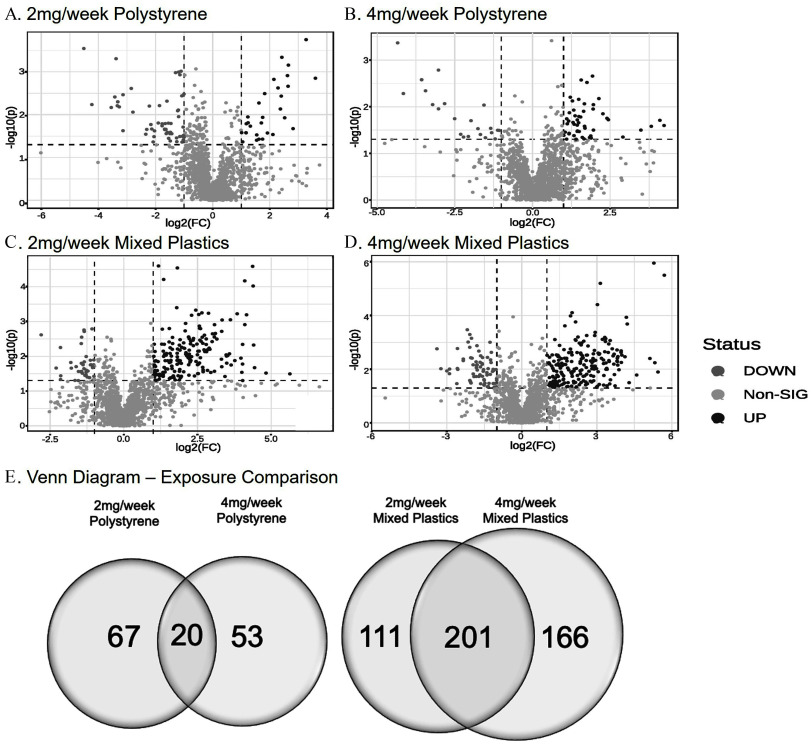
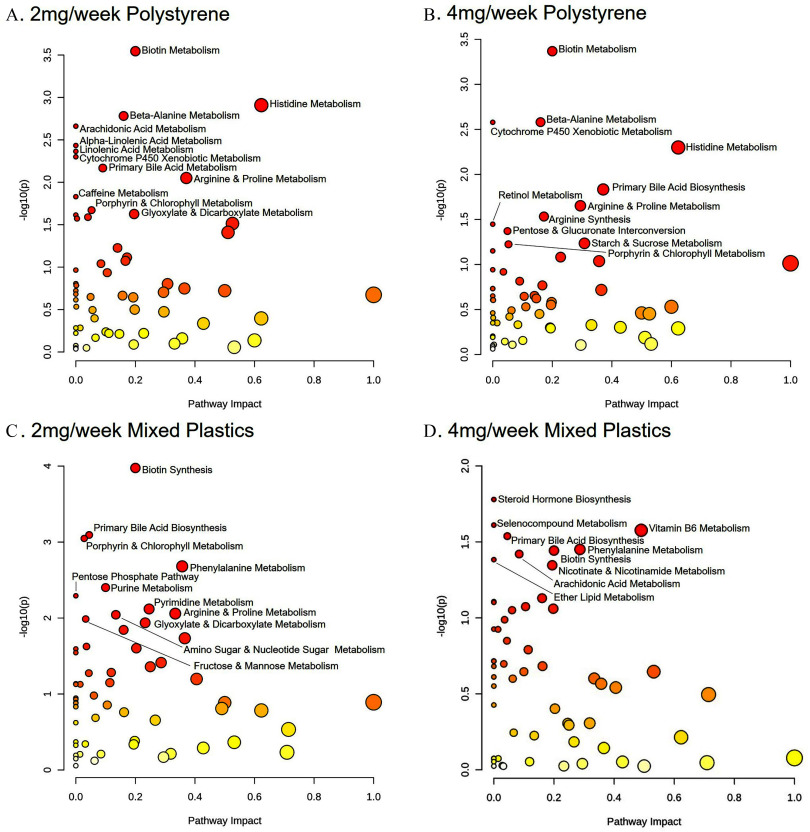
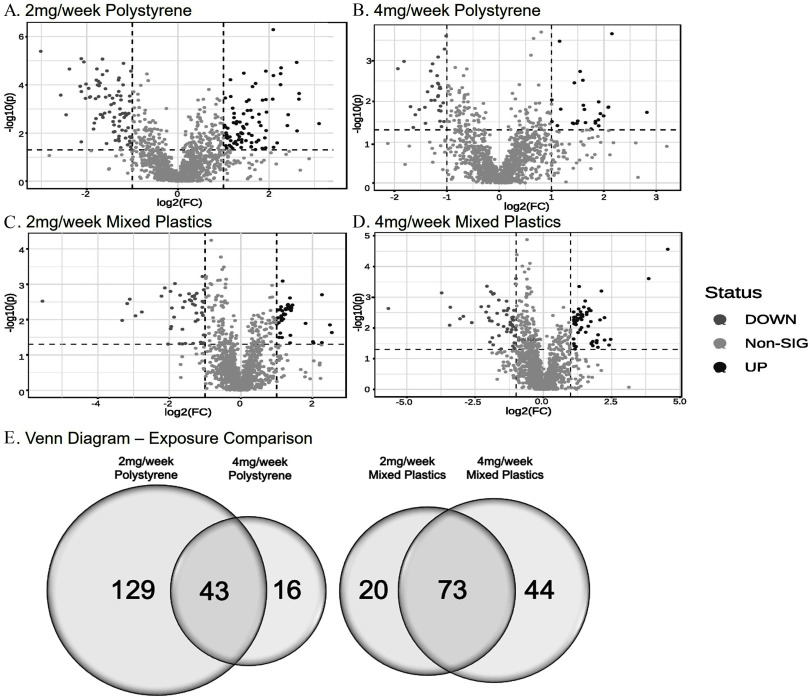
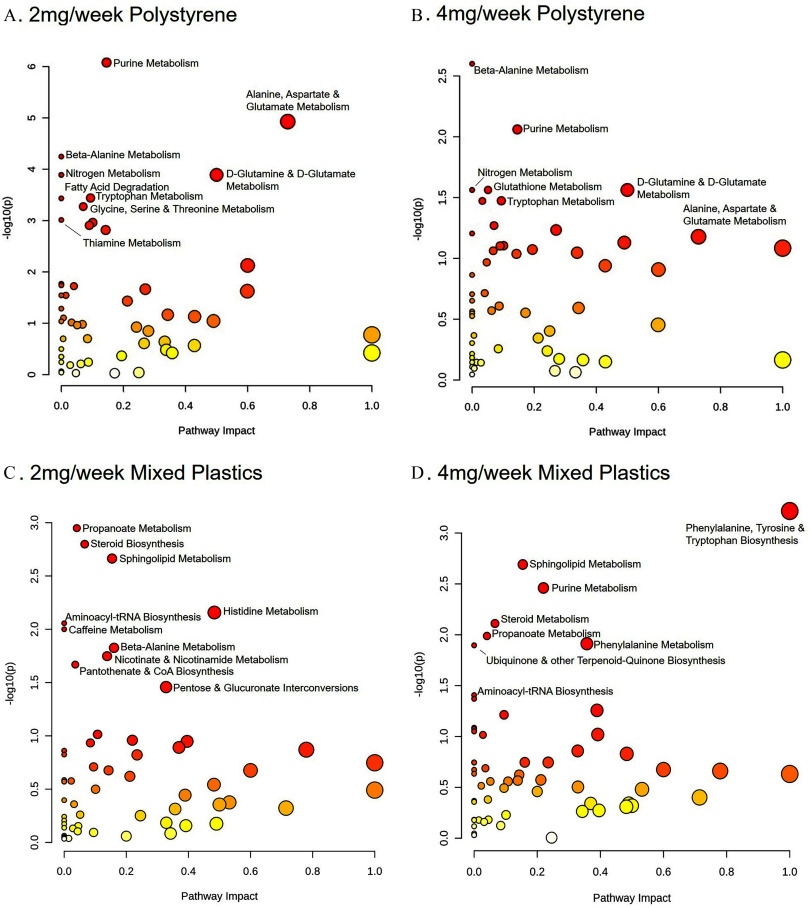
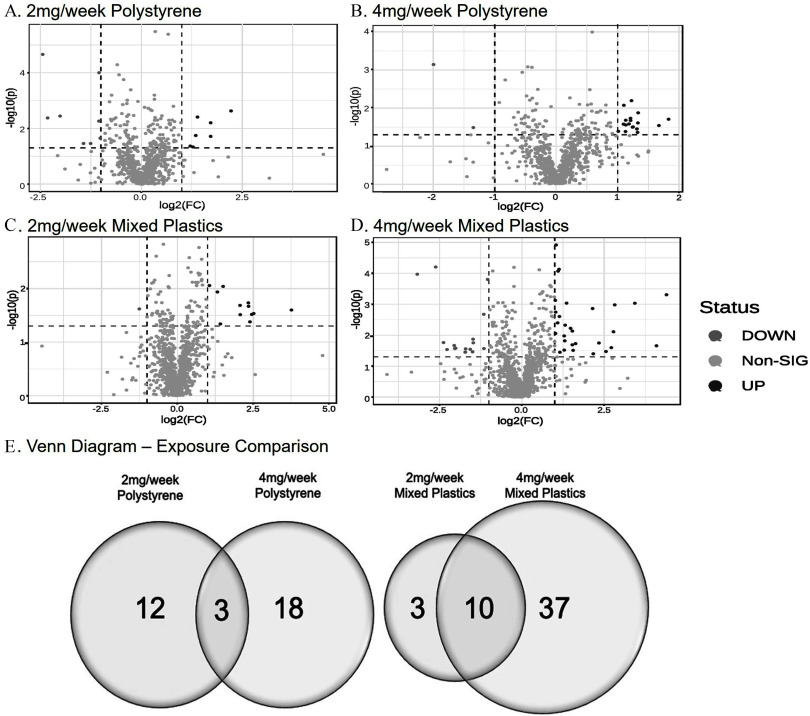
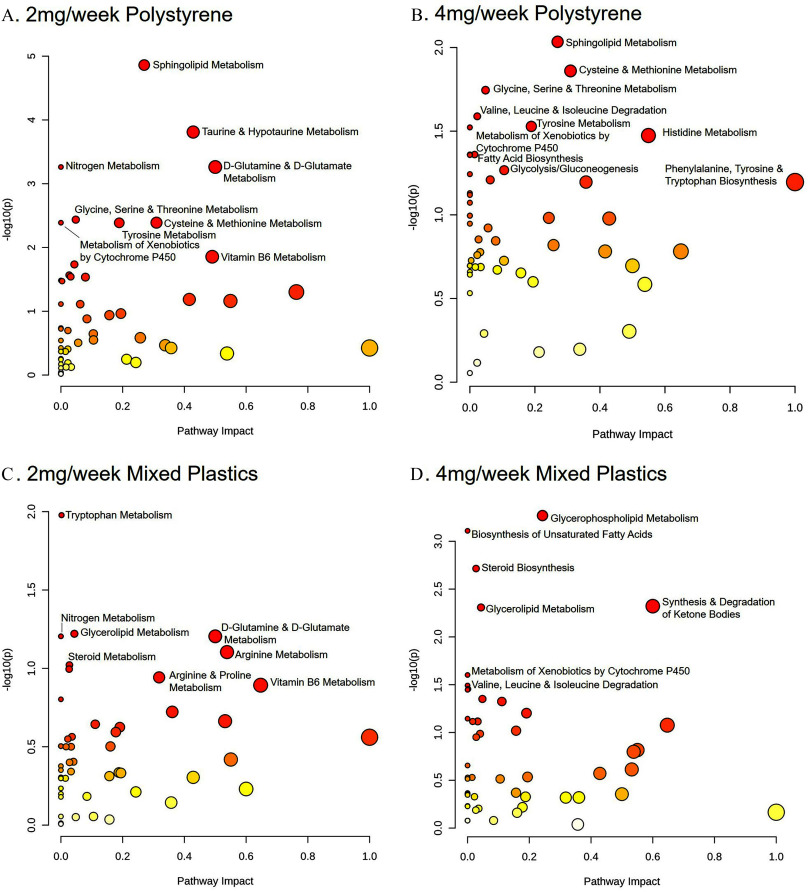
Results: In mice that ingested microspheres, we detected polystyrene microspheres in distant tissues including the brain, liver, and kidney. Additionally, we report on the metabolic differences that occurred in the colon, liver, and brain, which showed differential responses that were dependent on concentration and type of microsphere exposure.

Discussion: This study uses a mouse model to provide critical insight into the potential health implications of the pervasive issue of plastic pollution. These findings demonstrate that orally consumed polystyrene or mixed polymer microspheres can accumulate in tissues such as the brain, liver, and kidney. Furthermore, this study highlights concentration-dependent and polymer type-specific metabolic changes in the colon, liver, and brain after plastic microsphere exposure. These results underline the mobility within and between biological tissues of MPs after exposure and emphasize the importance of understanding their metabolic impact. https://doi.org/10.1289/EHP13435.


Figures

Figure 1 is a stained tissue displays three rows, namely, 0 milligram per week polystyrene, 2 milligrams per week polystyrene, 4 milligrams per week polystyrene, and four columns, namely, serum, brain, liver, and kidney. The arrows depict the polystyrene microspheres.
Figure 1.
Visualization of systemic polystyrene microsphere translocation. Visualization of polystyrene microspheres resuspended from isolated pellet in 100% EtOH. The black arrow indicates polystyrene microspheres. (A1–A3) Five-micrometer polystyrene microspheres in serum (20×). (B1–B3) Five-micrometer polystyrene microspheres in brain (20×). (C1–C3) Five-micrometer polystyrene microspheres in liver (40×). (D1–D3) Five-micrometer polystyrene microspheres in kidney (40×). Mice were exposed twice a week for 4 wk to a low dose of 2mg/week or a high dose of 4mg/week with 5-μm polystyrene microspheres via oral gavage. Images are representative of n=8. Note: EtOH, ethanol.
Figure 2 is a stained tissue displays three rows, namely, 0 milligram per week mixed polymers, 2 milligrams per week polymers, 4 milligrams per week mixed polymers, and four columns, namely, serum, brain, liver, and kidney. The arrows depict the microspheres.
Figure 2.
Visualization of systemic mixed polymer microsphere translocation. Visualization of mixed polymer microspheres resuspended from isolated pellet in 100% EtOH. The black arrow indicates microspheres. (A1–A3) Five-micrometer mixed polymers [polystyrene (PS), polyethylene (PE), and poly-(lactic-co-glycolic acid) (PLGA)] microspheres in serum (20×). (B1–B3) Five-micrometer mixed polymers (PS, PE, PLGA) in brain (20×). (C1–C3) Five-micrometer mixed polymers (PS, PE, PLGA) in liver (20×). (D1–D3) Five-micrometer mixed polymers (PS, PE, PLGA) in kidney (40×). Mice were exposed twice a week for 4 wk to a low dose of 2mg/week or a high dose of 4mg/week with of 5-μm mixed polymers via oral gavage. Images are representative of n=8. Note: EtOH, ethanol.
Figures 3A to 3D are volcano plots titled 2 milligrams per week polystyrene, 4 milligrams per week polystyrene, 2 milligrams per week mixed plastics, and 4 milligrams per week mixed plastics, plotting negative log 10 (lowercase p), ranging from 0 to 3 in unit increments; 0 to 3 in unit increments; 0 to 4 in unit increments; and 0 to 6 in increments of 2 (y-axis) across log 2 (fold change), ranging from negative 6 to 4 in increments of 2; negative 5.0 to 2.5 in increments of 2.5; negative 2.5 to 5.0 in increments of 2.5; and negative 6 to 6 in increments of 3 (x-axis) for status, including down, non-sig, and up, respectively. Figure 3E is a set of two Venn diagrams tiled Exposure comparison. On the left, the Venn diagram displays two circles. The left circle is labelled 2 milligrams per week polystyrene with 67 metabolites, the right circle is labelled 4 milligrams per week polystyrene with 53 metabolites. The intersection area displays 20 metabolites. On the right, the Venn diagram displays two circles. The left circle is labelled 2 milligrams per week mixed plastics with 111 metabolites, the right circle is labelled 4 milligrams per week mixed plastics with 166 metabolites. The intersection area has 201 metabolites.
Figure 3.
Untargeted metabolomics of colon. Untargeted metabolomic analysis in colon tissue of mice exposed to (A) 2mg/week polystyrene, (B) 4mg/week polystyrene, (C) 2mg/week mixed polymer, or (D) 4mg/week mixed polymer. Data plotted as log(2) fold change (p=0.05). (E) Venn diagram representing the significantly different metabolites following microsphere exposures (p<0.05 as compared to control). Mice were exposed twice a week for weeks with 5-μm polystyrene microspheres or mixed polymers [polystyrene, polyethylene, and poly-(lactic-co-glycolic acid)] at 2mg/week (low dose) or 4mg/week (high dose); n=8 per group. Source data can be found in Excel Tables S1 and S2.
Figures 4A to 4D are scatter dot plots titled 2 milligrams per week polystyrene, 4 milligrams per week polystyrene, 2 milligrams per week mixed plastics, and 4 milligrams per week mixed plastics, plotting negative log 10 (lowercase p), ranging from 0.0 to 3.5 in increments of 0.5; 0.0 to 3.5 in increments of 0.5; 0 to 4 in unit increments; and 0.0 to 2.0 in increments of 0.5 (y-axis) across pathway impact, ranging from 0.0 to 1.0 in increments of 0.2 (x-axis) for biotin metabolism, beta-alanine metabolism, arachidonic acid metabolism, alpha-linolenic acid metabolism, cytochrome P 450 xenobiotic metabolism, primary bile acid metabolism, arginine and proline metabolism, caffeine metabolism, porphyrin and chlorophyll metabolism, glyoxylate and dicarboxylate metabolism; biotin metabolism, beta-alanine metabolism, cytochrome P 450 xenobiotic metabolism histidine metabolism, retinol metabolism, primary bile acid biosynthesis, arginine and proline metabolism arginine synthesis, pentose and glucuronate interconversion, starch and sucrose metabolism, porphyrin and chlorophyll metabolism; biotin synthesis, primary bile acid biosynthesis, porphyrin and chlorophyll metabolism, phenylalanine metabolism, pentose phosphate pathway, purine metabolism, pyrimidine metabolism, arginine and proline metabolism, glyoxylate and dicarboxylate metabolism, amino sugar and nucleotide sugar metabolism, fructose and mannose metabolism; and steroid hormone biosynthesis, selenocompound metabolism, vitamin B 6 metabolism, primary bile acid biosynthesis, phenylalanine metabolism, biotin synthesis, nicotinate and nicotinamide metabolism, arachidonic acid metabolism, ether lipid metabolism, respectively.
Figure 4.
Colonic metabolome pathway analysis. Metabolomic pathway analysis of differences in the colon following oral microsphere exposure in mice exposed to (A) 2mg/week polystyrene, (B) 4mg/week polystyrene, (C) 2mg/week mixed polymers, or (D) 4mg/week mixed polymers. Mice were exposed twice a week for weeks with 5-μm polystyrene microspheres or mixed polymers [polystyrene, polyethylene, and poly-(lactic-co-glycolic acid)] at 2mg/week (low dose) or 4mg/week (high dose); n=8 per group. Source data can be found in Excel Tables S1 and S2.
Figures 5A to 5D are volcano plots titled 2 milligrams per week polystyrene, 4 milligrams per week polystyrene, 2 milligrams per week mixed plastics, and 4 milligrams per week mixed plastics, plotting negative log 10 (lowercase p), ranging from 0 to 6 in increments of 2; 0 to 3 in unit increments; 0 to 4 in unit increments; and 0 to 5 in unit increments (y-axis) across log 2 (fold change), ranging from negative 2 to 2 in increments of 2; negative 2 to 3 in unit increments; negative 4 to 2 in increments of 2; and negative 5.0 to 5.0 in increments of 2.5 (x-axis) for status, including down, non-sig, and up, respectively. Figure 5E is a set of two Venn diagrams tiled Exposure comparison. On the left, the Venn diagram displays two circles. The left circle is labelled 2 milligrams per week polystyrene with 128 metabolites, the right circle is labelled 4 milligrams per week polystyrene with 16 metabolites. The intersection area displays 43 metabolites. On the right, the Venn diagram displays two circles. The left circle is labelled 2 milligrams per week mixed plastics with 20 metabolites, the right circle is labelled 4 milligrams per week mixed plastics with 44 metabolites. The intersection area has 73 metabolites.
Figure 5.
Untargeted metabolomics of liver. Untargeted metabolomic analysis in the liver of mice exposed to (A) 2mg/week polystyrene, (B) 4mg/week polystyrene, (C) 2mg/week mixed plastics, or (D) 4mg/week mixed plastics. Data plotted as log(2) fold difference (p<0.05). (E) Venn diagram representing the significantly different metabolites following microplastic exposures (p<0.05 as compared to control). Mice were exposed twice a week for weeks with 5-μm polystyrene microspheres or mixed polymers [polystyrene, polyethylene, and poly-(lactic-co-glycolic acid)] at 2mg/week (low dose) or 4mg/week (high dose); n=8 per group. Source data can be found in Excel Tables S5 and S6.
Figures 6A to 6D are scatter dot plots titled 2 milligrams per week polystyrene, 4 milligrams per week polystyrene, 2 milligrams per week mixed plastics, and 4 milligrams per week mixed plastics, plotting negative log 10 (lowercase p), ranging from 0 to 6 in unit increments; 0.0 to 2.5 in increments of 0.5; 0.0 to 3.0 in increments of 0.5; and 0.0 to 3.0 in increments of 0.5 (y-axis) across pathway impact, ranging from 0.0 to 1.0 in increments of 0.2 (x-axis) for purine metabolism, alanine, aspartate and glutamate metabolism, beta-alanine metabolism, nitrogen metabolism, D-glutamine and D-Glutamate metabolism, fatty acid degradation, tryptophan metabolism, glycine, serine and threonine metabolism, thiamine metabolism; beta-alanine metabolism, purine metabolism, nitrogen metabolism, D-glutamine and D-Glutamate metabolism, glutathione metabolism, tryptophan metabolism, alanine, aspartate and glutamate metabolism; propanoate metabolism, steroid biosynthesis, sphingolipid metabolism, histidine metabolism, aminoacyl-tRNA biosynthesis, caffeine metabolism, beta-alanine metabolism, nicotinate and nicotinamide metabolism, pantothenate and CoA biosynthesis, pentose and glucuronate interconversions; and phenylalanine, tyrosine and tryptophan biosynthesis, sphingolipid metabolism, purine metabolism, steroid metabolism, propanoate metabolism, phenylalanine metabolism, ubiquinone and other terpenoid-quinone biosynthesis, and aminoacyl-tRNA biosynthesis, respectively.
Figure 6.
Hepatic metabolome pathway analysis. Metabolomic pathway analysis of alterations in the liver following oral MP exposure in mice exposed to (A) 2mg/week polystyrene, (B) 4mg/week polystyrene, (C) 2mg/week mixed polymer, or (D) 4mg/week mixed polymer. Mice were exposed twice a week for weeks with 5-μm polystyrene microspheres or mixed polymers [polystyrene, polyethylene, and poly-(lactic-co-glycolic acid)] at 2mg/week (low dose) or 4mg/week (high dose); n=8 per group. Source data can be found in Excel Tables S5, S6, and S14.
Figures 7A to 7D are volcano plots titled 2 milligrams per week polystyrene, 4 milligrams per week polystyrene, 2 milligrams per week mixed plastics, and 4 milligrams per week mixed plastics, plotting negative log 10 (lowercase p), ranging from 0 to 6 in increments of 2; 0 to 4 in unit increments; 0 to 2 in unit increments; and 0 to 5 in unit increments (y-axis) across log 2 (fold change), ranging from negative 2.5 to 2.5 in increments of 2.5; negative 2 to 2 in unit increments; negative 2.5 to 5.0 in increments of 2.5; and negative 2.5 to 2.5 in increments of 2.5 (x-axis) for status, including down, non-sig, and up, respectively. Figure 7E is a set of two Venn diagrams tiled Exposure comparison. On the left, the Venn diagram displays two circles. The left circle is labelled 2 milligrams per week polystyrene with 12 metabolites, the right circle is labelled 4 milligrams per week polystyrene with 18 metabolites. The intersection area displays 3 metabolites. On the right, the Venn diagram displays two circles. The left circle is labelled 2 milligrams per week mixed plastics with 3 metabolites, the right circle is labelled 4 milligrams per week mixed plastics with 37 metabolites. The intersection area has 10 metabolites.
Figure 7.
Untargeted metabolomics of brain. Untargeted metabolomic analysis of brain isolates from mice exposed to (A) 2mg/week polystyrene, (B) 4mg/week polystyrene, (C) 2mg/week mixed polymer, or (D) 4mg/week mixed plastics. Data plotted as log(2) fold change (p<0.05). (E) Venn diagram representing the significantly different metabolites following microplastic exposures (p<0.05 as compared to control). Mice were exposed twice a week for weeks with 5-μm polystyrene microspheres or mixed polymers [polystyrene, polyethylene, and poly-(lactic-co-glycolic acid)] at 2mg/week (low dose) or 4mg/week (high dose); n=8 per group. Source data can be found in Excel Tables S9 and S10.
Figures 8A to 8D are scatter dot plots titled 2 milligrams per week polystyrene, 4 milligrams per week polystyrene, 2 milligrams per week mixed plastics, and 4 milligrams per week mixed plastics, plotting negative log 10 (lowercase p), ranging from 0 to 5 in unit increments; 0.0 to 2.0 in increments of 0.5; 0.0 to 2.0 in increments of 0.5; and 0.0 to 3.0 in increments of 0.5 (y-axis) across pathway impact, ranging from 0.0 to 1.0 in increments of 0.2 (x-axis) for sphingolipid metabolism, taurine and hypotaurine metabolism, nitrogen metabolism, D-glutamine and D-Glutamate metabolism, glycine, serine and threonine metabolism, cysteine and methionine metabolism, tyrosine metabolism, metabolism of xenobiotics by cytochrome P 450, vitamin B 6 metabolism; sphingolipid metabolism, cysteine and methionine metabolism, glycine, serine and threonine metabolism, valine, leucine and isoleucine degradation, tyrosine metabolism, metabolism of xenobiotics by cytochrome P 450, histidine metabolism, fatty acid biosynthesis, glycolysis or gluconeogenesis, phenylalanine, tyrosine and tryptophan biosynthesis; nitrogen metabolism, glycerolipid metabolism, D-glutamine and D-Glutamate metabolism, arginine metabolism, arginine and proline metabolism, vitamin B 6 metabolism; and glycerophospholipid metabolism, biosynthesis of unsaturated fatty acids, steroid biosynthesis, glycerolipid metabolism, synthesis and degradation of ketone bodies, metabolism of xenobiotics by cytochrome P 450, valine, leucine and isoleucine degradation, respectively.
Figure 8.
Brain metabolome pathway analysis. Metabolomic pathway analysis of alterations in the brain following oral MP exposure in mice exposed to (A) 2mg/week polystyrene, (B) 4mg/week polystyrene, (C) 2mg/week mixed polymer, or (D) 4mg/week mixed polymer. Mice were exposed twice a week for weeks with 5-μm polystyrene microspheres or mixed polymers [polystyrene, polyethylene, and poly-(lactic-co-glycolic acid)] at 2mg/week (low dose) or 4mg/week (high dose); n=8 per group. Source data can be found in Excel Tables S9 and S10.

References

    1. Geyer R, Jambeck JR, Law KL. 2017. Production, use, and fate of all plastics ever made. Sci Adv 3(7):e1700782, PMID: , 10.1126/sciadv.1700782. - DOI - PMC - PubMed
    1. Bajt O. 2021. From plastics to microplastics and organisms. FEBS Open Bio 11(4):954–966, PMID: , 10.1002/2211-5463.13120. - DOI - PMC - PubMed
    1. Anderson PJ, Warrack S, Langen V, Challis JK, Hanson ML, Rennie MD. 2017. Microplastic contamination in Lake Winnipeg, Canada. Environ Pollut 225:223–231, PMID: , 10.1016/j.envpol.2017.02.072. - DOI - PubMed
    1. Pham DT, Kim J, Lee S-H, Kim J, Kim D, Hong S, et al. . 2023. Analysis of microplastics in various foods and assessment of aggregate human exposure via food consumption in Korea. Environ Pollut 322:121153, PMID: , 10.1016/j.envpol.2023.121153. - DOI - PubMed
    1. Irnidayanti Y, Soegianto A, Brabo AH, Abdilla FM, Indriyasari KN, Rahmatin NM, et al. . 2023. Microplastics in green mussels (Perna viridis) from Jakarta Bay, Indonesia, and the associated hazards to human health posed by their consumption. Environ Monit Assess 195(7):884, PMID: , 10.1007/s10661-023-11535-9. - DOI - PubMed

LinkOut - more resources