. 2024 Apr 16;121(16):e2318444121.
doi: 10.1073/pnas.2318444121. Epub 2024 Apr 10.

Modeling of brain efflux: Constraints of brain surfaces

Affiliations

Modeling of brain efflux: Constraints of brain surfaces

Peter A R Bork et al. Proc Natl Acad Sci U S A. .

Abstract

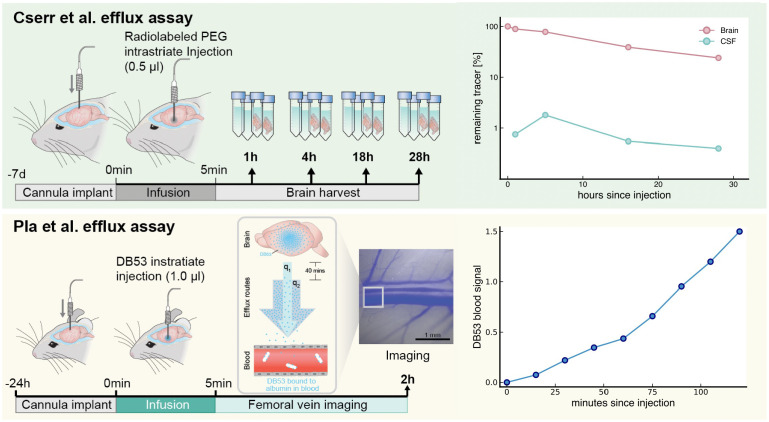
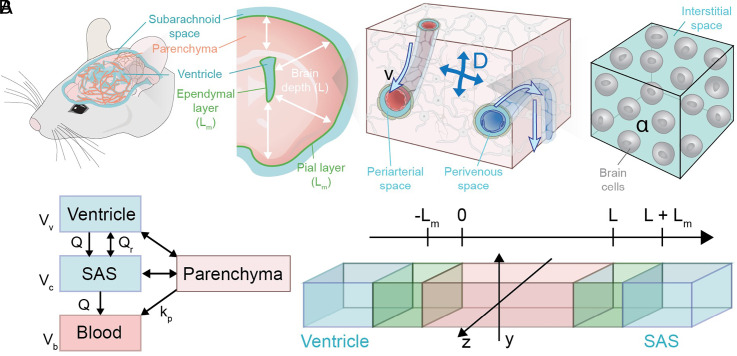
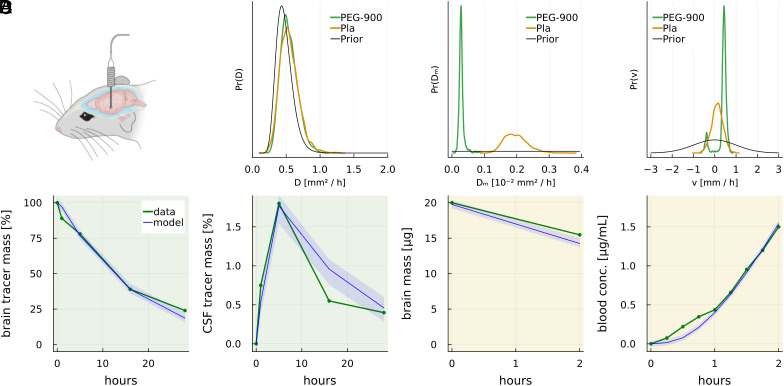
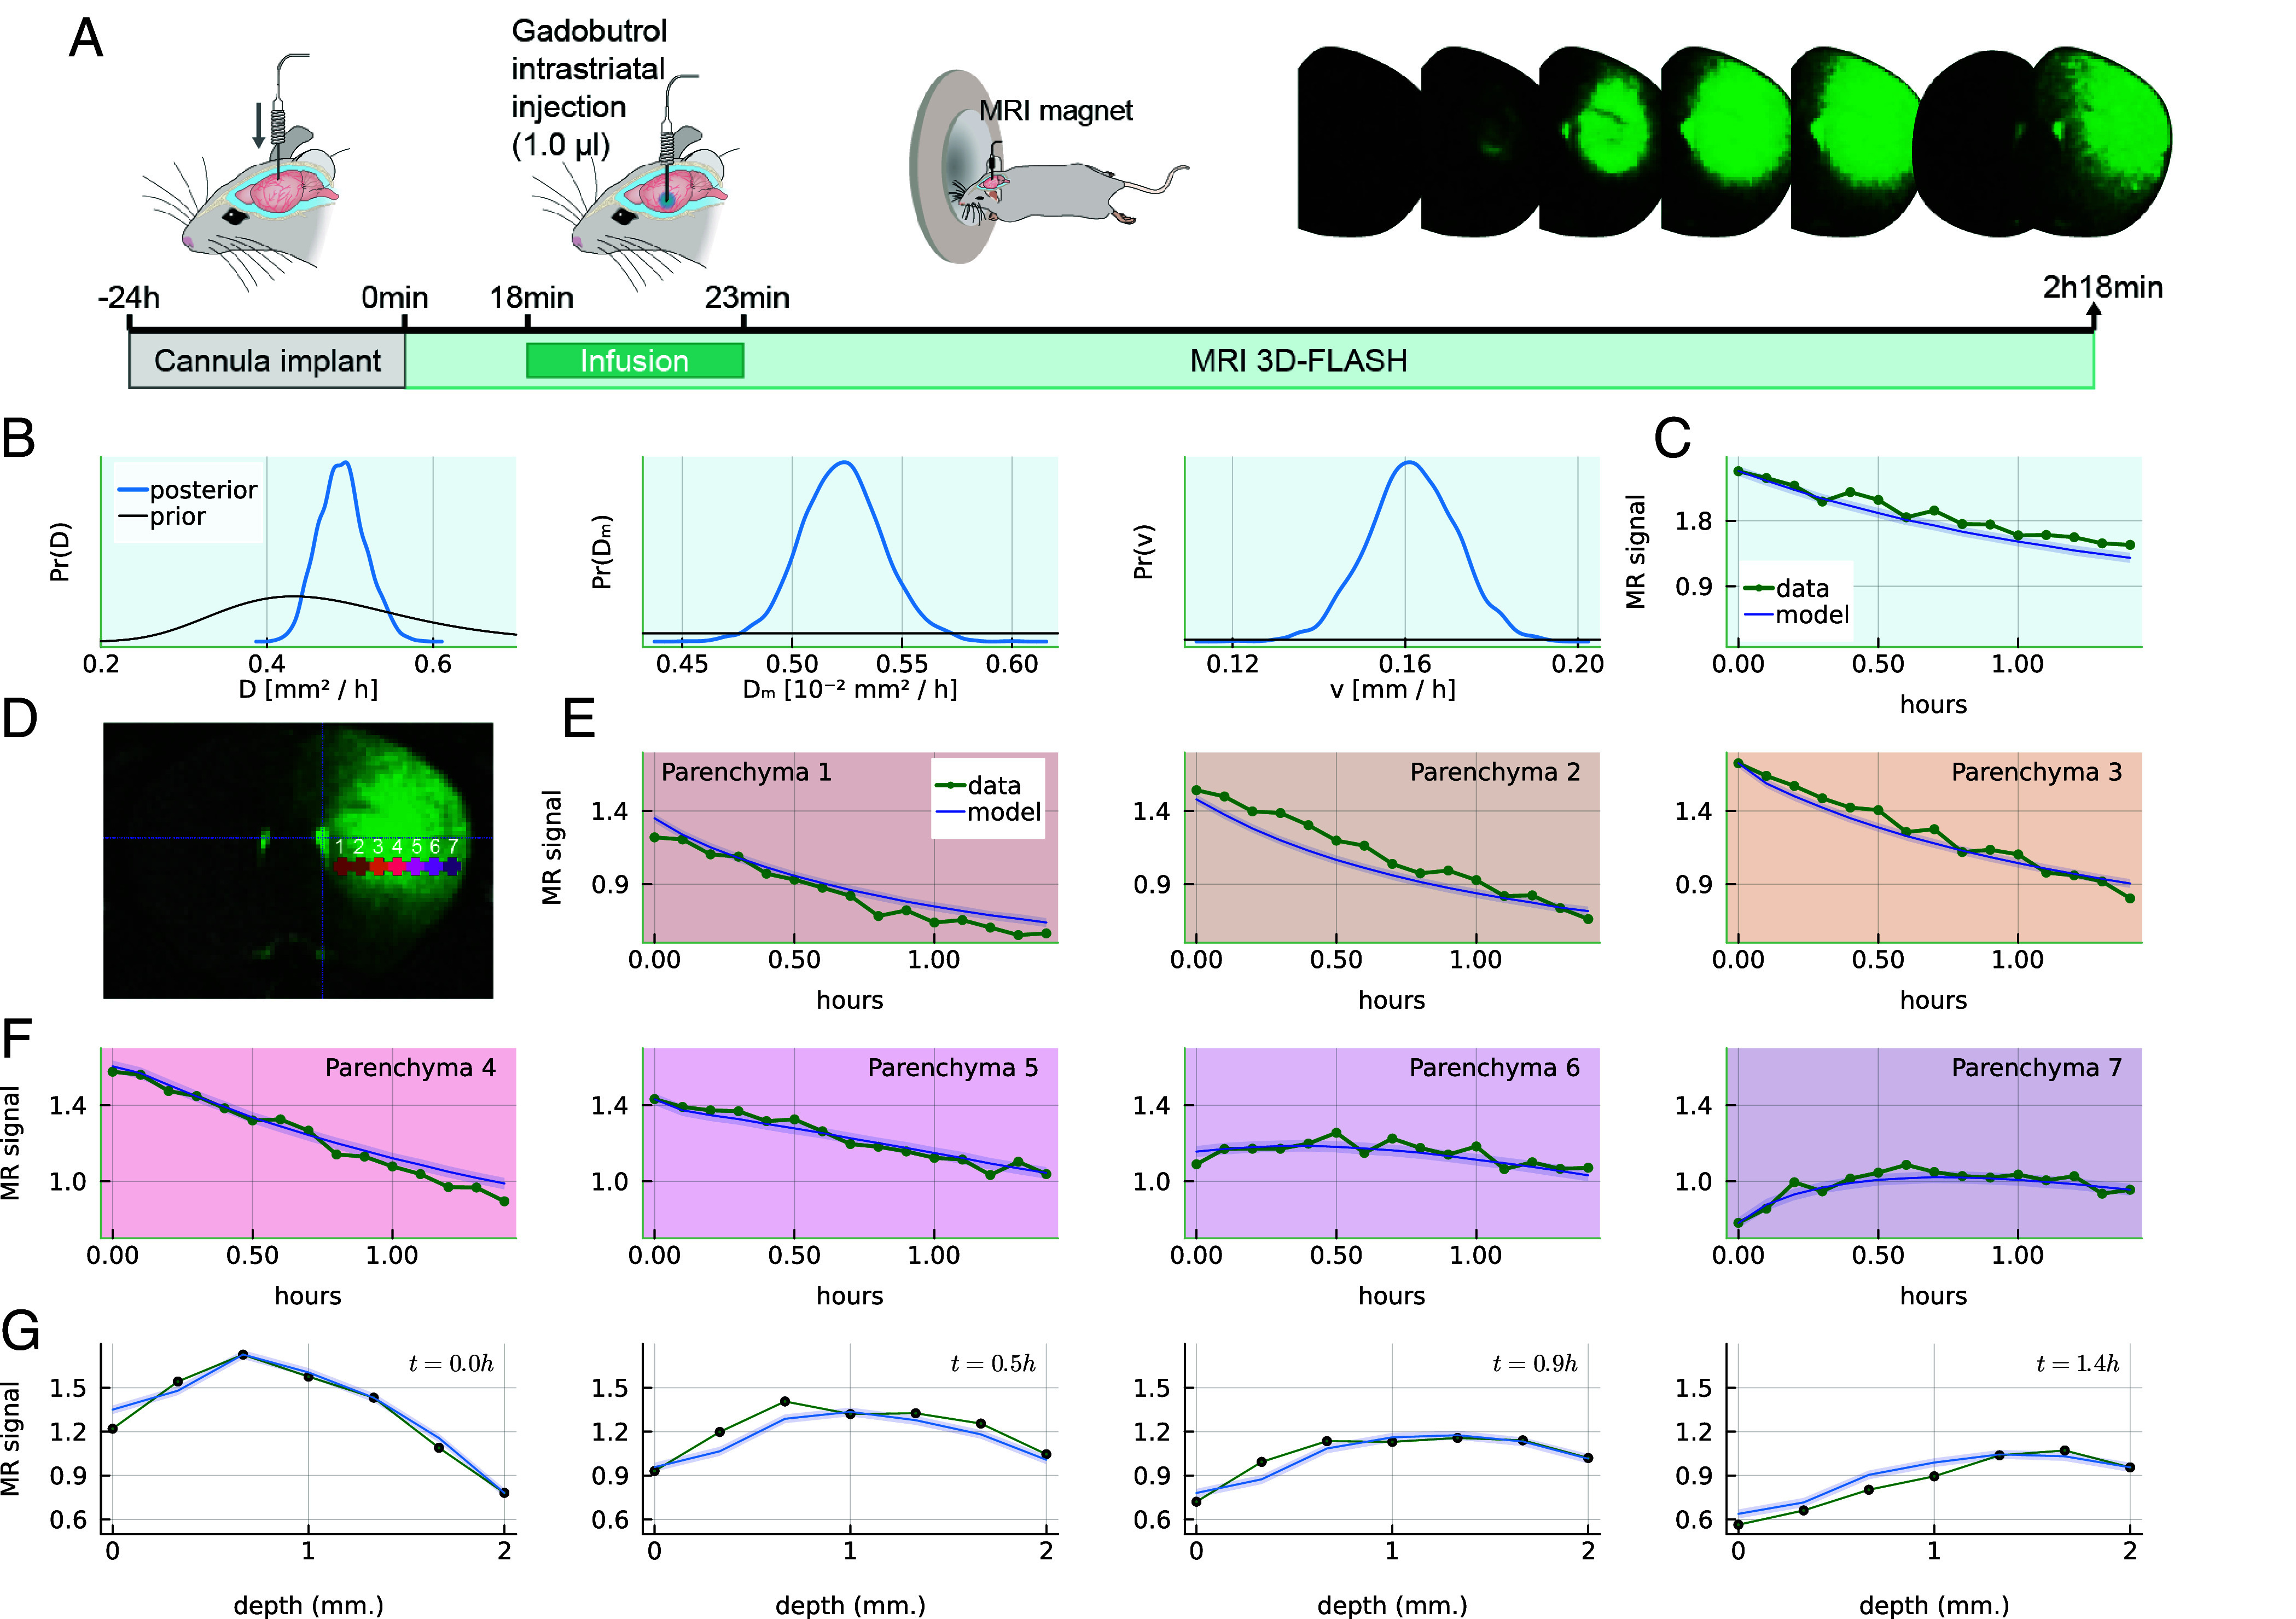
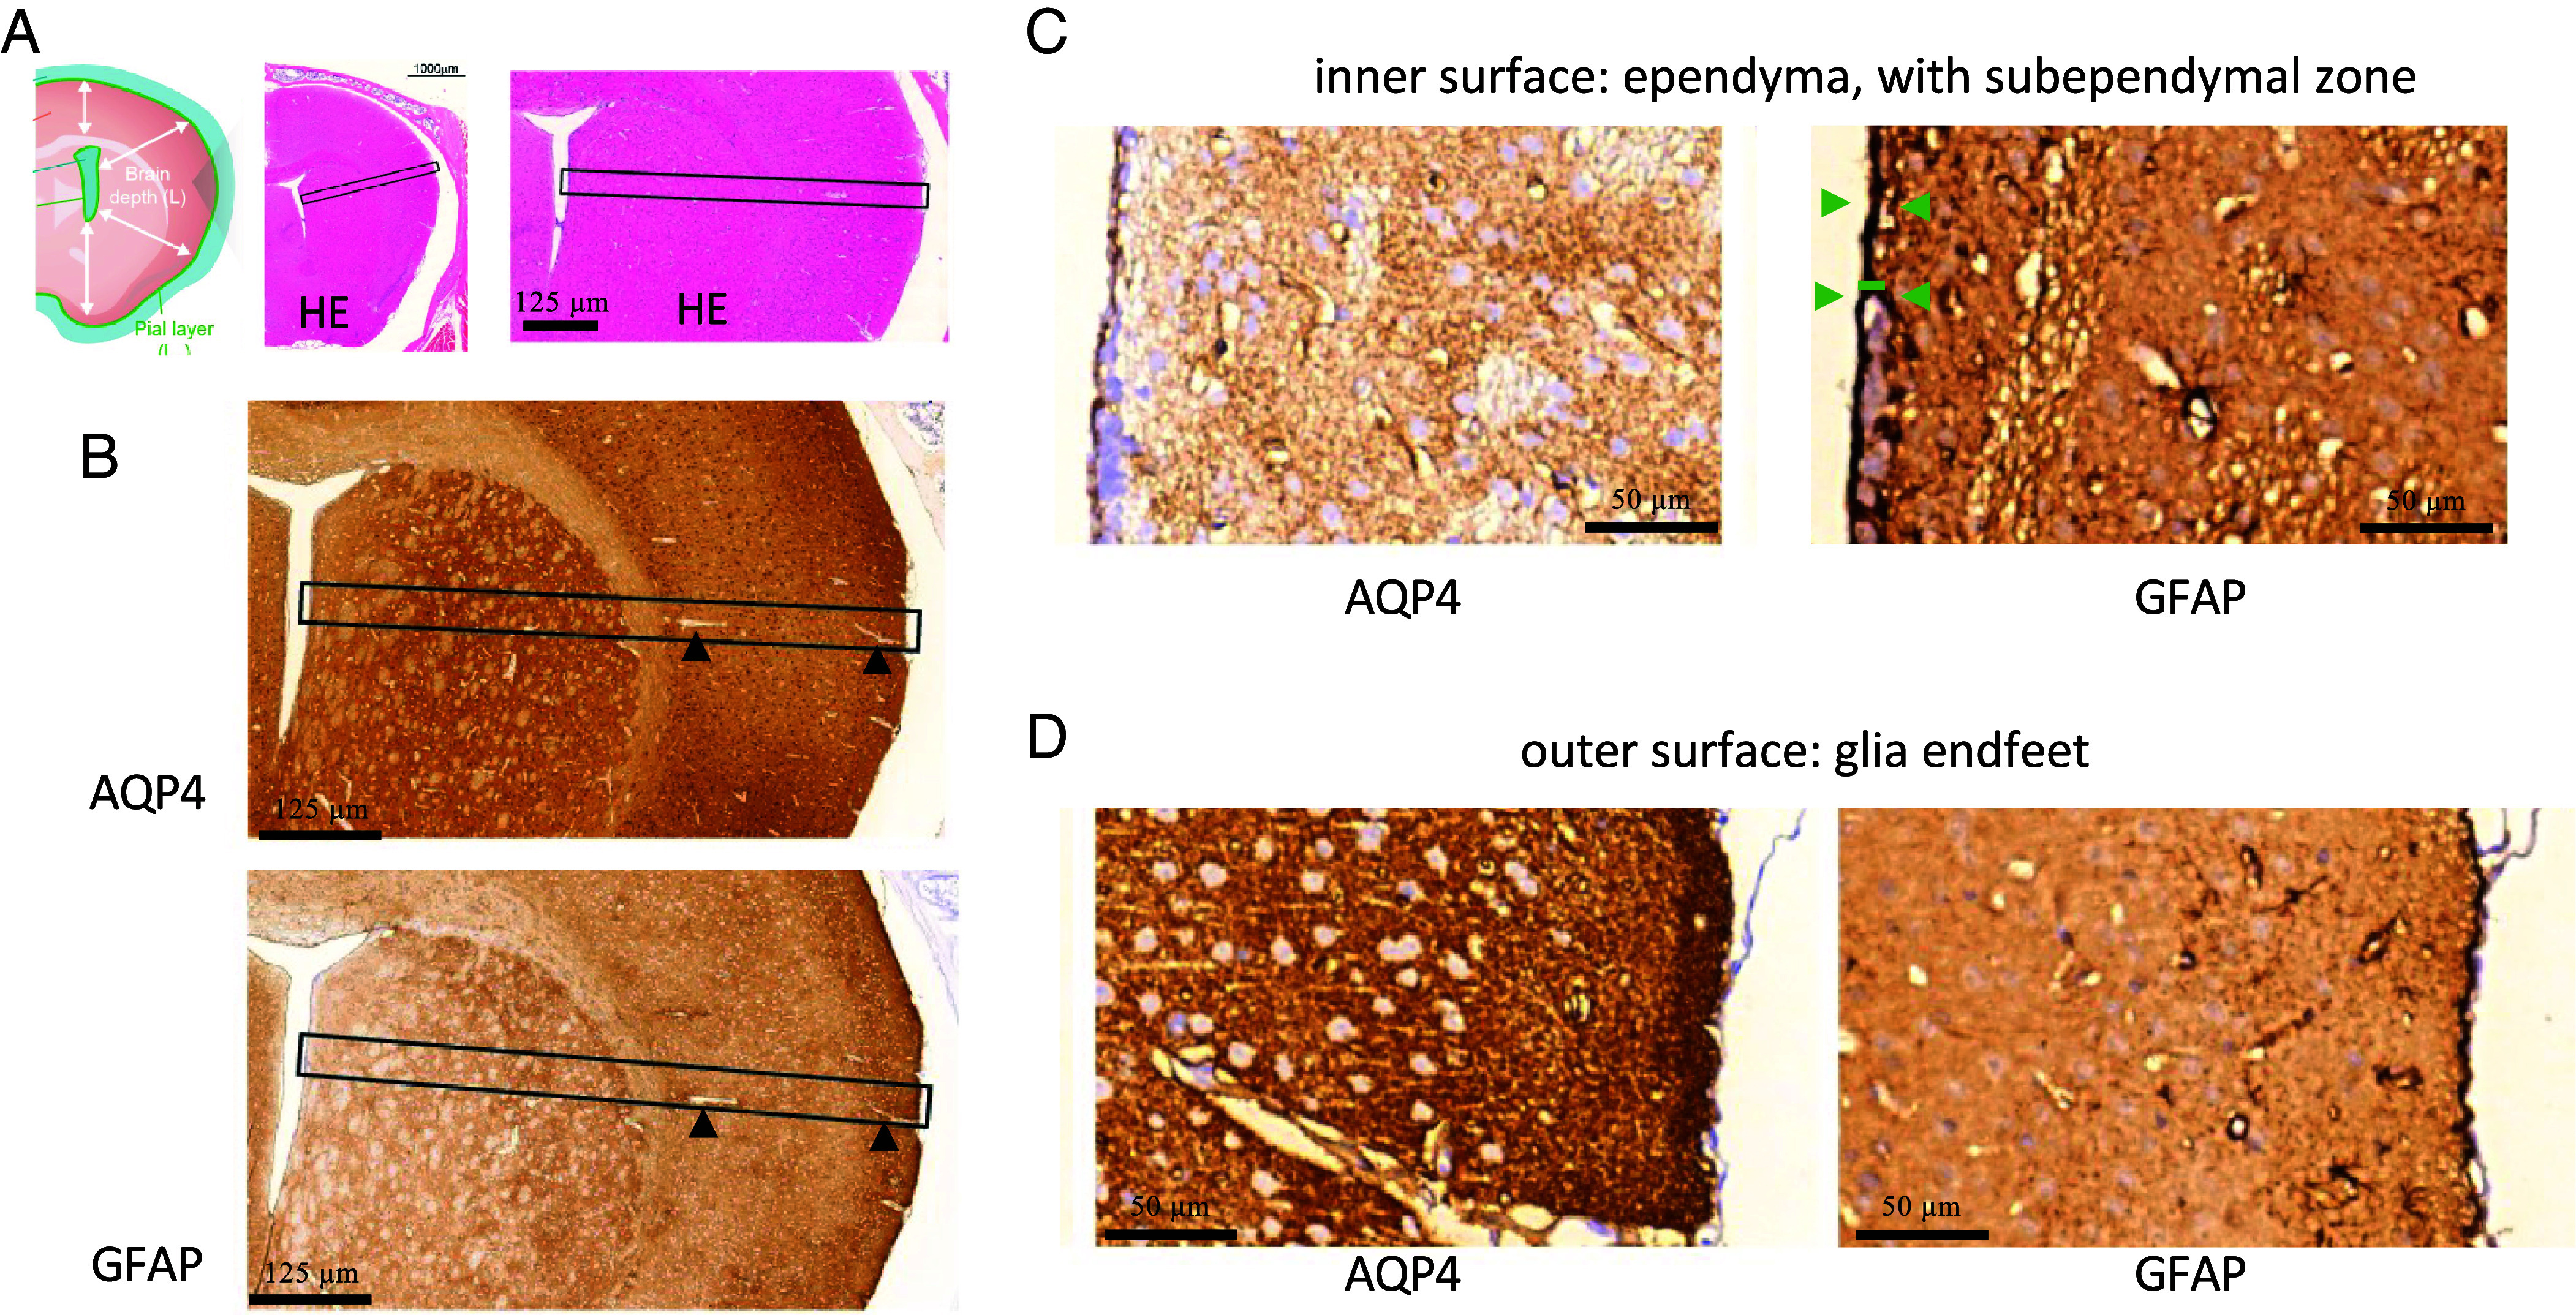
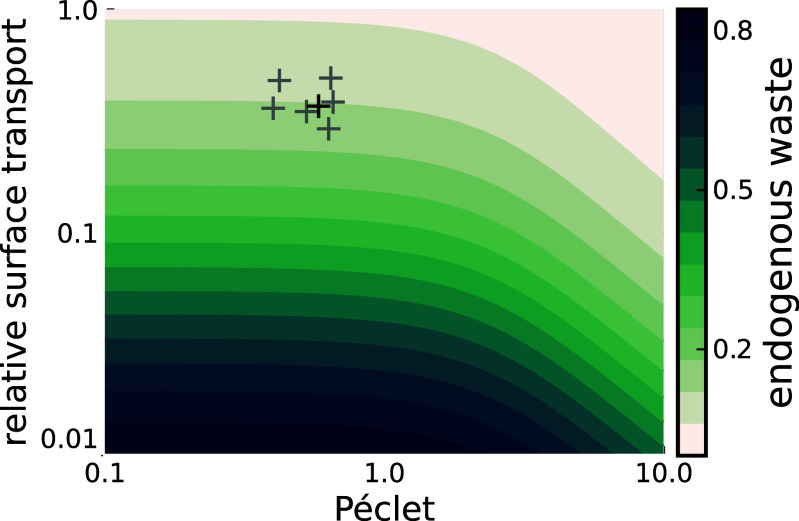
Fluid efflux from the brain plays an important role in solute waste clearance. Current experimental approaches provide little spatial information, and data collection is limited due to short duration or low frequency of sampling. One approach shows tracer efflux to be independent of molecular size, indicating bulk flow, yet also decelerating like simple membrane diffusion. In an apparent contradiction to this report, other studies point to tracer efflux acceleration. We here develop a one-dimensional advection-diffusion model to gain insight into brain efflux principles. The model is characterized by nine physiological constants and three efflux parameters for which we quantify prior uncertainty. Using Bayes' rule and the two efflux studies, we validate the model and calculate data-informed parameter distributions. The apparent contradictions in the efflux studies are resolved by brain surface boundaries being bottlenecks for efflux. To critically test the model, a custom MRI efflux assay measuring solute dispersion in tissue and release to cerebrospinal fluid was employed. The model passed the test with tissue bulk flow velocities in the range 60 to 190 [Formula: see text]m/h. Dimensional analysis identified three principal determinants of efflux, highlighting brain surfaces as a restricting factor for metabolite solute clearance.

Keywords: MRI; advection–diffusion; glymphatics.


Conflict of interest statement

Competing interests statement:The authors declare no competing interest.

Figures

Fig. 1.
Fig. 1.
Overview over previously published brain efflux assays used here. Two published tracer efflux assays by Cserr et al. (5) (Top row) and Pla et al. (7) (Middle row) provide the inspiration and validation for the one-dimensional model proposed here. Cserr et al. infused radiolabeled tracers into rat brains and measured tracer mass in cerebrospinal fluid (CSF) and whole brains harvested at 1, 4, 18, and 28 h (5). Large and small tracers were found to clear the brain at the same rate, indicating bulk flow efflux, but the rate decelerated over time, pointing to diffusive efflux. Pla et al. infused DB53 (0.96 kDa) in the mouse brain and quantified its accelerating concentration using fluorescence enhancement in the blood over the next 2 h, where it is trapped independent of efflux route by its strong binding with albumin (7).
Fig. 2.
Fig. 2.
One-dimensional and lumped advection–diffusion model of global brain solute transport. (A) In the murine brain, fluid flow is proposed along coronal radii (white arrows), with flow (light blue arrows) along vasculature and interstitial diffusion (cross-arrow) in the extracellular space (teal). Molecular concentrations and transport are averaged over small tissue volumes (cubes) which are taken to be homogeneous porous media with tortuous diffusion (8) and Darcy flow. Bulk flow along vasculature (blue arrows) is taken to primarily run between ventricles and the subarachnoid space surface in the coronal section (white arrows), where solutes mix rapidly and are transported to blood. (B) This biology is reduced to three control volumes representing ventricles, subarachnoid space (SAS), and blood and a one-dimensional advection–diffusion–reaction model, oriented along the average bulk flow directions. From tissue parenchyma (pink), molecules diffuse over surface membranes (green, not to scale) to either ventricles or subarachnoid space compartments, each with rapidly mixing cerebrospinal fluid, and are then taken to blood with first-order mass transport kinetics. Endogenous production and transport across the blood–brain barrier is evenly distributed in the tissue (as reaction terms; see Eqs. 2–5). Constants and parameter descriptions are listed in Table 1.
Fig. 3.
Fig. 3.
Data-informed parameter distributions and model predictions agree with both rat and mouse in vivo efflux datasets. (A) Both efflux datasets rely on intrastriatal injections. (B) There is considerable overlap on data-informed probability distributions for the effective diffusion parameter D in the Cserr and Pla datasets with prior knowledge based on diffusion assays (9) (shown here is Cserr’s PEG-900 tracer, see SI Appendix, Fig. SI 1 for PEG-4000 and albumin). Based on the Cserr efflux study, surface membrane permeability Dm estimates are smaller than in the Pla dataset and the model is unable to distinguish the direction of bulk flow, but prefers a speed of 0.3mm/h. The data-informed probability distribution for bulk flow based on the Pla study overlaps zero, with 95% of the probability mass between 0.47mm/h and 0.83mm/h. Compared to the prior (black, shown on restricted interval) the data-informed distributions are more precise. (C) There is considerable overlap with the longer duration efflux data on remaining tracer mass in rat brain and cerebrospinal fluid (CSF) from the Cserr study. (D) Mouse total brain content and blood concentrations from the Pla et al. study agree with data-informed model predictions. Blue lines: mean posterior prediction, blue shadow: one SD from mean.
Fig. 4.
Fig. 4.
Real-time in vivo solute kinetic measurements in the closed skull. (A) In this custom efflux assay, we infused gadobutrol (0.6 kDa) in mouse striatum and measured tracer concentration in seven regions of interest on the coronal plane. Representative stills taken during the 2 h after tracer infusion with regions of interest illustrated. (B) The posterior effective diffusion coefficient aligns with priors. The membrane diffusion coefficient is similar to estimates based on the Cserr and Pla datasets. The estimated velocity component is small but nonzero with maximum probability of 0.16mm/h. Due to information in the data, the data-informed distributions for Dm and v are each narrow on a small interval under the prior (in black, shown partly). (CG) The model data-informed predictions (blue) fit the custom MR measurements of tracer at seven regions of interest (D) after intrastriatal infusion seen across time (E and F) and over the brain depth (G) (representative example, see each recording in SI Appendix, Figs. S3–S9).
Fig. 5.
Fig. 5.
Histological staining of the coronal section and boundary zones. (A) The modeled axis in the coronal section was identified with HE staining of a mouse brain. (B) Along the axis from outer to inner surfaces, staining for AQP4 and glia cells (with GFAP) shows gaps for vessels oriented along our hypothesized main direction of transport (arrowheads). (C) The ependyma of the inner surface shows attenuated ependymal cells positive for AQP4, with an additional layer corresponding to the stem cell niche revealed by GFAP. The roughly 10 μm layer most strongly stained for GFAP is taken to be the transport bottleneck (green arrowheads and bar). (D) The outer surface between the brain and subarachnoid space features a glia limitans zone of AQP4 staining about 25 μm wide, but a much narrower GFAP-positive single cell layer. HE, hematoxylin and eosin; GFAP, glial fibrillary acidic protein; AQP4: aquaporin-4.
Fig. 6.
Fig. 6.
Steady-state brain content of endogenously produced waste solutes varies considerably with both relative advection (Pe) and surface membrane permeability (γ). In the nondimensionalized model, the total brain content (labeled waste) is a function of three nondimensional parameters, when endogenously produced waste is assumed to rapidly clear from blood and cerebrospinal fluid. One reflects clearance across the blood–brain barrier and we here set that low (ϕ=0.1) to investigate clearance when the blood–brain barrier route is ineffective. The remaining two parameters are the Péclet number (Pe) (ratio of advection to diffusion) and γ, which is the relative surface membrane transport. The parameters estimated with MRI from Fig. 4 give (Pe,γ)=(0.6,0.4) and are shown with a black + while the rest of the MRI datasets are in gray. In this region, stable waste concentrations are somewhat more sensitive to relative surface transport than to advection.

Similar articles

Cited by

References

    1. Savage V. M., West G. B., A quantitative, theoretical framework for understanding mammalian sleep. Proc. Natl. Acad. Sci. U.S.A. 104, 1051–1056 (2007). - PMC - PubMed
    1. Cao J., Herman A. B., West G. B., Poe G., Savage V. M., Unraveling why we sleep: Quantitative analysis reveals abrupt transition from neural reorganization to repair in early development. Sci. Adv. 6, eaba0398 (2020). - PMC - PubMed
    1. Xie L., et al. , Sleep drives metabolite clearance from the adult brain. Science 342, 373–377 (2013). - PMC - PubMed
    1. Thomas J. H., Theoretical analysis of wake/sleep changes in brain solute transport suggests a flow of interstitial fluid. Fluid. Barr. CNS 19, 1–5 (2022). - PMC - PubMed
    1. Cserr H., Cooper D., Suri P., Patlak C., Efflux of radiolabeled polyethylene glycols and albumin from rat brain. Am. J. Physiol.-Renal Physiol. 240, F319–F328 (1981). - PubMed

LinkOut - more resources