. 2024 May;1535(1):92-108.
doi: 10.1111/nyas.15137. Epub 2024 Apr 10.

Colonic crypt stem cell functions are controlled by tight junction protein claudin-7 through Notch/Hippo signaling

Affiliations

Colonic crypt stem cell functions are controlled by tight junction protein claudin-7 through Notch/Hippo signaling

Amna N Naser et al. Ann N Y Acad Sci. 2024 May.

Abstract

The tight junction protein claudin-7 is essential for tight junction function and intestinal homeostasis. Cldn7 deletion in mice leads to an inflammatory bowel disease-like phenotype exhibiting severe intestinal epithelial damage, weight loss, inflammation, mucosal ulcerations, and epithelial hyperplasia. Claudin-7 has also been shown to be involved in cancer metastasis and invasion. Here, we test our hypothesis that claudin-7 plays an important role in regulating colonic intestinal stem cell function. Conditional knockout of Cldn7 in the colon led to impaired epithelial cell differentiation, hyperproliferative epithelium, a decrease in active stem cells, and dramatically altered gene expression profiles. In 3D colonoid culture, claudin-7-deficient crypts were unable to survive and form spheroids, emphasizing the importance of claudin-7 in stem cell survival. Inhibition of the Hippo pathway or activation of Notch signaling partially rescued the defective stem cell behavior. Concurrent Notch activation and Hippo inhibition resulted in restored colonoid survival, growth, and differentiation to the level comparable to those of wild-type derived crypts. In this study, we highlight the essential role of claudin-7 in regulating Notch and Hippo signaling-dependent colonic stem cell functions, including survival, self-renewal, and differentiation. These new findings may shed light on potential avenues to explore for drug development in colorectal cancer.

Keywords: cell differentiation; claudin‐7; colonic epithelial stem cells; colonoid culture; colorectal cancer.


Conflict of interest statement

COMPETING INTERESTS

The authors declare no competing interests.

Figures

FIGURE 1
FIGURE 1. Genome-wide microarray analysis highlights differential gene expression between WT and gKO large intestines.
(A) Heatmap depicting gene expression profile of two independent sets of PN3 WT and gKO large intestines obtained from microarray analysis. As an example, the numerical values for Olmf4 [log2(WT/KO)] are 5.25 for small intestine and −2.35 for large intestine (for a complete list, see Supplemental Materials Table S2). (B) Ingenuity pathway analysis (IPA) highlights gene expression changes related to physiological functions and diseases and disorders. (C) Gene set enrichment analysis (GSEA) of WT versus gKO large intestines. p<0.01 indicates statistical signficance; False discovery rate (FDR) q<25%; Normalized enrichment score (NES), a positive NES indicates gene set enrichment at the top of the ranked list, while a negative NES indicates gene set enrichment at the bottom of the ranked list. Abbreviations: gKO, Cldn7 global knockout; PN3, postnatal day 3; WT, wild type. Red: positively correlated; blue: negatively correlated.
FIGURE 2
FIGURE 2. Gross phenotypes of inducible, intestinal-specific Cldn7 knockout mice (cKO).
(A) The cKO mice exhibit severe intestinal inflammation with swollen appearance (red arrow) and signs of diarrhea (white arrow). (B) Comparison of WT and cKO large intestines. Arrows indicate the sign of diarrhea in cKO colon while showing feces formation in WT colon. (C) Quantification of percentage of body weight over time after intraperitoneal injection of tamoxifen to induce Cldn7 deletion. (D) Quantification of colon length in centimeters. Values in C and D were compared by unpaired t test and plotted as mean ± SEM. n = 15. ****p≤ 0.0001. (E) Representative H&E stained images from 3-months-old WT and cKO colons. The arrowheads indicate the surface epithelial cells. The black arrows show the goblet cells, and the yellow arrows point to apoptotic or necrotic cells. N=6; Scale bars = 200 μm. (F) Immunofluorescent staining for claudin-7 in WT and cKO colon tissues. (G) Samples of western blot probing for claudin-7 in WT and cKO colons. GAPDH serves as a loading control. N = 3; N indicates the number of independent experiments. Samples came from three independent experiments. Abbreviation: WT, wild type.
FIGURE 3
FIGURE 3. Cldn7 cKO exhibits a decrease in epithelial cell differentiation and an increase in epithelial proliferation.
(A) Immunofluorescent staining for carbonic anhydrase II to mark colonocytes in WT and cKO colon. (B) Quantification of percentage of colonocytes per crypt in WT and cKO colon. (C) DCAMKL1 staining to mark tuft cells in WT and cKO colon. White arrowheads indicate Tuft cells. (D) Quantification of percent tuft cells per crypt. (E) Chromogranin A staining to mark enteroendocrine cells in WT and cKO colon. White arrowheads indicate enteroendocrine cells. (F) Quantification of percent enteroendocrine cells per crypt. (G) Alcian blue staining to mark mucus in goblet cells in WT and cKO colon. (H) Quantification of percent goblet cells per crypt. (I) Ki67 staining to mark proliferative cells in WT and cKO colon. (J) Quantification of percent proliferating cells per crypt. Scale bars = 50 μm. Values were compared by unpaired t test and plotted as mean ± SEM. n = 15. ****p≤0.0001. Abbreviations: cKO, intestinal-specific Cldn7 knockout mice; WT, wild type
FIGURE 4
FIGURE 4. Deletion of Cldn7 leads to the increased Olfm4 expression in the colon.
(A) Microarray heat map demonstrates decreased Olfm4 expression in the gKO small intestine compared to increased Olfm4 expression in the gKO large intestine. Analyzed samples were isolated from two independent litters. (B) Immunohistochemistry staining for Olfm4 in WT and cKO colons (left column). Quantification of Olfm4 positive cells per crypt in WT and cKO colons is shown in the right column. Scale bars = 50 μm. n = 15. (C) and (D) Western blot probing for Olfm4 and claudin-7 in both WT and gKO colons (C, left column) as well as in WT and cKO colons (D, left column). Quantifications of Olfm4 protein fold change for C and D are shown in their right columns. N = 3. **p≤0.01, ***p≤0.001, ****p≤0.0001. Molecular weight marker: Olfm4, 75 kDa; Claudin-7, 23 kDa; GAPDH, 37 kDa.
FIGURE 5
FIGURE 5. Claudin-7-deficient crypts are unable to survive and proliferate.
(A) qRT-PCR examination of mRNA levels for Lgr5, Bmi1, Hopx, and Prom1 in WT and cKO colon tissues. (B) Fluorescent in situ hybridization for Lgr5 in WT and cKO colons. The arrowheads mark active stem cells in WT and indicate the bottom of the crypts without active stem cells in cKO (left column). Quantification of active stem cells in WT and cKO colons as percent of Lgr5 positive cells per crypt is shown in the right column. n = 15. Scale bars = 50 μm and insert scale bar = 7.5 μm (C) Timeline of colonoid culture and 4OH-tamoxifen (4-OH-TAM) treatment. (D) Control (DMSO) and 4OH-TAM cKO colonoid growth over time. Scale bars = 200 μm. (E) Colonoid survival curve. (F) In situ cell death (TUNEL) stain on day 11 control and 4OH-TAM cKO colonoids. Scale bars = 200 μm (control), 100 μm (cKO). Values were compared by unpaired t test. N=3 for A and B; n = 12 for C–F. * p≤0.05, **** p≤0.0001.
FIGURE 6
FIGURE 6. Claudin-7-deficient colonoids are unable to grow and differentiate into the epithelial cell types.
(A) Claudin-7 staining in control and 4OH-TAM cKO colonoids. (B) Ki67 staining to mark proliferating cells in control and 4OH-TAM cKO colonoids. (C) Immunofluorescent staining for carbonic anhydrase II to mark colonocytes in control and 4OH-TAM cKO colonoids. (D) DCAMKL1 staining to mark tuft cells in control and 4OH-TAM cKO colonoids. (E) Staining for Chromogranin A to mark enteroendocrine cells in control and 4OH-TAM cKO colonoids. (F) Alcian blue staining to mark mucus in goblet cells in control and 4OH-TAM cKO colonoids. Scale bars = 250 μm. n = 9. Abbreviations: cKO, intestinal-specific Cldn7 knockout mice.
FIGURE 7
FIGURE 7. Loss of claudin-7 affects stem cell proliferation and differentiation.
(A) Immunofluorescent staining for epithelial cell types in control (day 7) and 24 hours after induction of Cldn7 deletion at day 6. Scale bars = 250 μm. Arrowheads point to mucus staining in goblet cells. (B) Immunofluorescent staining for epithelial cell types in control (day 9) and 24 hours after induction of Cldn7 deletion at day 8. Scale bars = 250 μm. Arrowheads point to mucus staining in goblet cells. (C) Quantification of percent of each cell type in control (day 7) and 24 hours after day 6 Cldn7 KO colonoids. (D) Quantification of percent of each cell type in control (day 9) and 24 hours after day 8 claudin-7 KO colonoids. N = 3. ***p≤0.001, ****p≤0.0001. Abbreviation: EE, enteroendocrine cells.
FIGURE 8
FIGURE 8. Claudin-7-deficient colonoid survival can be rescued through modulation of Notch and Hippo signaling pathways.
(A) Timeline of colonoid culture and treatments. (B) Representative images of day 11 control, Cldn7 KO, and rescued colonoids. Scale bars = 50 μm. (C) Percent of colonoid survival through 11 days of culture. (D) Number of buds growing through 11 days of culture. Scale bars = 250 μm. N=3. *p≤ 0.05, **p≤ 0.01, ***p≤ 0.001, ****p≤ 0.0001.
FIGURE 9
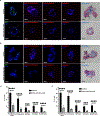
FIGURE 9. Deletion of Cldn7 inhibits Notch and activates Hippo signaling pathways in mouse colons.
(A) The qRT-PCR analysis of Notch signaling pathway genes in WT and gKO colons. (B) The protein levels of activated Notch and total Notch were examined by immunoblotting in WT and gKO colons. (C) The protein levels of activated Notch and total Notch were examined by immunoblotting in WT and cKO colons. (D) Western blot probing for YAP, phosphorylated YAP, and claudin-7 in WT and gKO as well as WT and cKO colon tissues. GAPDH served as a loading control. (E) Triple Immunofluorescent staining for claudin-7, phosphorylated YAP, and DAPI (nuclear staining) in WT and cKO colon tissues. Scale bars = 50 μm for both WT and cKO. N = 3. *p≤0.05, **p≤0.01, ****p≤0.0001. Abbreviations: cKO, intestinal-specific Cldn7 knockout mice, gKO, Cldn7 global knockout.

Similar articles

Cited by

References

    1. Aarons CB, Shanmugan S, Bleier JI. (2014). Management of malignant colon polyps: current status and controversies. World J Gastroenterol, 20(43):16178–83. - PMC - PubMed
    1. Simon K (2016). Colorectal cancer development and advances in screening. Clin Interv Aging, 11:967–76. - PMC - PubMed
    1. Ding L, Lu Z, Foreman O, Tatum R, Lu Q, Renegar R, Chen YH. (2012). Inflammation and Disruption of the Mucosal Architecture in Claudin-7-Deficient Mice. Gastroenterology, 142(2):305–15. - PMC - PubMed
    1. Li W, Xu C, Wang K, Li T, Wang X, Yang H, Xing T, Li WX, Chen YH, Gao H, Ding L. (2018). Severe Intestinal Inflammation in the Small Intestine of Mice Induced by Controllable Deletion of Claudin-7. Dig Dis Sci, 63(5):1200–1209. - PMC - PubMed
    1. Xing T, Benderman L, Sabu S, Parker J, Yang J, Lu Q, Ding L, Chen YH. (2020). Tight Junction Protein Claudin-7 is Essential for Intestinal Epithelial Stem Cell Self-Renewal and Differentiation. Cell Mol Gastroenterol Hepatol, 9(4):641–659. - PMC - PubMed