. 2024 Apr 10;20(4):e1011951.
doi: 10.1371/journal.pcbi.1011951. eCollection 2024 Apr.

Perturbation Variability Does Not Influence Implicit Sensorimotor Adaptation

Affiliations

Perturbation Variability Does Not Influence Implicit Sensorimotor Adaptation

Tianhe Wang et al. PLoS Comput Biol. .

Abstract

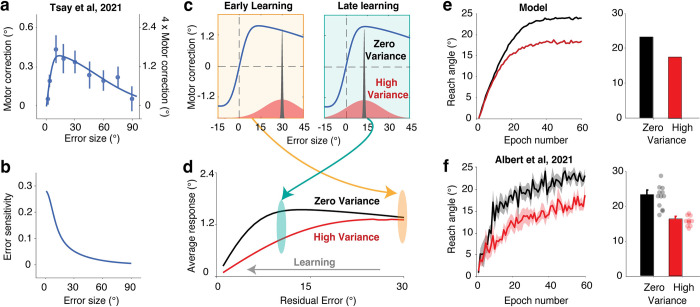
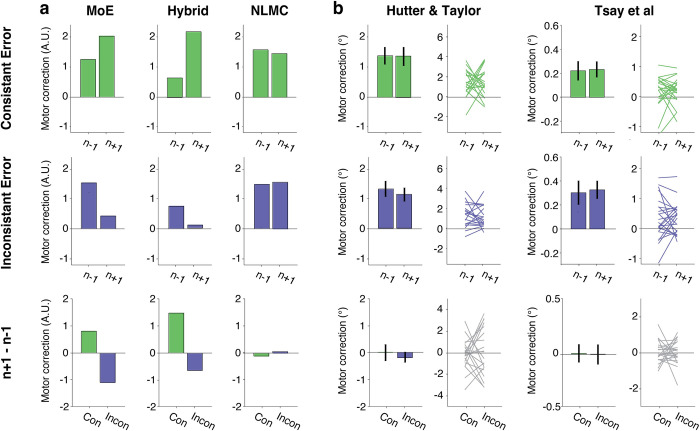
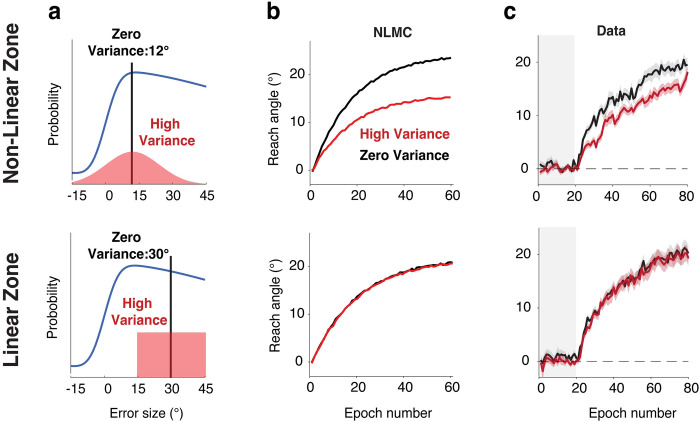
Implicit adaptation has been regarded as a rigid process that automatically operates in response to movement errors to keep the sensorimotor system precisely calibrated. This hypothesis has been challenged by recent evidence suggesting flexibility in this learning process. One compelling line of evidence comes from work suggesting that this form of learning is context-dependent, with the rate of learning modulated by error history. Specifically, learning was attenuated in the presence of perturbations exhibiting high variance compared to when the perturbation is fixed. However, these findings are confounded by the fact that the adaptation system corrects for errors of different magnitudes in a non-linear manner, with the adaptive response increasing in a proportional manner to small errors and saturating to large errors. Through simulations, we show that this non-linear motor correction function is sufficient to explain the effect of perturbation variance without referring to an experience-dependent change in error sensitivity. Moreover, by controlling the distribution of errors experienced during training, we provide empirical evidence showing that there is no measurable effect of perturbation variance on implicit adaptation. As such, we argue that the evidence to date remains consistent with the rigidity assumption.


Conflict of interest statement

I have read the journal’s policy and the authors of this manuscript have the following competing interests: RBI is a co-founder with equity in Magnetic Tides, Inc.

Figures

Fig 1
Fig 1. A non-linear motor correction function is sufficient to explain the effect of perturbation variability.
| a) Changes in reach angle from trial n to n + 1 as a function of the error size on trial n in Tsay et al. (2021) [20]. Dots represent group median values for each error size and bars represent the standard error of the means. We used these data to estimate the motor correction function given the relatively high sampling density. Solid line denotes the best-fitting model. The y-axis is double labeled: The left side uses the original scale from [20] whereas the scale is increased by 4-fold on the right side. We use the right-side scale in our simulations of published data to provide a match with the baseline learning rate reported in Albert et al. (2021) [11]. We note that the learning function in [20] was likely attenuated due to the methods employed in that study (see Method: Model Simulations). b) Error sensitivity, defined as the motor correction divided by error size, reduces monotonically as error size increases. c) Perturbation variability impacts the distribution of experienced errors (red, high variability; black, low variability). This in turn will dictate the distribution of motor corrections. d) When the error is large at the start of learning (e.g., ~30°), the average response is similar between the low- and high-variance conditions. However, as learning unfolds, the error distribution for the high-variance condition will span the concave region of the motor correction function (e.g., ~10°), resulting in attenuation of the average motor correction. e-f) The learning function of implicit adaptation predicted by the non-linear motor correction (NLMC) model (e) provides a good approximation of the empirical results from Experiment 6 of Albert et al. (2021) [11]. (f). The right panels for each row show the reach angle late in learning. For Albert et al. (2021) [11], shaded areas (left) and error bars (right) indicate standard error, and dots indicate data for each individual.
Fig 2
Fig 2. Trial-by-trial adaptation does not support the Memory of Errors model.
| a) The effect of immediate error history on motor corrections as predicted by the MoE model (left), a hybrid variant of the MoE model (middle) and the NLMC model (right). The motor correction on these trials is plotted as a function of whether the sign of the error on trial n was consistent in sign (top) or inconsistent (middle). The bottom row shows the difference in motor correction on trials n+1 relative to n-1 for the consistent (Con) and inconsistent (Incon) conditions. The MoE and Hybrid models predict a difference in motor correction, with an enhancement on trial n+1 when the sign is consistent and attenuation when the sign is inconsistent. The NLMC model predicts that the motor correction will be invariant. b) Empirical results from two studies that used different methods to estimate implicit adaptation. Left: Hutter and Taylor (2018) [13]; Right: Tsay et al. (2021) [20]. There was no evidence of an effect of recent error history in either data set. Error bars indicate S.E.
Fig 3
Fig 3. Influence of error variance on adaptation in the clamp rotation task.
| a) Distribution of clamp sizes in Exp 1 (top) and Exp 2 (bottom). In Exp 1, the mean was at 12° for both the High (red) and Zero (black) conditions, with the distribution for the High condition spanning the non-linear zone of the response correction function. In Exp 2, the mean was at 30° and the distribution for the High condition was restricted to the linear, descending zone of the response correction function. b) Simulations of adaptation functions based on the NLMC model. We do not visualize the prediction of the MoE given that it predicts asymptotic values greater than 100°. c) Experimental results in both experiments are consistent with the predictions of the NLMC model. Gray area indicates the no-feedback baseline. Shaded area indicates SE.

References

    1. Burge J, Ernst MO, Banks MS. The statistical determinants of adaptation rate in human reaching. J Vis. 2008;8: 20.1–19. doi: 10.1167/8.4.20 - DOI - PMC - PubMed
    1. Herzfeld DJ, Vaswani PA, Marko MK, Shadmehr R. A memory of errors in sensorimotor learning. Science. 2014;345: 1349–1353. doi: 10.1126/science.1253138 - DOI - PMC - PubMed
    1. Gonzalez Castro LN, Hadjiosif AM, Hemphill MA, Smith MA. Environmental consistency determines the rate of motor adaptation. Curr Biol. 2014;24: 1050–1061. doi: 10.1016/j.cub.2014.03.049 - DOI - PMC - PubMed
    1. Taylor JA, Krakauer JW, Ivry RB. Explicit and Implicit Contributions to Learning in a Sensorimotor Adaptation Task. Journal of Neuroscience. 2014;34: 3023–3032. doi: 10.1523/JNEUROSCI.3619-13.2014 - DOI - PMC - PubMed
    1. Taylor JA, Ivry RB. Cerebellar and prefrontal cortex contributions to adaptation, strategies, and reinforcement learning. Prog Brain Res. 2014;210: 217–253. doi: 10.1016/B978-0-444-63356-9.00009-1 - DOI - PMC - PubMed

Publication types