. 2024 Apr 10;16(742):eadk3506.
doi: 10.1126/scitranslmed.adk3506. Epub 2024 Apr 10.

Synovial fibroblast gene expression is associated with sensory nerve growth and pain in rheumatoid arthritis

Collaborators, Affiliations

Synovial fibroblast gene expression is associated with sensory nerve growth and pain in rheumatoid arthritis

Zilong Bai et al. Sci Transl Med. .

Abstract

It has been presumed that rheumatoid arthritis (RA) joint pain is related to inflammation in the synovium; however, recent studies reveal that pain scores in patients do not correlate with synovial inflammation. We developed a machine-learning approach (graph-based gene expression module identification or GbGMI) to identify an 815-gene expression module associated with pain in synovial biopsy samples from patients with established RA who had limited synovial inflammation at arthroplasty. We then validated this finding in an independent cohort of synovial biopsy samples from patients who had early untreated RA with little inflammation. Single-cell RNA sequencing analyses indicated that most of these 815 genes were most robustly expressed by lining layer synovial fibroblasts. Receptor-ligand interaction analysis predicted cross-talk between human lining layer fibroblasts and human dorsal root ganglion neurons expressing calcitonin gene-related peptide (CGRP+). Both RA synovial fibroblast culture supernatant and netrin-4, which is abundantly expressed by lining fibroblasts and was within the GbGMI-identified pain-associated gene module, increased the branching of pain-sensitive murine CGRP+ dorsal root ganglion neurons in vitro. Imaging of solvent-cleared synovial tissue with little inflammation from humans with RA revealed CGRP+ pain-sensing neurons encasing blood vessels growing into synovial hypertrophic papilla. Together, these findings support a model whereby synovial lining fibroblasts express genes associated with pain that enhance the growth of pain-sensing neurons into regions of synovial hypertrophy in RA.


Conflict of interest statement

Competing interests: The authors declare that they have no competing interests.

Figures

Fig. 1.
Fig. 1.. Pain is related to synovial inflammation in patients with RA with high, but not low, synovial inflammation.
(A) RA pain scores are shown compared to synovial tissue inflammatory classification in n=139 patients. (B) RA pain scores are shown according to cell density (in cells per square millimeter) of H&E (hematoxylin and eosin)–stained synovial tissue, in samples classified as high (n=35,r=0.40,P=0.048) or low inflammatory (n=104,r=0.08,P=0.53). ns, not significant in Mann-Whitney test. r= Spearman’s rank correlation coefficient. P= two-tailed P value.
Fig. 2.
Fig. 2.. A synovial gene expression signature that correlates with synovial histologic cell density was identified using GbGMI or PCA.
(A) An expression heatmap is shown of the top 5000 most variably expressed genes in 38 patients. Gene expression amounts (rows) are represented as z scores for all patients. Patients (columns) are sorted by their mean nuclei densities. (B) Shown is a similarity matrix of synovial histologic cell densities. (C) Laplacian scores are shown for the top 5000 most variably expressed genes measuring how their expression varied compared with synovial histologic cell density similarity structure. Each dot represents a gene, sorted by Laplacian score in ascending order. (D) Shown is the −log(P value) of the correlation of the top k–ranked groups of genes with nucleus density similarity structure. Each dot represents a group of genes. (E) Synovial histologic cell density is shown according to PC1 score of the top 5000 most variably expressed genes in 38 patients (Spearman ρ=0.21, P=0.21). (F) Synovial histologic cell density is shown according to the summary score of the 5000 genes over the 38 patients (Spearman ρ=0.4, P=0.01). (G) Synovial histologic cell density is shown according to the summary score of the 2713 GbGMi-identified genes over the 38 patients (Spearman ρ=0.59, P=0.0001). Statistics presented in (E) to (G) indicate Spearman correlation coefficient and P value.
Fig. 3.
Fig. 3.. GbGMI identified a pain-associated synovial gene expression in patients with established and early RA.
(A) An expression heatmap is shown of 2227 genes with increased expression in low inflammatory synovium. Patients (columns) were grouped by inflammatory amounts: high (n=12) versus low (n=22, low and mixed inflammatory subtypes identified in (9). (B) Similarity structure is shown of HOOS/KOOS pain scores over patients. (C) Laplacian scores of the input 2227 genes measure how their expression amounts over patients relate to the pain score–based similarity structure. Each dot represents a gene sorted by Laplacian score in ascending order. (D) Significance of the correlation between the top k–ranked genes and HOOS/KOOS pain scores is shown. Each dot represents a group of genes. (E) Established RA HOOS/KOOS pain score according to the summary score of the 815 GbGMi-identified genes in low inflammatory samples (Kendall τ=0.5, P=0.001). (F) Comparison between the same pair of scores as (E) but for all samples, irrespective of inflammatory status (Kendall τ=0.23, P=0.06). (G) Early RA VAS pain scores are shown according to gene expression summary score of 738 GbGMi-identified pain-associated genes in patients with low inflammatory (fibroid or unassigned) synovial pathotype (Kendall τ=0.35,P=0.02). (H) Comparison between the same pair of scores as (G) but for all patients, irrespective of synovial pathotype (Kendall τ=0.15, P=0.04). z score was calculated from gene expression values over patients. Statistics presented in (E) to (H) indicate Kendall correlation coefficient and P value.
Fig. 4.
Fig. 4.. The GbGMI-identified pain-associated gene signature is expressed by synovial lining layer fibroblasts.
(A) g:Profiler pathway enrichment analysis is shown of 815 pain-associated genes and 1412 nonpain-associated low inflammatory genes. ncRNA, long noncoding RNA; miRNA, microRNA. (B) Mean gene expression z scores of pain-associated genes and nonpain-associated genes detected in sorted bulk B cells (CD45+, CD3, and CD19+), fibroblasts (CD45, CD31, and PDPN+), monocytes (CD45+ and CD14+), and T cells (CD45+ and CD3+) are shown. z score is calculated on the basis of TPM normalized counts. ***P < 0.001. (C) Per-sample gene expression z scores of 769 pain-associated genes detected in sorted cell types from (B) are shown. (D) An expression heatmap is shown of 797 pain genes with nonzero variance in expression values across a subset (n=4354) of RA synovial cells (SC) in 18 unique cell populations (of B cells, SC-B1 to SC-B4; fibroblasts, SC-F1 to SC-F4; monocytes, SC-M1 to SC-M4; and T cells, SC-T1 to SC-T6), which were identified from the 5265 scRNA-seq profiles by an integrated analysis based on canonical-correlation analysis (CCA) from the Accelerating Medicine Partnership (19). z score is calculated on the basis of log2(CPM + 1)–transformed UMI counts over the RA synovial cells. (E) Volcano plots of 794 pain genes in scRNA-seq profiles (ImmPort accession #SdY998) (19) with nonzero variance in expression values across the subset (n=1532) of RA synovial fibroblasts in three sublining subsets, CD34+ (SC-F1), HLA-DRAhi (SC-F2), and DKK3+ (SC-F3), and one lining subset (SC-F4) are shown. Each volcano plot shows the differential expression analysis (using Seurat function FindMarkers) of the genes in each RA synovial fibroblast subtype compared with the other three, where x axis shows log2(fold change) and y-axis −log(adjusted P value). The significantly increased genes are red, significantly decreased genes are blue, and nonsignificantly differentially expressed genes are gray. The horizontal and vertical red lines respectively indicate the threshold of significance [log(adjustedP=0.05)] and the separation threshold between increased and decreased gene expression log2(fold change) = 0.
Fig. 5.
Fig. 5.. Filtering on synovial fibroblast genes predicted to influence DRG sensory neurons.
(A) Shown are predicted ligand-receptor interactions between synovial fibroblasts and neurons in the human DRG (hDRG). The circos plot shows the two unidirectional interactomes between the four synovial fibroblast subtypes and 10 hDRG neuron subtypes. The outermost layer indicates the RA synovial fibroblast subtypes of the cells (in colored squares) or hDRG neuron subtypes (in colored round dots) expressing corresponding ligand or receptor genes. The middle layer shows whether a gene is ligand coding or receptor coding in its associated interactions. The inner layer contains gene names. The two tissue-wise directions are distinguished by the colors of connections between gene names. The number of connections associated with the ligand/receptor genes in each fibroblast subtype or neuron subtype and those in each unidirectional tissue-wise relation are summarized in the corresponding legends. (B) An expression heatmap is shown of 14 pain-associated ligand/receptor encoding marker genes of synovial lining fibroblast (SC-F4) cells with nonzero variance in expression values across a subset (n=4354) of RA synovial cells in 18 unique cell populations (of B cells, SC-B1 to SC-B4; fibroblasts, SC-F1 to SC-F4; monocytes, SC-M1 to SC-M4; and T cells, SC-T1 to SC-T6), which were identified from the 5265 scRNA-seq profiles by an integrated analysis based on CC A from the Accelerating Medicine Partnership (19). z score was calculated using log2(CPM + 1) transformed UMI counts over the RA synovial cells. The genes are ranked top-down by their log fold change in differential expression analysis (DEA) of lining fibroblast (SC-F4) versus other fibroblasts. (C) A Sankey plot is shown of top 25 unique fibroblast to hDRG ligand-receptor interactions from the 815 GbGMI pain-associated genes ranked by Laplacian score value. (D) A chord plot is shown depicting pathway analysis of hDRG receptors identified by the ligand receptor interactome by GbGMI pain-associated genes. The top enriched pathways suggest promotion of axon growth, including axon guidance, extracellular matrix (ECM)–receptor interaction, regulation of actin cytoskeleton, and Rap1 signaling.
Fig. 6.
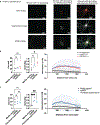
Fig. 6.. Synovial fibroblast products affect DRG neurons in vitro.
(A) Shown are representative images of the method used for neurite quantification of sprouting and Sholl analysis of branching of dissociated DRG neurons. (B) Quantification of CGRP+ DRG neurons cultured with medium alone, huNGF, or huNTN4 is shown. Left: Survival was measured by the number of Map2b+B3tub+ cells of >10 μm. Each dot represents the sum of five ×10 magnification views from one experiment. Data from four experiments are presented. ns indicates not significant in Kruskal-Wallis test. Middle: The sum of sprouting neurons divided by the total number of neurons cultured with medium alone, huNGF, or huNTN4 is shown. Neurons with at least three axon branches greater than two times the size of the soma were classified as sprouting. Each dot represents the sum of five ×10 magnification views from one experiment. Data from four experiments are presented. *P < 0.05, ns indicates not significant in Kruskal-Wallis test. Right: Branching is shown as measured by the number of shell intersections of neurites, in DRG neurons cultured with medium alone (no treatment), huNGF, or huNTN4. Each dot represents the median with confidence interval of 40 neurons imaged from four experiments (10 neurons per experiment). ****P < 0.0001 in two-way ANO VA group*radius interaction with post hoc Dunnett’s multiple comparisons of each treatment group with the no treatment group. (C) Quantification of CGRP+ DRG neurons cultured with medium alone, medium supplemented with huNGF, or RA synovial fibroblast–conditioned medium is shown. Left: Survival was measured by the number of Map2b+B3tub+ CGRP+ cells of >10 μm. Each dot represents the sum of five ×10 magnification views from one experiment. data from three experiments are presented. ns indicates not significant in Kruskal-Wallis test. Middle: The sum of sprouting neurons divided by the total number of neurons cultured with medium alone, medium supplemented with hunGF, or RA synovial fibroblast–conditioned medium is shown. neurons with at least three axon branches greater than two times the size of the soma were classified as sprouting. Each dot represents the sum of five ×10 magnification views from one experiment. data from three experiments are presented. **P < 0.01 and ***P < 0.001 in Kruskal-Wallis tests. right: Branching is shown as measured by the number of shell intersections of neurites in DRG neurons cultured with medium alone, medium supplemented with hunGF, or RA synovial fibroblast–conditioned medium. Each dot represents the median with confidence interval of 45 neurons imaged from three experiments (15 neurons per experiment). *P < 0.05 and **P < 0.01 in two-way ANOVA group*radius interaction with post hoc Dunnett’s multiple comparisons of each treatment group with the no treatment group.
Fig. 7.
Fig. 7.. RA synovial papillary hypertrophy processes contain CGRP+ nociceptive neurites encasing CD31+ vessels.
(A) Gross macroscopic image of RA synovial papillary hypertrophy with visible blood vessels is shown. (B) H&E-Stained section of RA synovial papillary hypertrophy is shown with minimal lymphocytic infiltration. Scale bar, 50 μm. (C) Whole-mount imaging (iDISCO) is shown from low inflammatory RA synovium stained with anti-CD31 antibodies (magenta) and anti-CGRP antibodies (cyan) (see also movie S1). Scale bar, 300 μm. (D) Whole-mount imaging is shown from inside a papillary process stained with anti-CD31 antibodies (magenta) and anti-CGRP antibodies (cyan) (see also movie S2). Scale bars, 200 μm. (E) Three consecutive optical cross sections of synovial tissue stained with anti-CD31 antibodies (magenta) and anti-CGRP antibodies (cyan) are shown. Scale bars, 50 μm.

References

    1. Marchand F, Perretti M, McMahon SB, Role of the immune system in chronic pain. Nat. Rev. Neurosci. 6, 521–532 (2005). - PubMed
    1. Alivernini S, Firestein GS, McInnes IB, The pathogenesis of rheumatoid arthritis. Immunity 55, 2255–2270 (2022). - PubMed
    1. Buch MH, Eyre S, McGonagle D, Persistent inflammatory and non-inflammatory mechanisms in refractory rheumatoid arthritis. Nat. Rev. Rheumatol. 17, 17–33 (2021). - PubMed
    1. Nagy G, Roodenrijs NM, Welsing PM, Kedves M, Hamar A, van der Goes MC, Kent A, Bakkers M, Blaas E, Senolt L, Szekanecz Z, Choy E, Dougados M, Jacobs JW, Geenen R, Bijlsma HW, Zink A, Aletaha D, Schoneveld L, van Riel P, Gutermann L, Prior Y, Nikiphorou E, Ferraccioli G, Schett G, Hyrich KL, Mueller-Ladner U, Buch MH, McInnes IB, van der Heijde D, van Laar JM, EULAR definition of difficult-to-treat rheumatoid arthritis. Ann. Rheum. Dis. 80, 31–35 (2021). - PMC - PubMed
    1. Lee YC, Frits ML, Iannaccone CK, Weinblatt ME, Shadick NA, Williams DA, Cui J, Subgrouping of patients with rheumatoid arthritis based on pain, fatigue, inflammation, and psychosocial factors. Arthritis Rheum. 66, 2006–2014 (2014). - PMC - PubMed

Publication types

Substances