. 2024 Apr 10;146(16):11272-11288.
doi: 10.1021/jacs.4c00548. Online ahead of print.

Bifurcation of Excited-State Population Leads to Anti-Kasha Luminescence in a Disulfide-Decorated Organometallic Rhenium Photosensitizer

Affiliations

Bifurcation of Excited-State Population Leads to Anti-Kasha Luminescence in a Disulfide-Decorated Organometallic Rhenium Photosensitizer

Julia Franz et al. J Am Chem Soc. .

Abstract

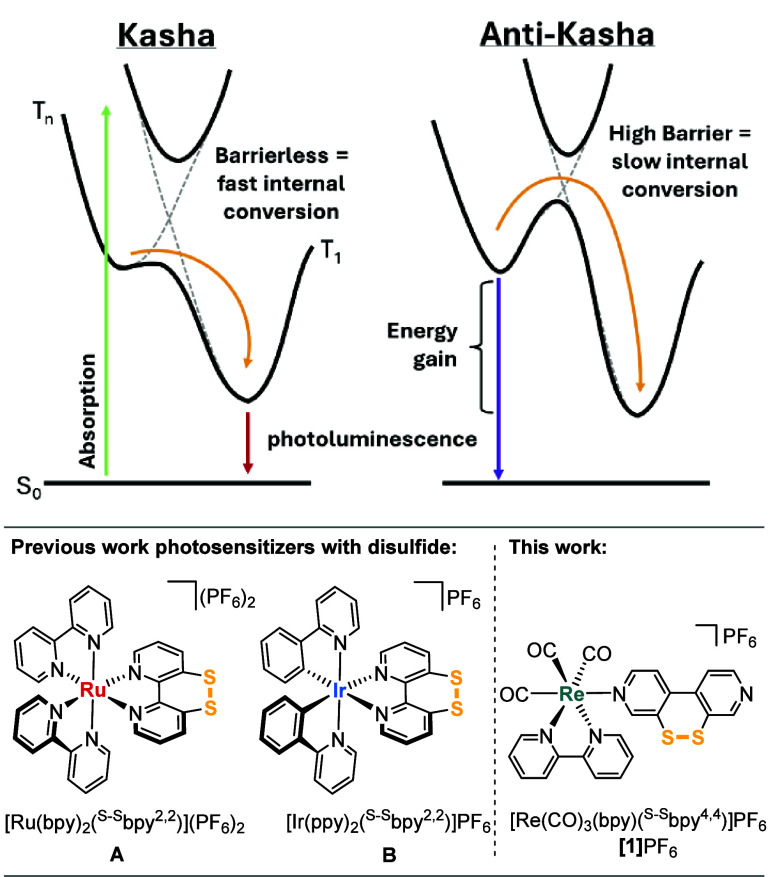
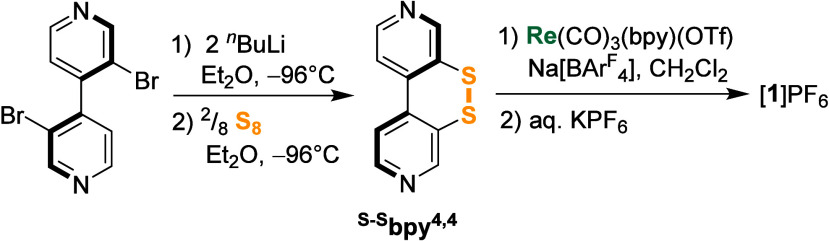
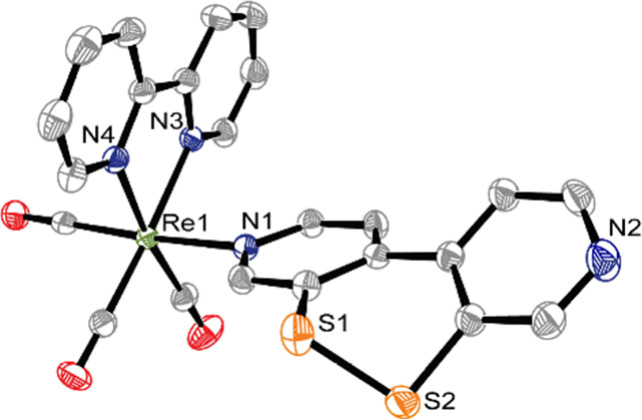
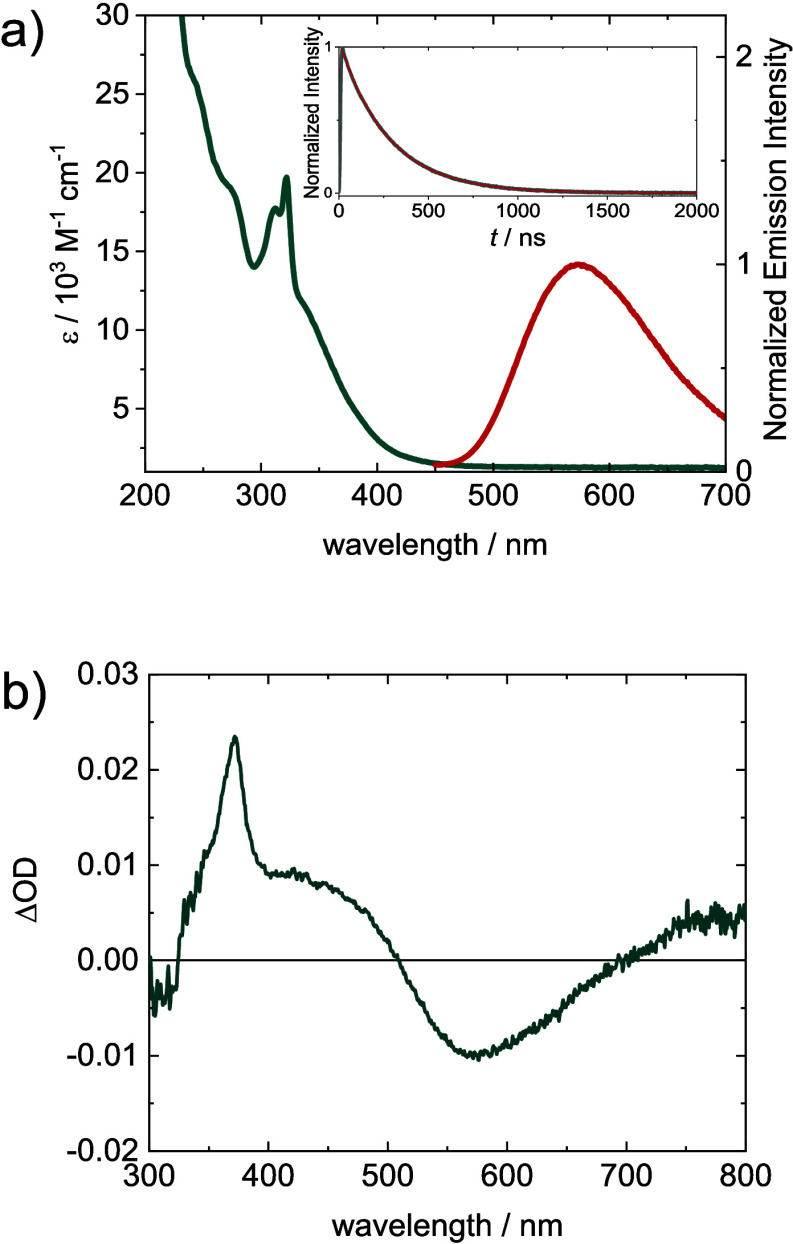
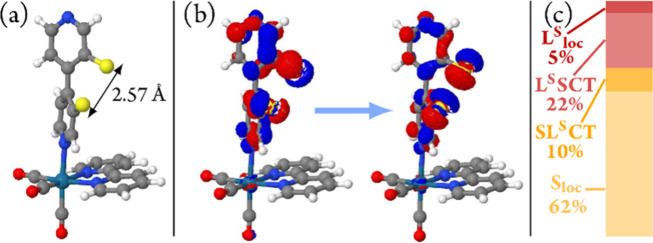
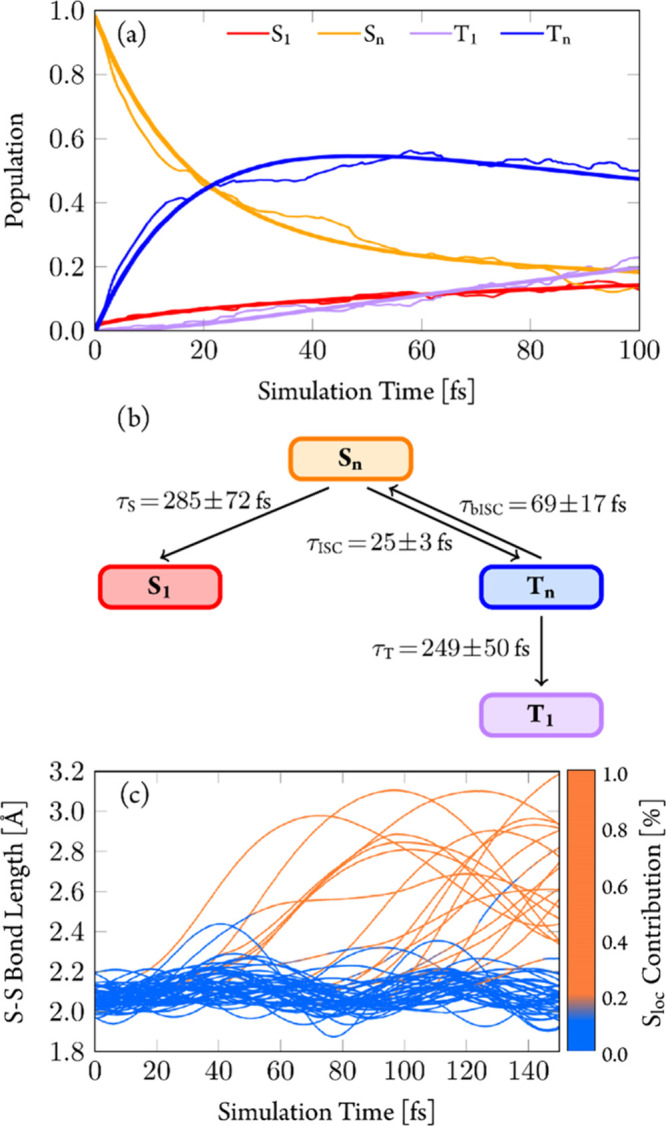
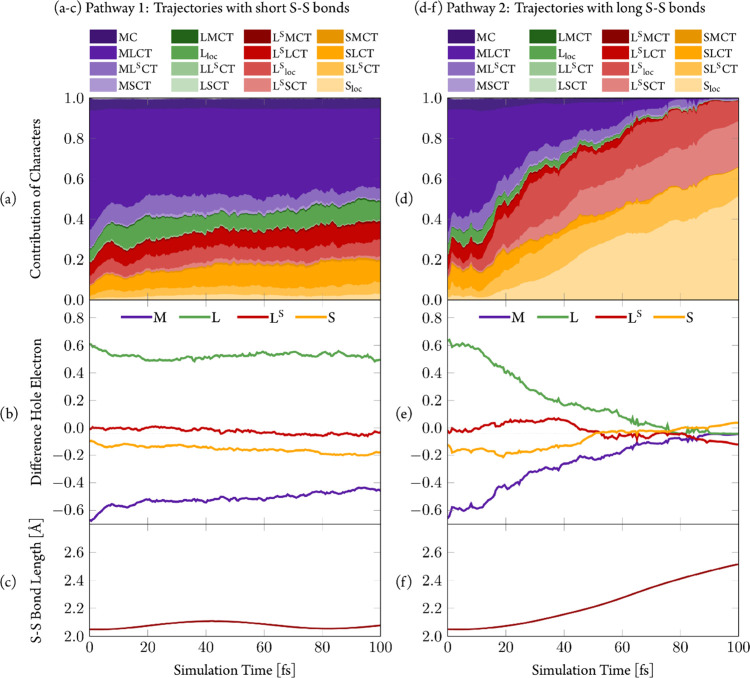
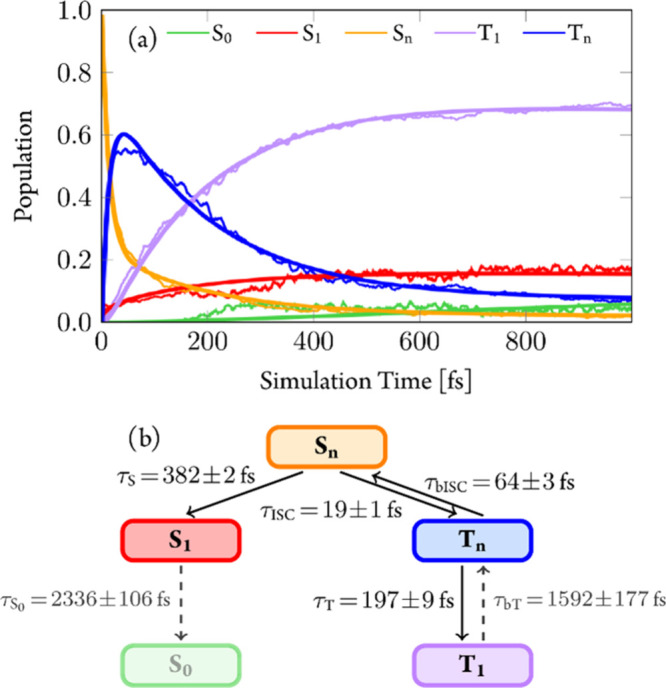
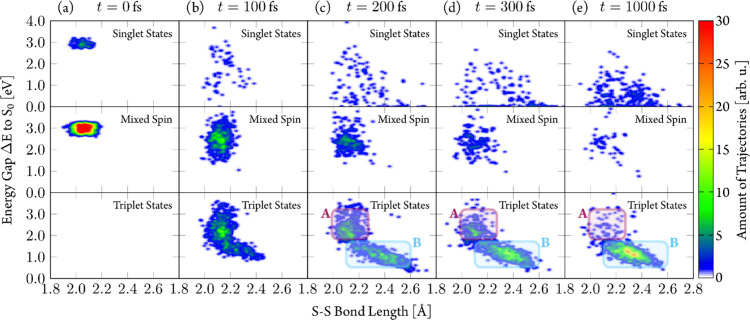
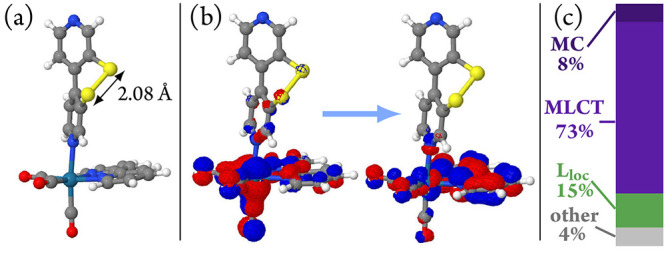
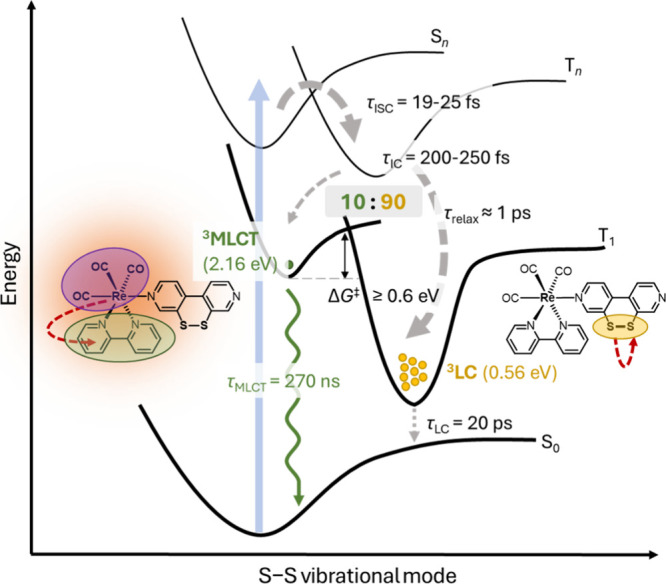
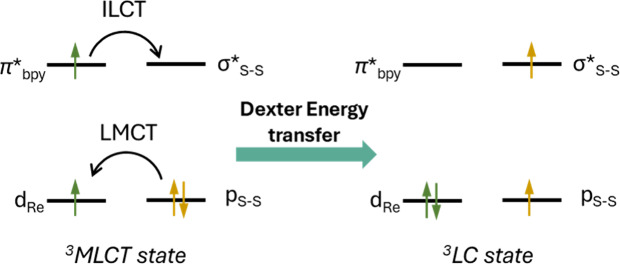
We report a rhenium diimine photosensitizer equipped with a peripheral disulfide unit on one of the bipyridine ligands, [Re(CO)3(bpy)(S-Sbpy4,4)]+ (1+, bpy = 2,2'-bipyridine, S-Sbpy4,4 = [1,2]dithiino[3,4-c:6,5-c']dipyridine), showing anti-Kasha luminescence. Steady-state and ultrafast time-resolved spectroscopies complemented by nonadiabatic dynamics simulations are used to disclose its excited-state dynamics. The calculations show that after intersystem crossing the complex evolves to two different triplet minima: a (S-Sbpy4,4)-ligand-centered excited state (3LC) lying at lower energy and a metal-to-(bpy)-ligand charge transfer (3MLCT) state at higher energy, with relative yields of 90% and 10%, respectively. The 3LC state involves local excitation of the disulfide group into the antibonding σ* orbital, leading to significant elongation of the S-S bond. Intriguingly, it is the higher-lying 3MLCT state, which is assigned to display luminescence with a lifetime of 270 ns: a signature of anti-Kasha behavior. This assignment is consistent with an energy barrier ≥ 0.6 eV or negligible electronic coupling, preventing reaction toward the 3LC state after the population is trapped in the 3MLCT state. This study represents a striking example on how elusive excited-state dynamics of transition-metal photosensitizers can be deciphered by synergistic experiments and state-of-the-art calculations. Disulfide functionalization lays the foundation of a new design strategy toward harnessing excess energy in a system for possible bimolecular electron or energy transfer reactivity.


Conflict of interest statement

The authors declare no competing financial interest.

Figures

Figure 1
Figure 1
Top: Energy diagrams of Kasha (left) and anti-Kasha behavior (right) due to slow internal conversion (IC) between higher- and lower-energy states (adapted from ref (7)). Bottom: Structures of complexes with sulfurated ligand S–Sbpy2,2A,,B, and complex [1]PF6 investigated herein.
Scheme 1
Scheme 1. Synthesis of the Ligand S–Sbpy4,4 and Complex [1]PF6
Figure 2
Figure 2
ORTEP drawing of 1+ (thermal ellipsoids at 50% probability level); hydrogen atoms, counterions, and solvent molecules are omitted for clarity. Selected bond lengths [Å]: Re1–C21 1.932(3), Re1–C22 1.918(3), Re1–C23 1.925(3), Re1–N1 2.214(2), Re1–N3 2.171(2), Re1–N4 2.164(2), S1–S2 2.059(2).
Figure 3
Figure 3
(a) UV–vis absorption (green line) and emission spectra (red line, excitation at 370 nm) of [1]PF6 (25 μM) in deaerated THF. Inset: Time-resolved emission decay at 573 nm (excitation at 355 nm), with monoexponential fit (270 ns). (b) Transient absorption spectrum in deaerated THF measured in a time window of 20 ns after excitation at 355 nm.
Figure 4
Figure 4
(a) FTIR spectrum of [1]PF6 in THF. (b) Transient difference spectra of [1]PF6 in THF recorded after 400 nm excitation at time delays as indicated. The purple arrow at the 2030 cm–1 peak is a guide for the eye; see below for explanation. (c) Calculated CO stretching frequencies for the ground-state S0 and the triplet minima T1SSlong (of 3LC character, see below) and T1SSshort (of 3MLCT character, see below). See Discussion for details.
Figure 5
Figure 5
Time traces for the data of Figure 4b at selected probe frequencies with exponential fits.
Figure 6
Figure 6
Relaxed scan around the Re–N bond of the axial ligand (indicated by the arrow at structure I) of 1+ at the PBE0/TZVP level of theory in the gas phase. The scanned dihedral angle is indicated in orange in the molecular structures. Percentages refer to Boltzmann populations at T = 300 K.
Figure 7
Figure 7
(a) Comparison of experimental absorption spectrum of [1]PF6 in THF solution (black, dotted line) and calculated absorption spectrum of 1+ (PBE0/TZVP; blue, solid line) in the gas phase. (b) Fragmentation of the complex used in the transition-density matrix analysis. (c) Electronic character of states contributing to the spectrum. (d) Electron–hole difference population in the spectrum.
Figure 8
Figure 8
(a) Optimized geometry of the lowest-lying triplet state starting from the Franck–Condon geometry. (b) Natural transition orbitals characterizing the T1 state at this geometry, called the T1SSlong state. (c) Transition-density matrix analysis of the T1SSlong state, showing its predominant 3LC character.
Figure 9
Figure 9
(a) Adiabatic electronic-state populations from TDDFT/SH dynamics. Higher-lying singlet and triplet states combined to one line each. Thick lines represent fitted curves according to the mechanism shown in (b). (c) Time evolution of S–S bond length for individual trajectories. Color coding for the amount of Sloc excitation character from the transition-density matrix analysis.
Figure 10
Figure 10
Transition density matrix analysis of the trajectories in pathway 1 (a–c, short S–S bonds) and pathway 2 (d–f, long S–S bonds). (a/d) Character of trajectories. (b/e) Electron–hole difference population. (c/f) S–S bond length. All quantities averaged over all trajectories in the respective pathway.
Figure 11
Figure 11
(a) Time evolution of the adiabatic electronic-state populations (thin lines) during the LVC/SH simulations and fits (thick lines) corresponding to the mechanism shown in (b).
Figure 12
Figure 12
Energy gap ΔE to the ground state S0 as a function of the S–S bond length of LVC/SH trajectories at different simulation times. Trajectories distinguished by spin expectation value as singlet states (⟨S2⟩ < 0.2), mixed spin states (0.2 < ⟨S2⟩ < 1.8), and triplet states (⟨S2⟩ > 1.8). Regions A and B identify clusters of trajectories characterized by energy gaps (ΔE) of 2.0 eV and S–S bond lengths of 2.1 Å (purple rectangle) and energy gaps (ΔE) around 1.0 eV and S–S bond lengths of 2.3–2.5 Å (blue rectangle), respectively.
Figure 13
Figure 13
(a) Optimized geometry of the lowest lying triplet state starting from the snapshots of region A of the LVC/SH dynamics. (b) Natural transition orbitals characterizing the T1 state at this geometry, labeled T1SSshort state. (c) Wave function analysis of the T1SSshort state showing its predominant 3MLCT character, so that this state will be also referred to as the 3MLCT state.
Figure 14
Figure 14
Energy diagram of the excited-state dynamics mechanism of [1]+.
Scheme 2
Scheme 2. Orbital View of the Dexter Energy Transfer Process between the MLCT and LC States via Two-Electron Exchange
Only the orbitals with the highest charge transfer character are shown.

References

    1. Hammarström L.; Hammes-Schiffer S. Artificial photosynthesis and solar fuels. Acc. Chem. Res. 2009, 42 (12), 1859–1860. 10.1021/ar900267k. - DOI - PubMed
    1. Crabtree G. W.; Lewis N. S. Solar energy conversion. Phys. Today 2007, 60 (3), 37–42. 10.1063/1.2718755. - DOI
    1. McConnell I.; Li G.; Brudvig G. W. Energy conversion in natural and artificial photosynthesis. Chem. Biol. 2010, 17 (5), 434–447. 10.1016/j.chembiol.2010.05.005. - DOI - PMC - PubMed
    1. Concepcion J. J.; House R. L.; Papanikolas J. M.; Meyer T. J. Chemical approaches to artificial photosynthesis. Proc. Natl. Acad. Sci. U. S. A. 2012, 109 (39), 15560–15564. 10.1073/pnas.1212254109. - DOI - PMC - PubMed
    1. Blankenship R. E.; Tiede D. M.; Barber J.; Brudvig G. W.; Fleming G.; Ghirardi M.; Gunner M. R.; Junge W.; Kramer D. M.; Melis A.; Moore T. A.; Moser C. C.; Nocera D. G.; Nozik A. J.; Ort D. R.; Parson W. W.; Prince R. C.; Sayre R. T. Comparing photosynthetic and photovoltaic efficiencies and recognizing the potential for improvement. Science 2011, 332 (6031), 805–809. 10.1126/science.1200165. - DOI - PubMed