. 2024 Jul 18;144(3):283-295.
doi: 10.1182/blood.2023022859.

NSD2 drives t(4;14) myeloma cell dependence on adenylate kinase 2 by diverting one-carbon metabolism to the epigenome

Affiliations

NSD2 drives t(4;14) myeloma cell dependence on adenylate kinase 2 by diverting one-carbon metabolism to the epigenome

Amin Sobh et al. Blood. .

Abstract

Chromosomal translocation (4;14), an adverse prognostic factor in multiple myeloma (MM), drives overexpression of the histone methyltransferase nuclear receptor binding SET domain protein 2 (NSD2). A genome-wide CRISPR screen in MM cells identified adenylate kinase 2 (AK2), an enzyme critical for high-energy phosphate transfer from the mitochondria, as an NSD2-driven vulnerability. AK2 suppression in t(4;14) MM cells decreased nicotinamide adenine dinucleotide phosphate (NADP[H]) critical for conversion of ribonucleotides to deoxyribonucleosides, leading to replication stress, DNA damage, and apoptosis. Driving a large genome-wide increase in chromatin methylation, NSD2 overexpression depletes S-adenosylmethionine, compromising the synthesis of creatine from its precursor, guanidinoacetate. Creatine supplementation restored NADP(H) levels, reduced DNA damage, and rescued AK2-deficient t(4;14) MM cells. As the creatine phosphate shuttle constitutes an alternative means for mitochondrial high-energy phosphate transport, these results indicate that NSD2-driven creatine depletion underlies the hypersensitivity of t(4;14) MM cells to AK2 loss. Furthermore, AK2 depletion in t(4;14) cells impaired protein folding in the endoplasmic reticulum, consistent with impaired use of mitochondrial adenosine triphosphate (ATP). Accordingly, AK2 suppression increased the sensitivity of MM cells to proteasome inhibition. These findings delineate a novel mechanism in which aberrant transfer of carbon to the epigenome creates a metabolic vulnerability, with direct therapeutic implications for t(4;14) MM.


Conflict of interest statement

Conflict-of-intreset disclosure: C.S.M. serves on the scientific advisory board of Adicet Bio and discloses consultant/honoraria from Genentech, Nerviano, Secura Bio and Oncopeptides, and research funding from EMD Serono, Karyopharm, Sanofi, Nurix, Bristol Myers Squibb, H3 Biomedicine/Eisai, Springworks, Abcuro, Novartis, and Opna Bio. The remaning authors declare no competing financial intresets.

Figures

None
Graphical abstract
Figure 1.
Figure 1.
NSD2 overexpression drives metabolic dependencies in MM. (A) Immunoblot analysis confirming the decrease in NSD2 levels and H3K36me2 levels in TKO compared to NTKO isogenic MM cells derived from KMS11. (B) Workflow of genome wide CRISPR screening in NTKO and TKO MM cells. (C-D) MAGeCK-generated gene essentiality (Beta) scores plotted vs gene ranks. Essential genes for NTKO and TKO cells (MAGeCK FDR < 0.1) are indicated in red and blue, respectively. (E) Venn diagram showing common and differentially essential genes between NTKO and TKO cells. (F) Scatter plot of NTKO and TKO Beta scores. Genes that are more essential for NTKO cells (difference in Beta scores > 0.5; FDR < 0.1) are shown in red. (G-I) ShinyGO gene ontology (GO) analyses of the 282 genes defined to be more essential in NTKO than TKO cells. FDRs of the significant GO terms are plotted against the corresponding number of gene hits in each term.
Figure 2.
Figure 2.
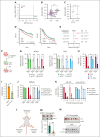
NSD2 overexpression increases MM cell dependence on AK2. (A) Plot of MAGeCK-generated AK2 Beta scores and the corresponding FDRs in NTKO and TKO cells. (B) Depmap AK2 dependency scores across different cancer cell line lineages (red - MM cell lines; blue - other hematologic cell lines; grey - solid cancer cell lines). t(4;14) MM cell lines are labeled. (C) Comparison of AK2 dependency scores between t(4;14) and non-t(4;14) MM cell lines. In B and C, horizontal lines represent median gene effect scores. P < .05 Mann-Whitney, one-sided. (D) Kaplan-Meier curves showing overall survival (OS and PFS of patients with MM stratified by AK2 expression into low (Q1; blue), mid (Q2+Q3; green), and high (Q4; red). P value were calculated by Cox proportional hazards regression. (E) Hazard ratio of AK2 expression associated with OS and PFS in t(4;14) (red) and other (blue) patients with MM as determined using Cox proportional hazards regression. Lines represent 95% confidence intervals RNAseq and WGS. P value and cohort sizes are shown (total N = 725, baseline patients with CoMMpass). (F) Schematic representation of confirmatory in vitro competitive growth assays used for validating essential genes. (G) Time-dependent depletion of GFP-positive NTKO and TKO isogenic cells after transduction with LentiCRISPRv2-GFP expressing the indicated sgRNAs. sgROSA and sgPCNA were used as negative and positive controls, respectively. (H) Comparison of time-dependent depletion of GFP-positive cells harboring sgAK2 in NTKO, TKO, and NSD2-replete TKO cells. (I) Competitive growth of nonlabeled NTKO and GFP-labeled TKO cells treated with DMSO or the AK2 inhibitor AP5A (50 μM) for 72 h. (J) Time-dependent depletion of control and NSD2-depleted KMS34 cells after transduction with LentiCRISPRv2-GFP expressing the indicated sgRNAs. Cells were transduced with LentiCRISPRv2 expressing a nontargeting (sgNT) or NSD2-targeting (sgNSD2) sgRNA and selected with puromycin before transduction with the LentiCRISPRv2-GFP constructs. All experiments were performed in biological triplicate. (K) Time-dependent depletion of t(4;14) and non-t(4;14) MM cell lines transduced with inducible Cas9/GFP/sgAK2 (TLCV2) vectors. Percentage of GFP-positive cells were measured at the indicated times by flow cytometry. Experiments were performed in biological duplicate. (L) Subcutaneous flank injections of cells expressing doxycycline-inducible scrambled (shSc) or AK2-targeting (shAK2) shRNA into NOD/SCID mice. Mice were fed a doxycycline chow diet. (M) KMS11-derived tumors isolated from the left (shSc) and right (shAK2) mouse flanks. Tumor dimensions were measured using a caliper and the volumes were calculated using the following formula: V = ½ L x W2. (N) Tumors derived from shSc-expressing LP1 cells. No tumors from AK2-depleted LP1 cells were detected. Immunoblots confirming continued AK2 expression in isolated LP1-derived tumors are shown. ∗∗P < . 01, ∗∗∗P < . 001, and ∗∗∗∗P < . 0001. DMSO, dimethyl sulfoxide; sgROSA, sgRNA targeting mouse Rosa26 locus; sgPCNA; TLCV2, LentiCRISPRv2 with Tet Response Element Promoter; WGS, whole genome sequencing.
Figure 3.
Figure 3.
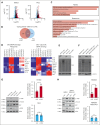
AK2 depletion increases MM cell sensitivity to proteasome inhibitors. (A) Schematic representation of the MeroGFP system. (B) Evaluation of unfolded protein load indicated by the ratio of reduced/oxidized GFP disulfide bonds measured at the indicated excitation wavelengths by flow cytometry 72 hours after transduction with the indicated shRNAs. (C-D) Immunoblot analyses of proteins involved in unfolded protein response and apoptosis signaling. Four independent experiments were performed 72 hours after transduction with the indicated IPTG induced shRNAs. (E-G) Incucyte cell proliferation assays in KMS11, LP1, and KMS18 cells expressing doxycycline-inducible shRNA-targeting AK2. Cells were treated with doxycycline (0.2 μg/mL), bortezomib (1nM), or a combination of both. (H) Immunoblot analysis showing levels of PARP and caspase 3 cleavage in KMS11 and LP1 cells with doxycycline-inducible shAK2 in the presence or absence of bortezomib. Immunoblots were performed 72 hours after doxycycline induction of AK2 knockdown. (I) Analysis of data from the MMRF CoMMpass study of patients treated with proteasome inhibitor comparing levels of AK2 expression between patients showing sustained response and those that are relapsed or deceased. (J) Kaplan-Meier curves showing overall survival of patients with MMwith high (fourthquartile) or low (first quartile) AK2 expression with or without PI therapy. (K) Comparison of relapse times between AK2-high (fourth quartile) and all other patients with MM treated with PIs. Data were analyzed using the MMRF Researcher Gateway. ∗P < .05, ∗∗P < .01. IPTG, isopropyl ß-D-1-thiogalactopyranoside; MMRF, Multiple Myeloma Research Foundation; PARP, poly(ADP-ribose) polymerase.
Figure 4.
Figure 4.
AK2 suppression induces DNA damage response in NSD2-overexpressing MM cells. (A) Volcano plots showing genes differentially expressed between AK2-depleted (shAK2) and control (shSc) NTKO and TKO MM cells plotted from RNA-seq data. FC: fold change shAK2/shSc. FDR: false discovery rate. (B) Area proportional Venn diagram of genes upregulated by AK2 suppression in NTKO and TKO MM cells plotted from RNA-seq data. (C) EnrichR pathway analysis of genes upregulated by AK2 suppression in NTKO cells. (D) Heatmaps of genes involved in DNA damage response and cytosolic DNA sensing plotted from RNAseq data of AK2-suppressed NTKO and TKO cells. (E-F) Immunoblot analysis showing protein PARylation in control and AK2-depleted KMS11 NTKO and TKO (E) or parental and NSD2-deficient KMS34 (F) isogenic cells. (G-H) Immunoblot analysis of basal levels of H2AX phosphorylation and cleaved PARP in control and AK2-depleted KMS11 NTKO and TKO (G) or parental and NSD2-deficient KMS34 (H) isogenic cells. Three independent experiments were performed 72 hours after transduction with the indicated shRNA constructs. ∗P <. 05.
Figure 5.
Figure 5.
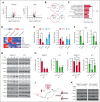
AK2 suppression in NSD2-overexpressing MM cells results in DNA replication stress by depleting dNTPs. (A) Volcano plots from metabolomic profiling showing metabolites altered by AK2 suppression in NTKO and TKO cells. (B) Venn diagrams showing metabolites upregulated and downregulated by AK2 depletion NTKO and TKO cells. (C) Pathway analysis of metabolites significantly altered by AK2 suppression in NTKO but not TKO cells. (D) Heatmap of the relative abundance of ribonucleotides and deoxyribonucleotides in AK2-depleted NTKO and TKO cells plotted from the metabolomics data. (E-F) Quantification of dATP and dGTP levels in control and AK2-depleted NSD2-high and -low MM cells by RT-based dNTP assays. All metabolite measurements were performed 72 hours after transduction with the indicated shRNAs in 3 biological replicates. (G) Time-course analysis of replication stress and apoptosis markers after IPTG induction of shAK2 in KMS11 and LP1 MM cell lines. Immunoblots for phosphorylated CHK1 and RPA were quantified by Image J and the signal was normalized to total CHK1 or RPA proteins, respectively. (H-I) In vitro competitive growth assays showing time-dependent depletion of GFP-positive cells after transduction with LentiCRISPRv2-GFP-sgAK2 in the presence and absence of 10× Embryomax nucleoside mix (rNs; 300 μM) or deoxynucleoside pools (dNs; 250 μM). Experiments were performed in 2 or 3 biological replicates as indicated by the individual replicate symbols. (J) Schematic representation of DNA replication fork stalling due to depletion of dNTP pools resulting from impaired RNR activity. (K) Immunoblot analysis of H2AX phosphorylation and PARP cleavage 72 hours after IPTG-induced AK2 depletion in KMS11 and LP1 cells in the presence and absence of 10 μM of the ATM kinase inhibitor (ATMi) KU55933. ∗P< .05, ∗∗P<.01.
Figure 6.
Figure 6.
AK2 suppression depletes NADP/H levels in NSD2-overexpressing MM cells. (A-B) Relative quantification of NADP/H in control (shSc) and AK2-depleted (shAK2) KMS11 and KMS34-derived NSD2-high (A) and NSD2-low (B) isogenic cells. The different colors indicate different biological replicates, and the dots represent technical replicates. (C) Relative quantification of NADP/H in control and AK2-depleted NTKO cells with and without creatine (Cr; 50mM) supplementation. (D) Relative quantification of NADP/H in control and AK2-depleted TKO cells with and without cyclocreatine (cCR; 10mM) treatment. NADP/H levels were measured by enzyme-based bioluminescent assays 72 hours after IPTG-induced AK2 knockdown. Experiments were performed in biological triplicate. (E) Schematic diagram of the proposed role of AK2 in dNTP homeostasis. RNR: ribonucleotide reductase. TrxR, thioredoxin reductase; NADK: NAD+ kinase; CK, creatine kinase. ∗∗P, 0.01, ∗∗∗P, 0.001.
Figure 7.
Figure 7.
NSD2-derived creatine depletion underlies increased dependence on AK2. (A) DNA methylation in KMS11 NTKO and TKO cells measured by whole-genome bisulfite sequencing (coverage at 19,190,528). (B) Differential abundance of metabolites related to SAM/creatine metabolism in NTKO and TKO MM cells. Relative guanidinoacetate, homocysteine, and spermidine levels were calculated from the metabolomics data. Creatine levels were determined using an enzyme-based fluorometric assay. (C) Immunoblot analysis of H2AX phosphorylation and PARP cleavage in KMS11 NTKO cells 72 hours after IPTG induction of AK2 suppression with and without creatine (50 mM) supplementation. (D) Time-dependent depletion of GFP-positive NTKO cells after transduction with LentiCRISPRv2-GFP-sgAK2 in the presence and absence of creatine (50 mM). (E) Immunoblot analysis of H2AX phosphorylation and PARP cleavage in KMS11 TKO cells 72 hours after IPTG induction of AK2 suppression with or without cyclocreatine (10 mM) treatment. (F) Time-dependent depletion of GFP-positive TKO cells after transduction with LentiCRISPRv2-GFP-sgAK2 in the presence and absence of cyclocreatine (10 mM). Quantitative experiments were performed in 2 or 3 biological replicates as indicated by the individual replicate symbols. (G) Schematic diagram showing the compensatory role of creatine in replenishing cytosolic ATP levels. dcSAM, decarboxylated SAM; SAH, S-adenosyl homocysteine; GAMT, guanidinoacetate N-methyltransferase; CK, creatine kinase. MAT, methionine adenosyltransferase. ∗P < .05, ∗∗P < .01, ∗∗∗P < .001.

Comment in

References

    1. Kazandjian D. Multiple myeloma epidemiology and survival, a unique malignancy. Semin Oncol. 2016;43(6):676–681. - PMC - PubMed
    1. Barwick BG, Gupta VA, Vertino PM, Boise LH. Cell of origin and genetic alterations in the pathogenesis of multiple myeloma. Front Immunol. 2019;10 - PMC - PubMed
    1. Attal M, Lauwers-Cances V, Hulin C, et al. Lenalidomide, bortezomib, and dexamethasone with transplantation for myeloma. N Engl J Med. 2017;376(14):1311–1320. - PMC - PubMed
    1. Santra M, Zhan F, Tian E, Barlogie B, Shaughnessy J., Jr. A subset of multiple myeloma harboring the t(4;14)(p16;q32) translocation lacks FGFR3 expression but maintains an IGH/MMSET fusion transcript. Blood. 2003;101(6):2374–2376. - PubMed
    1. Martinez-Garcia E, Popovic R, Min D-J, et al. The MMSET histone methyl transferase switches global histone methylation and alters gene expression in t(4;14) multiple myeloma cells. Blood. 2011;117(1):211–220. - PMC - PubMed

Publication types

MeSH terms