. 2024 Apr 10;134(11):e174558.
doi: 10.1172/JCI174558.

Neuronally differentiated macula densa cells regulate tissue remodeling and regeneration in the kidney

Affiliations

Neuronally differentiated macula densa cells regulate tissue remodeling and regeneration in the kidney

Georgina Gyarmati et al. J Clin Invest. .

Abstract

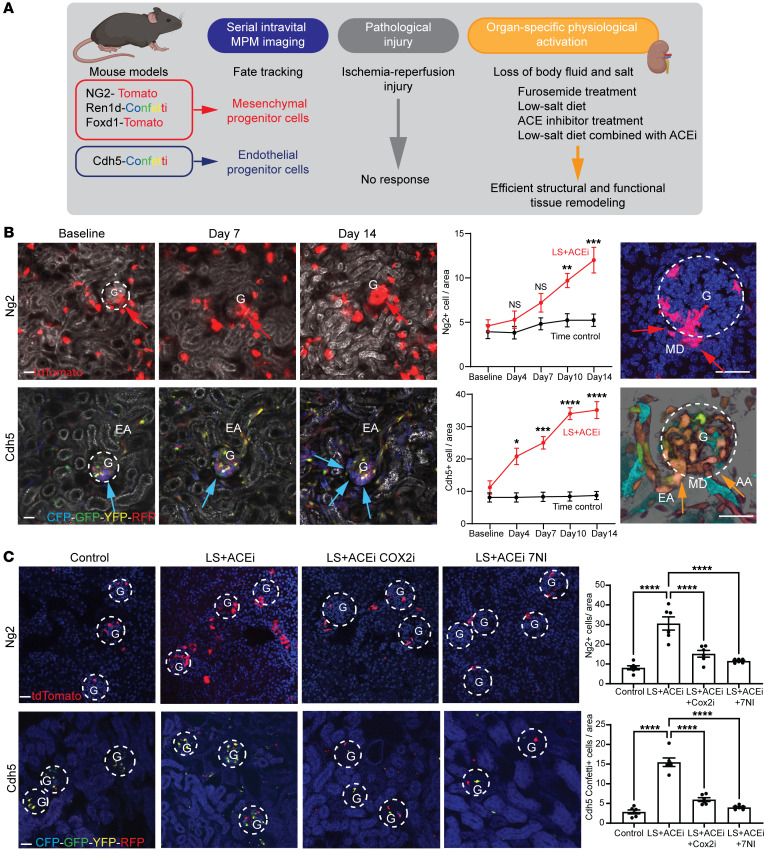
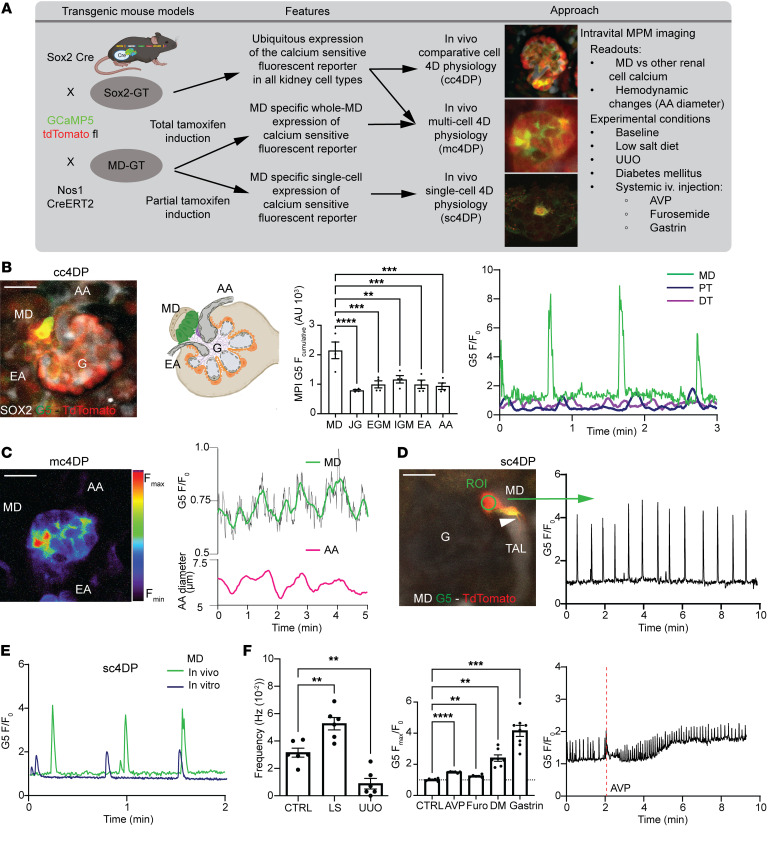
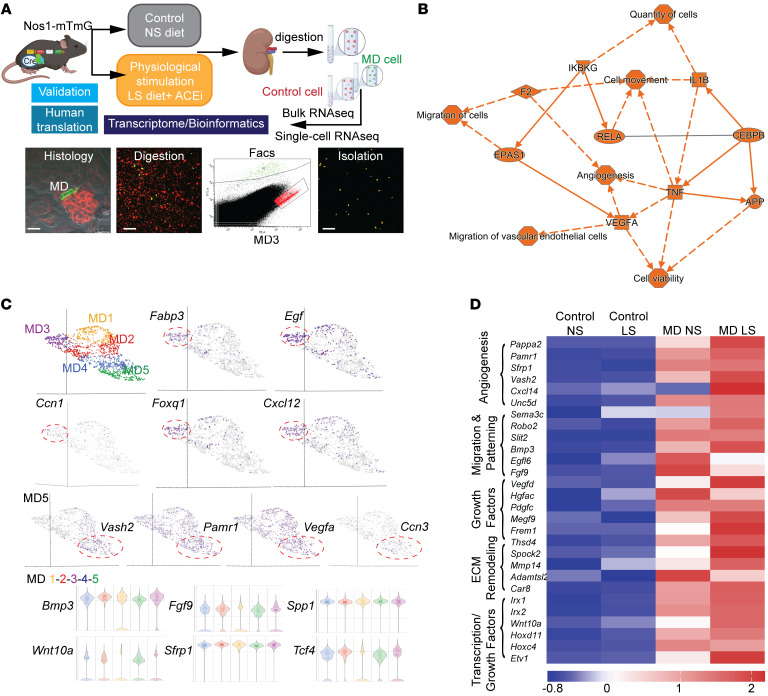
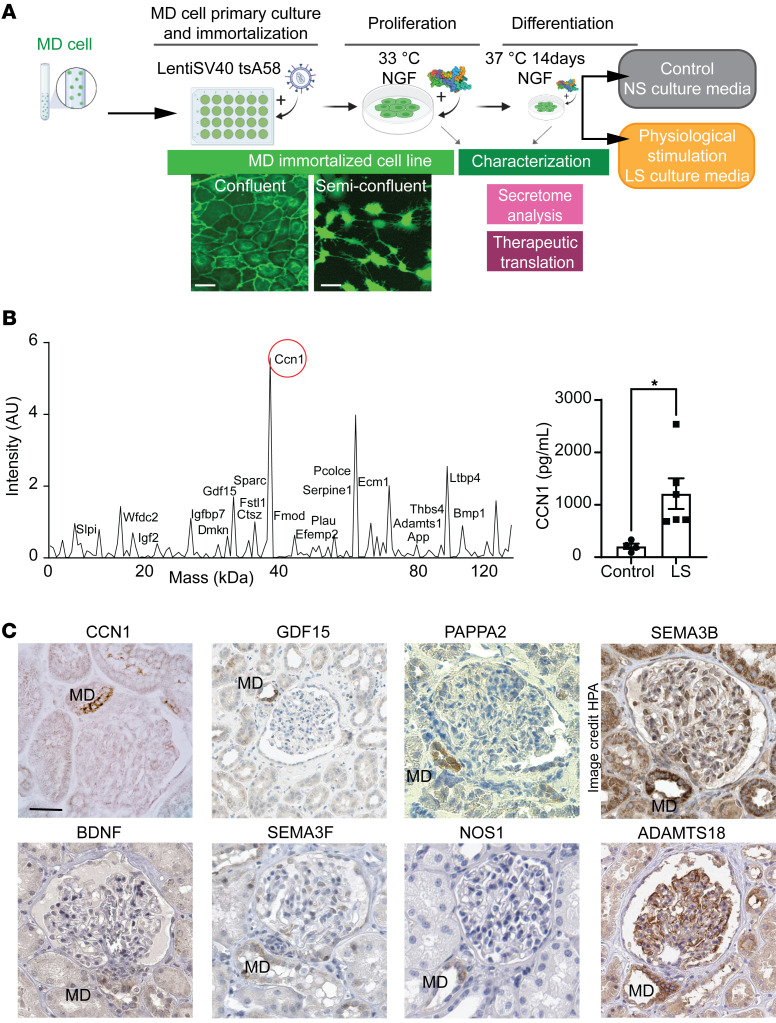
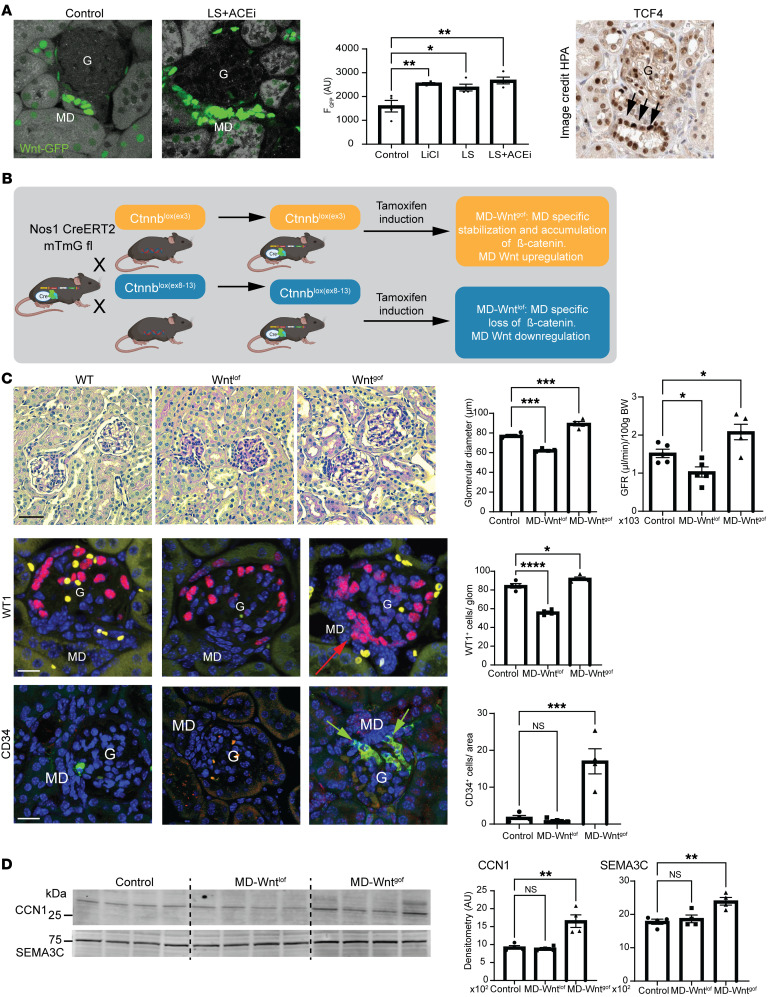
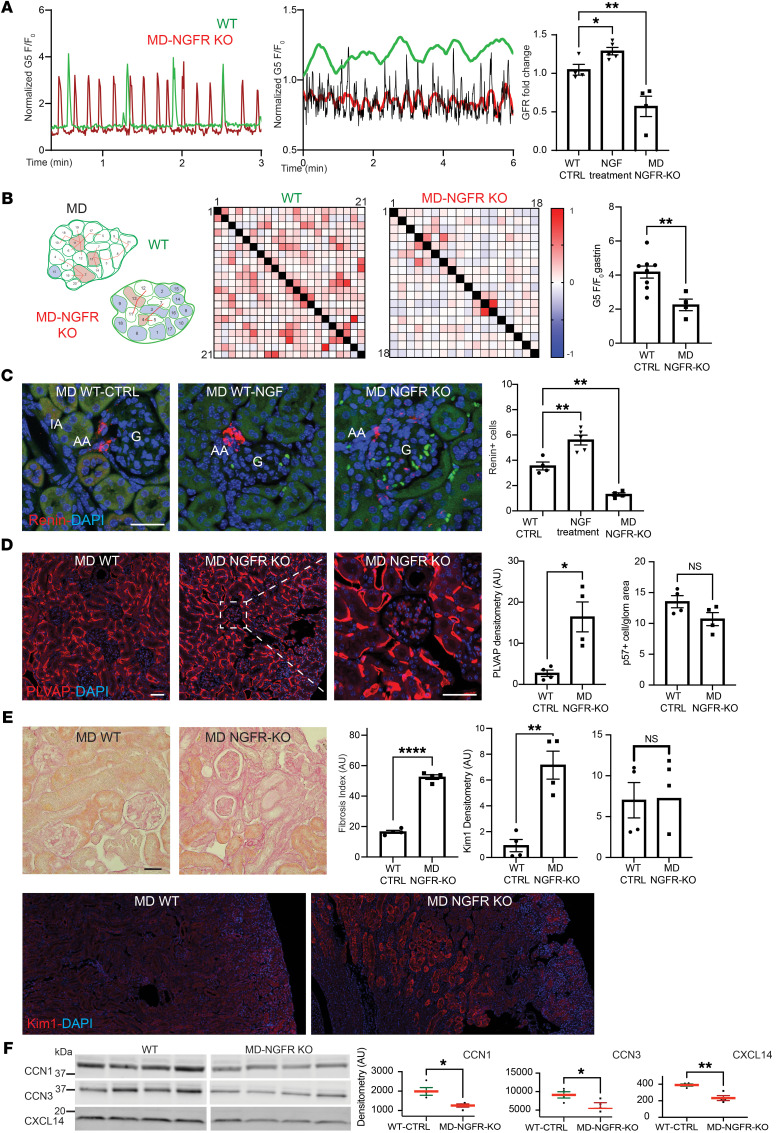
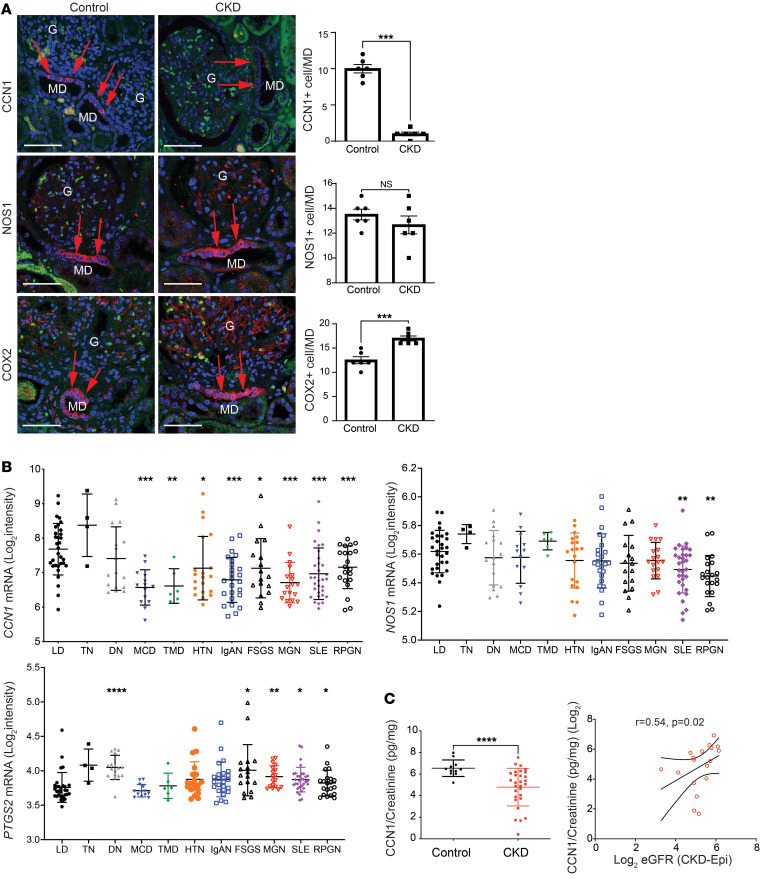
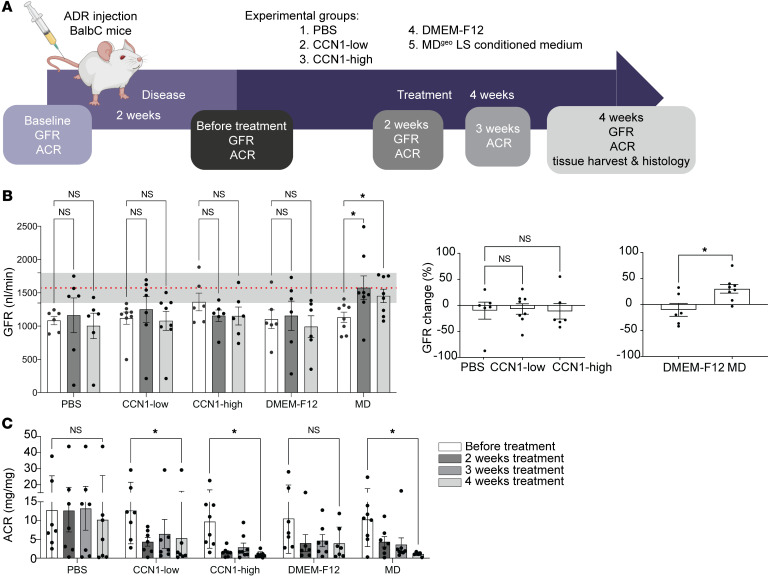
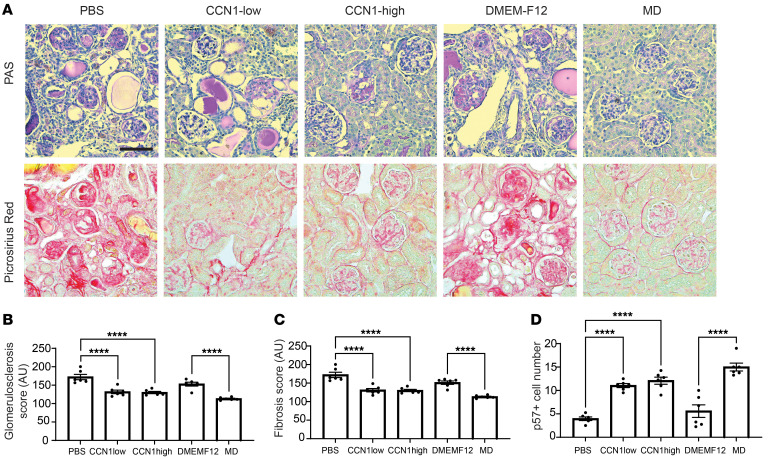
Tissue regeneration is limited in several organs, including the kidney, contributing to the high prevalence of kidney disease globally. However, evolutionary and physiological adaptive responses and the presence of renal progenitor cells suggest an existing remodeling capacity. This study uncovered endogenous tissue remodeling mechanisms in the kidney that were activated by the loss of body fluid and salt and regulated by a unique niche of a minority renal cell type called the macula densa (MD). Here, we identified neuronal differentiation features of MD cells that sense the local and systemic environment and secrete angiogenic, growth, and extracellular matrix remodeling factors, cytokines and chemokines, and control resident progenitor cells. Serial intravital imaging, MD nerve growth factor receptor and Wnt mouse models, and transcriptome analysis revealed cellular and molecular mechanisms of these MD functions. Human and therapeutic translation studies illustrated the clinical potential of MD factors, including CCN1, as a urinary biomarker and therapeutic target in chronic kidney disease. The concept that a neuronally differentiated key sensory and regulatory cell type responding to organ-specific physiological inputs controls local progenitors to remodel or repair tissues may be applicable to other organs and diverse tissue-regenerative therapeutic strategies.

Keywords: Chronic kidney disease; Nephrology.


Conflict of interest statement

Conflict of interest: JPP and GG are cofounders of Macula Densa Cell LLC, a biotechnology company that develops therapeutics to target macula densa cells for a regenerative treatment for chronic kidney disease. Macula Densa Cell LLC has a patent entitled “Targeting macula densa cells as a new therapeutic approach for kidney disease” (US patents 10,828,374 and 11,318,209). ISG declares equity interest in OneLine Health and Karkinos.

Figures

Figure 1
Figure 1. Evaluation of mesenchymal (Ng2-tdTomato, red) and endothelial (Cdh5-Confetti, multicolor) precursor cell–mediated endogenous kidney tissue remodeling.
(A) Experimental design for study of endogenous tissue remodeling using serial multiphoton microscopy (MPM) combined with multiple genetic reporter mouse models in physiological and pathological conditions. (B) Representative in vivo MPM maximum projection images (left) and the number of Ng2+ or Cdh5+ cells per glomerular area (center) of the same kidney cortex area/volume visualized through an abdominal imaging window at the indicated time points or in a magnified single glomerulus (right, on day 14). Responses to low-salt (LS) diet and ACEi (all images) or timed control (center) are shown; n = 6 (1–2 glomeruli/animal). Note the low cell number and random distribution at baseline but high cell number specifically at the glomerular vascular pole (red and blue arrows) and the Cdh5+ clones (CFP/blue, left) and YFP/RFP (orange, right) among all 10 different CFP/GFP/YFP/RFP Confetti color combinations. Plasma was labeled with Alexa Fluor 594–albumin (gray scale). The Z-stacks of same preparations are shown in Supplemental Video 1. G, glomerulus (dashed white circles); AA/EA, afferent/efferent arteriole; MD, macula densa. (C) The effects of LS diet + ACEi for 10 days with or without selective COX2 inhibition with SC58236 or NOS1 inhibition with 7-NI treatment, or 10 days timed control on Ng2+ and Cdh5+ cell number per glomerular area analyzed on frozen tissue sections; n = 6 (average of 10 glomeruli/animal). Nuclei were labeled blue with DAPI. Scale bars: 50 μm. Data represent mean ± SEM. *P < 0.05, **P < 0.01, ***P < 0.001, ****P < 0.0001, ANOVA followed by Dunnett’s test.
Figure 2
Figure 2. MD cell calcium signaling in vivo.
(A) MPM imaging workflow to study 4D physiology in comparative (cc4DP), multicell (mc4DP), and single-cell (sc4DP) modes. Time-lapse recordings of same preparations are shown in Supplemental Video 2. (B) cc4DP mode using Sox2-GT mice. Left: Two-minute time-lapse maximum projection image (MPI) showing highest cumulative GCaMP5 (G5, green/yellow) fluorescence intensity (F) (reflecting cell Ca2+ elevations) in MD (green cells in attached glomerulus [G] drawing). Center: Comparison of G5F in single MD, juxtaglomerular (JG) renin, extra (EGM) and intraglomerular (IGM) mesangial cells, and afferent (AA) and efferent arteriole (EA) vascular smooth muscle cells, n = 4 (average of 5 cells/animal). Right: Time-lapse recordings of G5F normalized to baseline (F/F0) in MD (green), proximal tubule (PT, blue), and distal tubule (DT, purple) cells. (C) mc4DP mode using Sox2-GT mice. Left: Whole-MD pseudocolor MPI showing G5F heterogeneity between MD cells. Right: Simultaneous time-lapse recording of whole-MD G5F (green, smoothed) and AA diameter (magenta). (D) sc4DP mode using MD-GT mice. MD single cells show long axon-like processes (arrowhead, thick ascending limb [TAL] tubule fluid in gray scale) (left) and regular Ca2+ firing with 4-fold elevations in baseline (right). Scale bar: 20 μm. (E) MD single-cell G5F recordings in intact MD-GT mouse kidney in vivo and in vitro after isolation from freshly digested kidneys. (F) MD sc4DP responses to local/systemic stimuli. Left: MD cell Ca2+ firing frequency in control, low-salt diet (LS), and unilateral ureter obstruction (UUO). Center: Changes in MD G5F (baseline shown by dotted line) in response to systemically injected arginine-vasopressin (AVP), furosemide (Furo), gastrin, and in diabetes mellitus (DM). n = 6–8 (average of 4–5 cells/animal). Right: Time-lapse recording of whole-MD G5F during i.v. injection of the V1aR agonist arginine-vasopressin (AVP) given (indicated by red line) 2 minutes after recording baseline. Data represent mean ± SEM. **P < 0.01, ***P < 0.001, ****P < 0.0001, ANOVA followed by Dunnett’s test.
Figure 3
Figure 3. MD cell transcriptome analysis.
(A) Workflow of MD and control cell isolation for transcriptome analysis in control (normal salt [NS]) and low-salt (LS) conditions. Scale bar: 25 μm. (B) Graphical summary of MD single-cell transcriptome analysis. The top activated (indicated by orange, positive Z-score) biological activities, pathways, and genes are listed based on unbiased IPA analysis. IPA system node shapes and colors are used (octagon, function; square, cytokine; triangle, kinase; ellipse, transcription regulator). (C) UMAP visualization (top) of integrated MD single-cell transcriptomic analysis from a single mouse in LS conditions. Graph-based analysis in Partek Flow identified 5 clusters (MD1–5). Top enriched genes (Fabp3, Egf, Ccn1, Foxq1, Cxcl12, Vash2, Pamr1, Vegfa, Nov) show clustering. Violin plot (bottom) of genes that are highly enriched in all 5 MD clusters. (D) Heatmap (mean expression) of top enriched MD-specific genes in MD vs. control cells in control (normal salt) and physiological stimulation (low salt + ACEi [LS]) conditions using bulk RNA analysis (n = 2 mice for MD, n = 4 mice for control cells from each condition). Genes were grouped into 5 categories as indicated according to their biological function. Scale indicates Z-score values.
Figure 4
Figure 4. MD cell secretome analysis.
(A) Workflow of the generation and characterization of the MDgeo cell line and its culturing (conditioning) in control (normal salt [NS]) and low salt (LS) conditions. Differentiated mMDgeo cells show an epithelial cobblestone-like pattern, while semiconfluent MDgeo cells feature long axon-like processes. Scale bar: 25 μm. (B) Mass spectrometry (left) and CCN1 ELISA (right) analysis of the LS-conditioned MDgeo cell culture medium. Mass spectrum plot representing the detected MD-derived secreted proteins in the MDgeo cell culture medium as indicated. LS, low-salt medium. Data represent mean ± SEM. *P < 0.05 with t test, n = 4–6. (C) Immunohistochemistry validation of the expression of top enriched mouse MD-specific genes or their homologous isoforms in the human kidney. Data are from the Human Protein Atlas (HPA) where indicated. Image available from https://www.proteinatlas.org/ENSG00000012171-SEMA3B/tissue/kidney Scale bar: 50 μm.
Figure 5
Figure 5. Manipulation of MD Wnt signaling alters glomerular structure and function.
(A) Representative fluorescence images of frozen kidney sections (left) and quantification (center) of Wnt activity (GFP fluorescence [F] intensity, green) from mice with nuclear TCF/Lef:H2B-GFP reporter in control, LiCl (as positive control), LS, and LS+ACEi conditions; n = 4–6 (average of 5 MDs/animal). Intense GFP labeling in MD cells. Right: TCF4 immunohistochemistry in human kidney (data from the Human Protein Atlas [HPA]). Image available from https://www.proteinatlas.org/ENSG00000196628-TCF4/tissue/kidney Intense labeling in MD cells (arrows). G, glomerulus. (B) Illustration of the applied Cre/lox-based breeding strategies to generate inducible MD Wnt gain-of-function (MD-Wntgof) and loss-of-function (MD-Wntlof) mouse models. (C) Top: Renal histological (representative H&E images [left]) and functional (glomerular filtration rate [GFR, right]) features of MD-Wntgof and lof mice 2 months after tamoxifen induction; n = 4–5 (average of 5–10 glomeruli/animal). Note the enlarged or smaller cortical glomeruli in MD-Wntgof and lof mice, respectively, compared with control WT mice, with extracellular (mesangial) matrix accumulation in MD-Wntlof mice. Bottom: Representative immunofluorescence images (left) and statistical summary (right) of WT1+ (red) and CD34+ (green) cell number. Note the high cell density at the macula densa (MD) cell base (arrows). Yellow (in WT1) and orange (in CD34) colors represent the autofluorescence of red blood cells. Scale bars: 25 μm. Nuclei are labeled blue with DAPI. (D) Altered expression of MD-specific proteins in renal cortical homogenates, including CCN1 and SEMA3C; n = 4. Data represent mean ± SEM. *P < 0.05, **P < 0.01, ***P < 0.001, ****P < 0.0001, ANOVA followed by Dunnett’s test.
Figure 6
Figure 6. The phenotype of MD-NGFR–KO mice.
(A) Increased frequency of MD cell Ca2+ transients in MD-NGFR–KO vs. WT mice. Single MD cell (left) and whole-MD recording (center, original/smoothed) of G5F transients in WT (green) and MD-NGFR–KO mice (red). GFR changes (normalized to baseline before induction/treatment) in WT treated with vehicle (control) or NGF and MD-NGFR–KO mice (right); n = 4–5. (B) Reduced MD cell connectivity and sensitivity in MD-NGFR–KO vs. WT mice. Left: Functional MD cell–to-cell connectivity map of all 21 (WT) and 18 (MD-NGFR–KO) individually numbered MD cells. Red line connecting individual cell pairs indicates Pearson’s r > 0.35. Red and blue cell color indicates hub and lone cells, respectively. Center: Heatmap of each MD cell pair’s Pearson’s coefficient in 2-color gradient, as in scale. Right: Effect of i.v. gastrin on MD cell Ca2+ (G5F) in WT vs. MD-NGFR–KO mice; n = 4–8 (average of 4–5 MD cells/animal). (CE) Renin cell density (C), endothelial injury and podocyte number (D), and renal pathology (E) in WT mice treated with vehicle (control) or NGF,and MD-NGFR–KO mice. n = 4–5 (average of 5 glomeruli/animal). Renin, PLVAP, KIM1 immunofluorescence (red) images and PAS-stained kidney tissue sections, and summary of respective cell numbers, labeling density (tissue fibrosis index), and albuminuria (ACR). Cell nuclei are labeled blue with DAPI, tissue autofluorescence (C, green) is shown for tissue morphology. Scale bar: 50 μm (CE). (F) Representative immunoblots and summary of MD-specific protein expression in renal cortical homogenates, including CCN1, CCN3, and CXCL14 in WT vs. MD-NGFR–KO mice; n = 4. Data represent mean ± SEM. *P < 0.05, **P < 0.01, ***P < 0.001, ****P < 0.0001 using Student’s t test (B and DF) or ANOVA followed by Dunnett’s test (A and C).
Figure 7
Figure 7. CCN1 expression in the kidney in patients with normal kidney function or CKD.
(A) Immunofluorescence labeling (red, left) and quantification (right) of MD cell markers CCN1 (top), NOS1 (center), and COX2 (bottom) in human kidney sections. Note the strong CCN1 expression exclusively in cells of the macula densa (MD; red arrows) in controls and mostly absent labeling in kidney tissue samples from patients with CKD, in contrast to the pattern in NOS1 and COX2 labeling; n = 6 (average of 5 MDs/sample). Nuclei are labeled blue with DAPI; green is tissue autofluorescence. G: glomerulus. Scale bars: 25 μm. (B) Intrarenal CCN1 (CYR61), NOS1, and PTGS2 (COX2) mRNA expression in kidney biopsies (tubulointerstitial compartment) from living donor (LD), tumor nephrectomy (TN), and patients with CKD with various etiologies from the ERCB. LD (n = 31), TN (n = 4), diabetic nephropathy (DN, n = 17), minimal change disease (MCD, n = 14), thin basement membrane disease (TMD, n = 6), arterial hypertension (HTN, n = 20), IgA nephropathy (IgAN, n = 25), focal segmental glomerulosclerosis (FSGS, n = 17), lupus nephritis (SLE, n = 32), membranous glomerulonephropathy (MGN, n = 18), and vasculitis (RPGN, n = 21). Differential expression comparison between LD and each disease subtype was performed using t test. (C) The association of urinary CCN1 levels with kidney function. Comparison of urinary CCN1 in individuals acting as controls (n = 11) and patients with CKD (n = 29) (left) and the positive correlation between urinary CCN1 excretion and eGFR in patients with CKD; n = 18, log2-transformed urinary CCN1/creatinine ratios are shown (right). Data represent mean ± SEM. *P < 0.05, **P < 0.01, ***P < 0.001, ****P < 0.0001 using Student’s t test.
Figure 8
Figure 8. Treatment with MD biologicals improves kidney function in CKD.
(A) Illustration of therapeutic study design for testing the effects of MD biologicals (human recombinant CCN1 and LS-conditioned MDgeo cell culture media) using the adriamycin (ADR) model of glomerulosclerosis in BALB/c mice. (B) Time course of the absolute (left) and relative (normalized to baseline before treatment, right) changes in GFR followed in the same mice measured by the MediBeacon noninvasive transcutaneous method. Note the significant improvement of GFR returning to normal baseline levels (the red dotted line represents mean ± SEM [gray shaded area], measured at baseline) in the MD treatment group indicating functional regression of FSGS pathology; n = 6–8. (C) Time course of albuminuria (albumin/creatinine ratio [ACR]) changes followed in the same mice measured by ELISA. Note the significant improvement in albuminuria in the CCN1 and MD treatment groups in contrast to the PBS and DMEM-F12 controls; n = 6–8. Data represent mean ± SEM. *P < 0.05, ****P < 0.0001, 2-way (mixed-effect) ANOVA with Tukey’s test (B, left, and C), 1-way ANOVA followed by Dunnett’s test (B, center), or t test (B, right).
Figure 9
Figure 9. Treatment with MD biologicals improves kidney structure in CKD.
(A) PAS- (top row) and Picrosirius Red–stained (bottom row) histology images of kidney tissues harvested at the end of treatment in all treatment groups. Scale bar: 50 μm. (BD) Quantification of glomerulosclerosis (B), tubulointerstitial fibrosis (C), and p57+ cell number (podocyte preservation) (D) in all treatment groups; n = 6 (average of 5 areas/animal). Data represent mean ± SEM. ****P < 0.0001, ANOVA with Šidák’s test.

Comment in

  • Remodelling by macula densa cells.
    Allison SJ. Allison SJ. Nat Rev Nephrol. 2024 Jul;20(7):429. doi: 10.1038/s41581-024-00853-x. Nat Rev Nephrol. 2024. PMID: 38816623 No abstract available.

References

    1. Iismaa SE, et al. Comparative regenerative mechanisms across different mammalian tissues. NPJ Regen Med. 2018;3:6. doi: 10.1038/s41536-018-0044-5. - DOI - PMC - PubMed
    1. Little MH, Humphreys BD. Regrow or repair: an update on potential regenerative therapies for the kidney. J Am Soc Nephrol. 2022;33(1):15–32. doi: 10.1681/ASN.2021081073. - DOI - PMC - PubMed
    1. Breyer MD, Susztak K. Developing treatments for chronic kidney disease in the 21st century. Semin Nephrol. 2016;36(6):436–447. doi: 10.1016/j.semnephrol.2016.08.001. - DOI - PMC - PubMed
    1. Heerspink HJL, et al. Dapagliflozin in patients with chronic kidney disease. N Engl J Med. 2020;383(15):1436–1446. doi: 10.1056/NEJMoa2024816. - DOI - PubMed
    1. Cheng CW, et al. Fasting-mimicking diet promotes Ngn3-driven β-Cell regeneration to reverse diabetes. Cell. 2017;168(5):775–788. doi: 10.1016/j.cell.2017.01.040. - DOI - PMC - PubMed