. 2024 Jun 19;112(12):1978-1996.e6.
doi: 10.1016/j.neuron.2024.03.011. Epub 2024 Apr 9.

Glutamatergic neuronal activity regulates angiogenesis and blood-retinal barrier maturation via Norrin/β-catenin signaling

Affiliations

Glutamatergic neuronal activity regulates angiogenesis and blood-retinal barrier maturation via Norrin/β-catenin signaling

Saptarshi Biswas et al. Neuron. .

Abstract

Interactions among neuronal, glial, and vascular components are crucial for retinal angiogenesis and blood-retinal barrier (BRB) maturation. Although synaptic dysfunction precedes vascular abnormalities in many retinal pathologies, how neuronal activity, specifically glutamatergic activity, regulates retinal angiogenesis and BRB maturation remains unclear. Using in vivo genetic studies in mice, single-cell RNA sequencing (scRNA-seq), and functional validation, we show that deep plexus angiogenesis and paracellular BRB maturation are delayed in Vglut1-/- retinas where neurons fail to release glutamate. By contrast, deep plexus angiogenesis and paracellular BRB maturation are accelerated in Gnat1-/- retinas, where constitutively depolarized rods release excessive glutamate. Norrin expression and endothelial Norrin/β-catenin signaling are downregulated in Vglut1-/- retinas and upregulated in Gnat1-/- retinas. Pharmacological activation of endothelial Norrin/β-catenin signaling in Vglut1-/- retinas rescues defects in deep plexus angiogenesis and paracellular BRB maturation. Our findings demonstrate that glutamatergic neuronal activity regulates retinal angiogenesis and BRB maturation by modulating endothelial Norrin/β-catenin signaling.

Keywords: Müller glia; Norrin/β-catenin signaling; angiogenesis; blood-retinal barrier; glutamate; glutamate transporter 2; neuronal activity; neurovascular development; retina; tight junctions.


Conflict of interest statement

Declaration of interests The authors declare no competing interests.

Figures
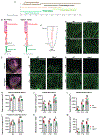
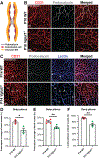
Figure 1.
Figure 1.. Deep plexus angiogenesis is delayed in the Vglut1−/− retina.
A) Timeline of neuronal activities and angiogenesis in the postnatal WT retina. B) Schematics of glutamate release from bipolar cells and photoreceptors in WT and Vglut1−/− retinas. C) Schematic of distinct developmental regions in the retina. D) Representative superficial plexus images of P8 WT and Vglut1−/− retinal flat-mounts stained for CD31 (EC marker). E) Representative images of the retinas of P10 WT and Vglut1−/− retinal flat-mounts stained for CD31. Superficial and deep plexuses are color-coded. Dashed white line shows the extent of deep plexus vascularization. F, G) Representative deep plexus images of P10 and P14 WT and Vglut1−/− retinal flat-mounts stained for CD31. H, I) Dotted bar graphs of superficial plexus vascular coverage in P8 and P10 WT and Vglut1−/− central (H) and peripheral (I) retina (n = 3). J-M) Dotted bar graphs of deep plexus vascular coverage (J, L) and branch point density (K, M) in P10, P12 and P14 WT and Vglut1−/− central (J, K) and peripheral (L, M) retina (n = 4). Scale bars: E = 250 μm; D, F, G = 62 μm. Students t-test: *p<0.05, **p<0.02, NS = not significant. Error bars: Mean ± S.E.M.
Figure 2.
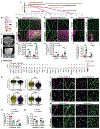
Figure 2.. scRNA-seq shows aberrant angiogenic transcriptomic signatures in Vglut1−/− ECs.
A) UMAP projection shows separation of P10 WT and Vglut1−/− retinal ECs based on transcriptomic signatures. B, C) Gene ontology (GO) analyses of P10 WT and Vglut1−/− retinal ECs show top downregulated (B) and upregulated (C) pathways. D, E) Dot plot of expression levels for angiogenesis (D) and tip cell (E) genes in P10 WT and Vglut1−/− retinal ECs. Genes enriched in deep plexus tip cells (D-tip cells) compared to superficial plexus tip cells (S-tip cells) are in red. Genes enriched in deep plexus tip cells (D-tip cells) compared to all ECs are in purple. F, G) Violin plots of representative angiogenesis (F) and tip cells (G) genes in P10 WT and Vglut1−/− retinal ECs. H) Schematic of a vascular sprout consisting of tip and stalk cells. I) Representative deep plexus images of P12 WT and Vglut1−/− retinal flat-mounts stained for Ki67 and CD31. J) Measurements of Ki67+ (proliferative), or cleaved Caspase3+ (apoptotic) ECs in P12 WT and Vglut1−/− retinal deep plexus (n = 4). K) Representative deep plexus images of P12 WT and Vglut1−/− retinal flat-mounts stained for CD31. The dotted line shows the vascular front in the Vglut1−/− retina. L) Representative deep plexus images of P12 WT and Vglut1−/− retinal flat-mounts stained for CD31 and Dll4. Arrowheads point to Dll4+ tip cells in the Vglut1−/− retina. Scale bars = 41 μm. Students t-test: **<0.02, NS = not significant. Error bars: Mean ± S.E.M. See also Figure S1.
Figure 3.
Figure 3.. Deep plexus of the Vglut1−/− retina is poorly perfused.
A) Schematic of Podocalyxin localization on ECs. BM: basement membrane. B) Representative deep plexus images of P10 WT and Vglut1−/− retinal flat-mounts labeled with CD31 and Podocalyxin. C) Representative deep plexus images of P14 WT and Vglut1−/− retinal flat-mounts labeled with CD31 and Podocalyxin Lectin injection. Empty arrowheads show unperfused vessels. D, E) Dotted bar graphs of Podocalyxin coverage of the deep plexus in P10 (D) and P14 (E) WT and Vglut1−/− retinas (n = 3-4). F) Dotted bar graphs of Lectin perfusion of the deep plexus in P14 WT and Vglut1−/− retinas (n = 3). Scale bars = 50 μm. Students t-test: *<0.05, **<0.02, NS = not significant. Error bars: Mean ± S.E.M.
Figure 4.
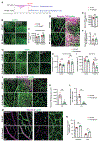
Figure 4.. Paracellular BRB maturation is impaired in Vglut1−/− retina.
A) Timelines of the paracellular and transcellular BRB maturation in the postnatal WT retina. B) Schematic of biocytin-TMR paracellular leakage through impaired tight junctions; neurons take up leaked biocytin-TMR. vBM: vascular BM. C) Representative low magnification images of P10 WT and Vglut1−/− retinal flat mounts after biocytin-TMR injection. D-F) Representative high magnification images of the superficial (D, E) and deep (F) plexuses of P10 and P14 WT and Vglut1−/− retinal flat mounts labeled with Lectin after biocytin-TMR injection. G-I) Measurements of the area (G, H) and fluorescence intensity (I) of leaked biocytin-TMR in P10 and P14 WT and Vglut1−/− retinal flat-mounts (n = 4). J) Dot plot of expression levels for BRB genes in P10 WT and Vglut1−/− retinal ECs. K) Violin plots of representative BRB genes in P10 WT and Vglut1−/− retinal ECs. L) Representative superficial and deep plexus images of P14 WT and Vglut1−/− retinal flat mounts stained for Claudin-5 (Cldn5) and Lectin. Empty arrowheads point to Claudin-5 blood vessels. M) Representative superficial and deep plexus images of P14 WT and Vglut1−/− retinal flat-mounts stained for ZO-1 (Tjp1) and Lectin. Empty arrowheads point at ZO-1 blood vessels. N, O) Measurement of Claudin-5 (N) and ZO-1 (O) coverage of blood vessels in P14 WT and Vglut1−/− retinas (n = 4). Scale bars: C = 150 μm; D, L, M = 41 μm. Students t-test: *<0.05, **<0.02. Error bars: Mean ± S.E.M. See also Figures S2 and S3.
Figure 5.
Figure 5.. Paracellular BRB matures precociously in the Chrnb2−/− retina.
A) Schematic illustrating early (P8) onset of glutamatergic waves in the Chrnb2−/− retina. B) Representative superficial plexus images of P7 WT and Chrnb2−/− retinal flat-mounts labeled with Lectin. C) Quantification of superficial plexus vascular coverage in P7 WT and Chrnb2−/− retinas. D) Representative superficial and deep plexus images of P7 WT and Chrnb2−/− retinal flat-mounts labeled with Lectin biocytin-TMR injection. E, F) Measurements of the area (E) and fluorescence intensity (F) of leaked biocytin-TMR in P7 WT and Chrnb2−/− retinal flat-mounts (n = 4). G) Representative superficial and deep plexus images of P10 WT and Chrnb2−/− retinal flat-mounts labeled with CD31. H, I) Quantification of vascular coverage in the superficial (H) and deep (I) plexuses of P10 WT and Chrnb2−/− retinas. J) Representative superficial and deep plexus images of P10 WT and Chrnb2−/− retinal flat-mounts labeled with Lectin after biocytin-TMR injection. K, L) Measurements of the area (K) and fluorescence intensity (L) of leaked biocytin-TMR in P10 WT and Chrnb2−/− retinal flat-mounts (n = 4). M) Representative superficial and deep plexus images of P10 WT and Chrnb2−/− retinal flat-mounts stained for Claudin-5 and Lectin. Empty arrowheads point at Claudin-5 blood vessels. N) Measurement of Claudin-5 coverage of blood vessels in P10 WT and Chrnb2−/− retinas (n = 3). Scale bars: B, G = 62 μm, D, J, M = 41 μm. Students t-test: **<0.02. Error bars: Mean ± S.E.M.
Figure 6.
Figure 6.. Deep plexus angiogenesis and paracellular BRB maturation are accelerated Gnat1−/− retinas.
A, B) Schematics of glutamate release from rod photoreceptors in WT (A) and Gnat1−/− (B) retinas. C) Representative superficial plexus images of P10 WT and Gnat1−/− retinal flat-mounts stained for Lectin. D) Measurements of superficial plexus vascular coverage in P10 WT and Vglut1−/− central and peripheral retinas (n = 3 mice / genotype). E, H) Representative deep plexus images of P10 WT and Gnat1−/− retinal flat-mounts stained for Lectin. F, G, I, J) Measurements of deep plexus vascular coverage (F, I) and branch point density (G, J) in P10 and P14 WT and Gnat1−/− central (F, G) and peripheral (I, J) retinas (n = 4). K) Representative deep plexus images of P10 WT and Gnat1−/− retinal flat-mounts stained for Ki67 and CD31. L) Measurements of Ki67+ ECs in P10 WT and Gnat1−/− retinal deep plexus (n = 4). M) Representative superficial and deep plexus images of P10 WT and Gnat1−/− retinal flat-mounts labeled with Lectin after biocytin-TMR injection. N, O) Measurements of the area (N) and fluorescence intensity (O) of leaked biocytin-TMR in P10 WT and Gnat1−/− retinal flat-mounts (n = 4). P, Q) Representative superficial (P) and deep (Q) plexus images of P10 WT and Gnat1−/− retinal flat-mounts stained for Claudin-5 and Lectin. P’ and Q’ are magnified images of the corresponding boxed areas. Empty arrowheads point at Claudin-5 blood vessels. R) Measurement of Claudin-5 coverage of blood vessels in P10 WT and Gnat1−/− retinas (n = 4). Scale bars: C, E, H = 62 μm and K, M, P, Q = 41 μm. Students t-test: *<0.05, **<0.02, NS = not significant. Error bars: Mean ± S.E.M. See also Figure S4.
Figure 7.
Figure 7.. Glutamate promotes Norrin expression in Müller glia and inner nuclear layer (INL) neurons.
A-F) P14 WT, Vglut1−/− and Gnat1−/− retinal sections were stained for glutamine synthetase (GS) (A), GLAST (C) and GLT-1 (E). Dotted bar graphs show quantification of mean fluorescence intensities (M.F.I) in the INL for GS (B), GLAST (D) and GLT-1 (F) (n = 4). G) Fluorescent in situ hybridization of P10 WT, Vglut1−/− and Gnat1−/− retinal sections for Ndp (Norrin), with DAPI staining. H) Quantification of the M.F.I of Ndp in the INL of P10 WT, Vglut1−/− and Gnat1−/− retinal sections (n = 4). I) Expression profiles of Ndp, Slc1a3 (GLAST) and Slc1a2 (GLT-1) in the P14 WT retina from an existing database. J) Schematic of ex vivo organotypic culture experiments. K) Fluorescent in situ hybridization of P10 WT retinal sections, cultured for 12 hours with or without glutamate or TFB-TBOA, for Ndp (Norrin), with DAPI staining. L, M) Quantification of the M.F.I of Ndp in the INL of P10 WT retinal sections, cultured ex vivo for either 6 (L) or 12 (M) hours with or without glutamate or TFB-TBOA (n = 4). GCL: ganglion cell layer, INL: inner nuclear layer, ONL: outer nuclear layer. Scale bars = 41 μm. One-way ANOVA: *<0.05, **<0.02, NS = not significant. Error bars: Mean ± S.E.M. See also Figures S5, S6 and S7.
Figure 8.
Figure 8.. Upregulation of Norrin/β-catenin signaling rescues Vglut1−/− retinal vascular phenotypes.
A, B) P14 WT, Vglut1−/− and Gnat1−/− retinal sections were stained (A) for Lef1, CD31 and DAPI, and the number of Lef1+ ECs was quantified (B) (n = 4). C, D) MeBIO (control)- or BIO (Norrin/²-catenin activator)-treated P10 WT and Vglut1−/− retinal flat-mounts were stained (C) with Lectin and Lef1, and the number of Lef1+ ECs was quantified (D) (n = 4). E-G) MeBIO- or BIO-treated P10 WT and Vglut1−/− retinas were stained with Lectin [low (E) and high (F) magnifications], and peripheral deep plexus vascular coverage was quantified (G) (n = 4). Red dotted lines depict the extent of deep plexus growth. H, I) Representative images of Lectin stained flat-mount MeBIO- or BIO-treated P10 WT and Vglut1−/− retinas after biocytin-TMR injection [low (H) and high (I) magnifications]. J, K) Dotted bar graphs show quantification of biocytin-TMR fluorescence intensity (J) and leakage area (K) (n = 5). L) Model: Glutamate is taken up into synaptic vesicles by vGluT1, and is released into the synaptic cleft by neurons. The light-dependent inhibition of glutamate release from rods is regulated by Transducin. In response to the glutamate, Müller glia and INL neurons upregulate Norrin expression and likely its secretion. Glutamate-dependent secretion of Norrin activates endothelial Norrin/β-catenin signaling, which promotes deep plexus angiogenesis and the overall paracellular BRB maturation. GCL: ganglion cell layer, INL: inner nuclear layer. Scale bars A, D, G = 41 μm, C, F = 200 μm. One-way ANOVA: **<0.02. Error bars: Mean ± S.E.M. See also Figure S8.

Update of

References

    1. Klaassen I, Van Noorden CJ, and Schlingemann RO (2013). Molecular basis of the inner blood-retinal barrier and its breakdown in diabetic macular edema and other pathological conditions. Prog Retin Eye Res 34, 19–48. 10.1016/j.preteyeres.2013.02.001. - DOI - PubMed
    1. Zhao Z, Nelson AR, Betsholtz C, and Zlokovic BV (2015). Establishment and Dysfunction of the Blood-Brain Barrier. Cell 163, 1064–1078. 10.1016/j.cell.2015.10.067. - DOI - PMC - PubMed
    1. Chow BW, and Gu C (2015). The molecular constituents of the blood-brain barrier. Trends Neurosci 38, 598–608. 10.1016/j.tins.2015.08.003. - DOI - PMC - PubMed
    1. Biswas S, Cottarelli A, and Agalliu D (2020). Neuronal and glial regulation of CNS angiogenesis and barriergenesis. Development 147. 10.1242/dev.182279. - DOI - PMC - PubMed
    1. Umino Y, and Solessio E (2013). Loss of scotopic contrast sensitivity in the optomotor response of diabetic mice. Invest Ophthalmol Vis Sci 54, 1536–1543. 10.1167/iovs.12-10825. - DOI - PubMed

LinkOut - more resources