. 2024 Jun;630(8016):437-446.
doi: 10.1038/s41586-024-07373-5. Epub 2024 Apr 10.

ROS-dependent S-palmitoylation activates cleaved and intact gasdermin D

Affiliations

ROS-dependent S-palmitoylation activates cleaved and intact gasdermin D

Gang Du et al. Nature. 2024 Jun.

Abstract

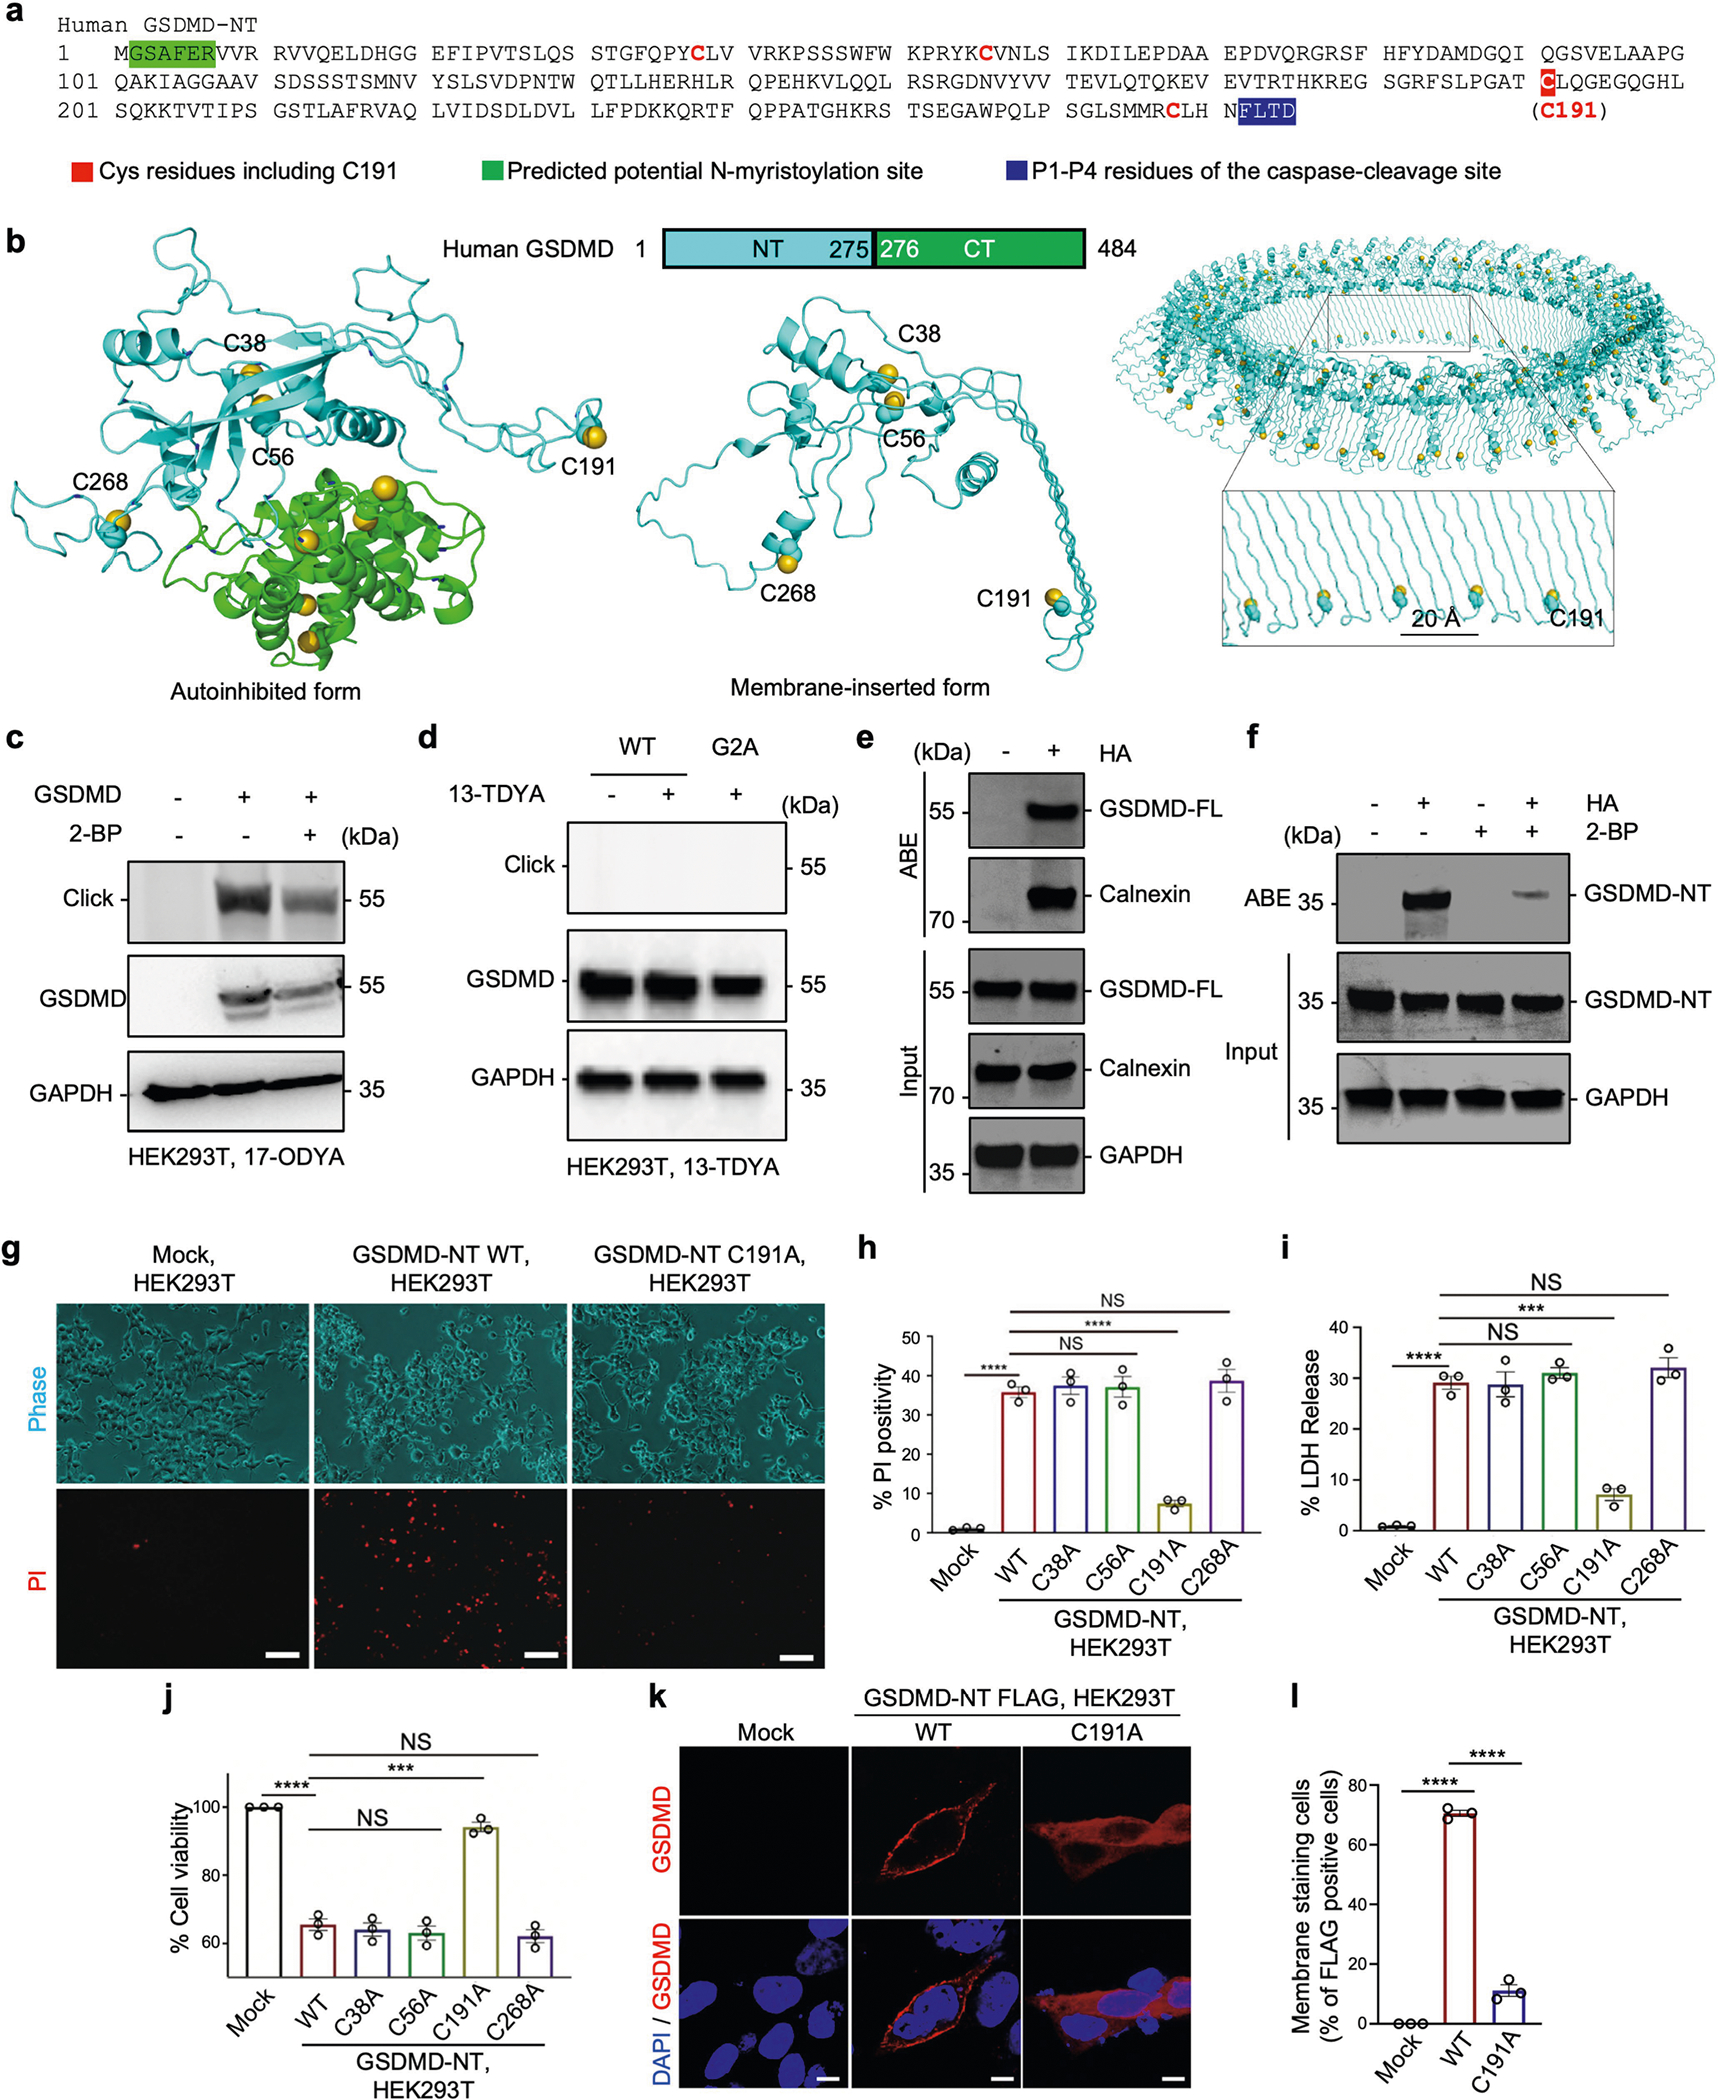
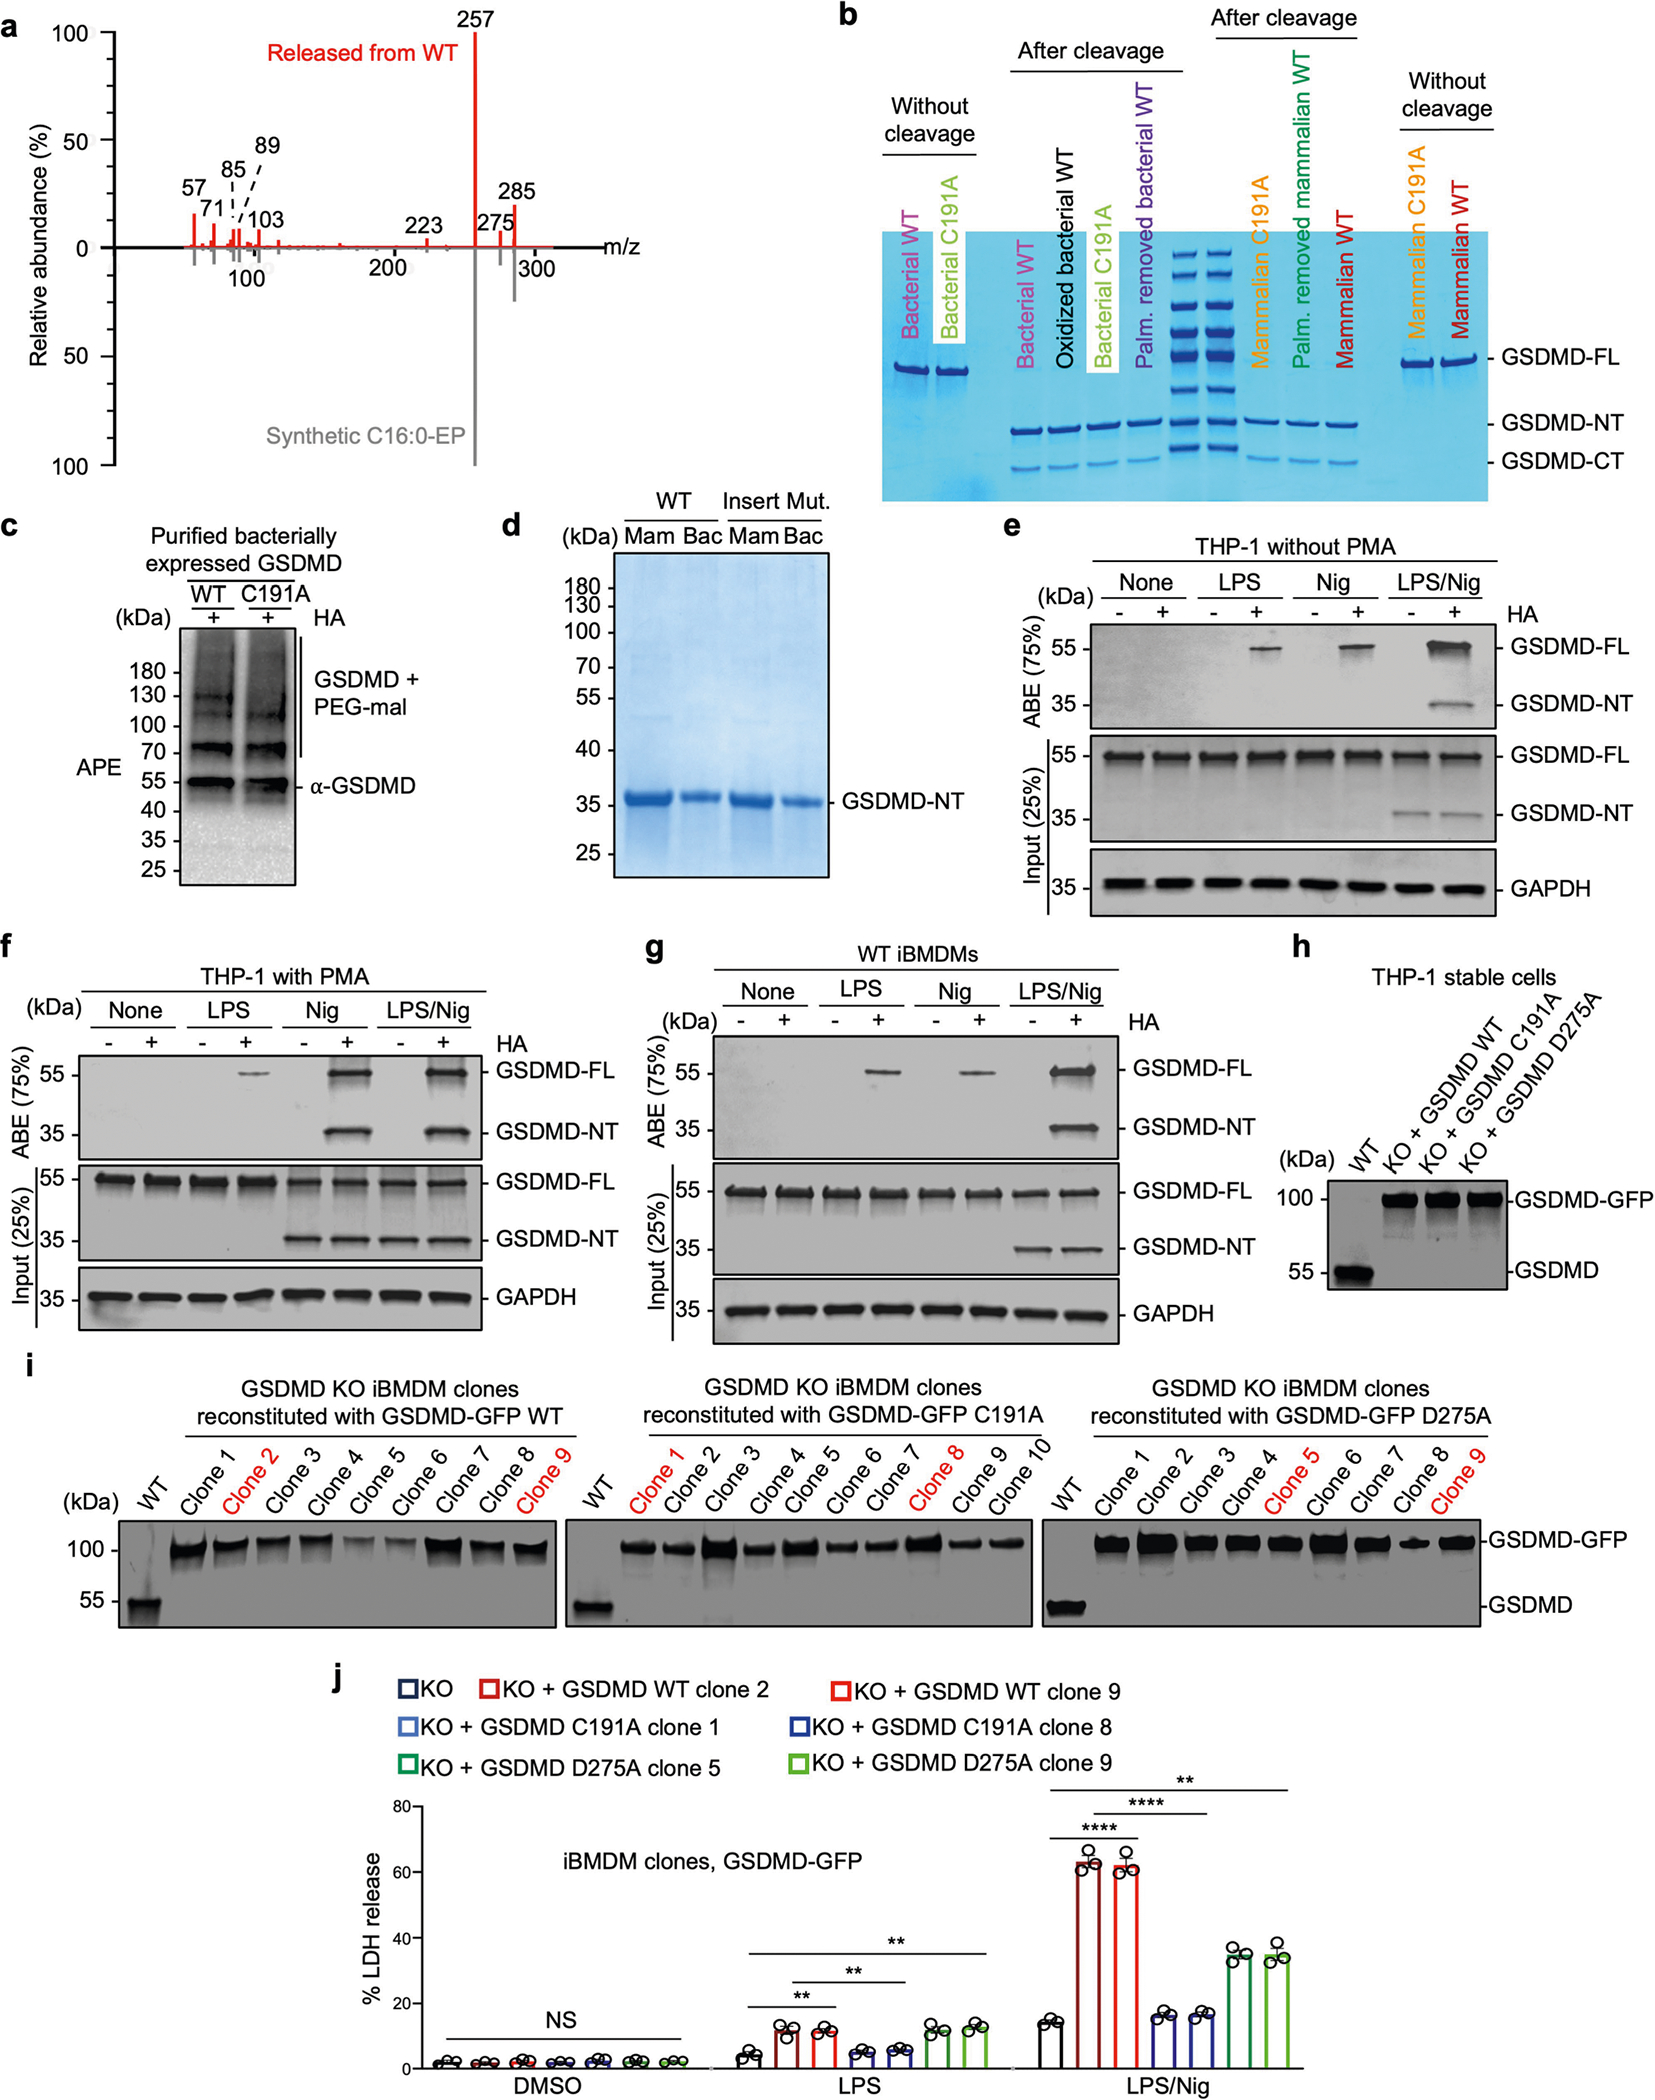
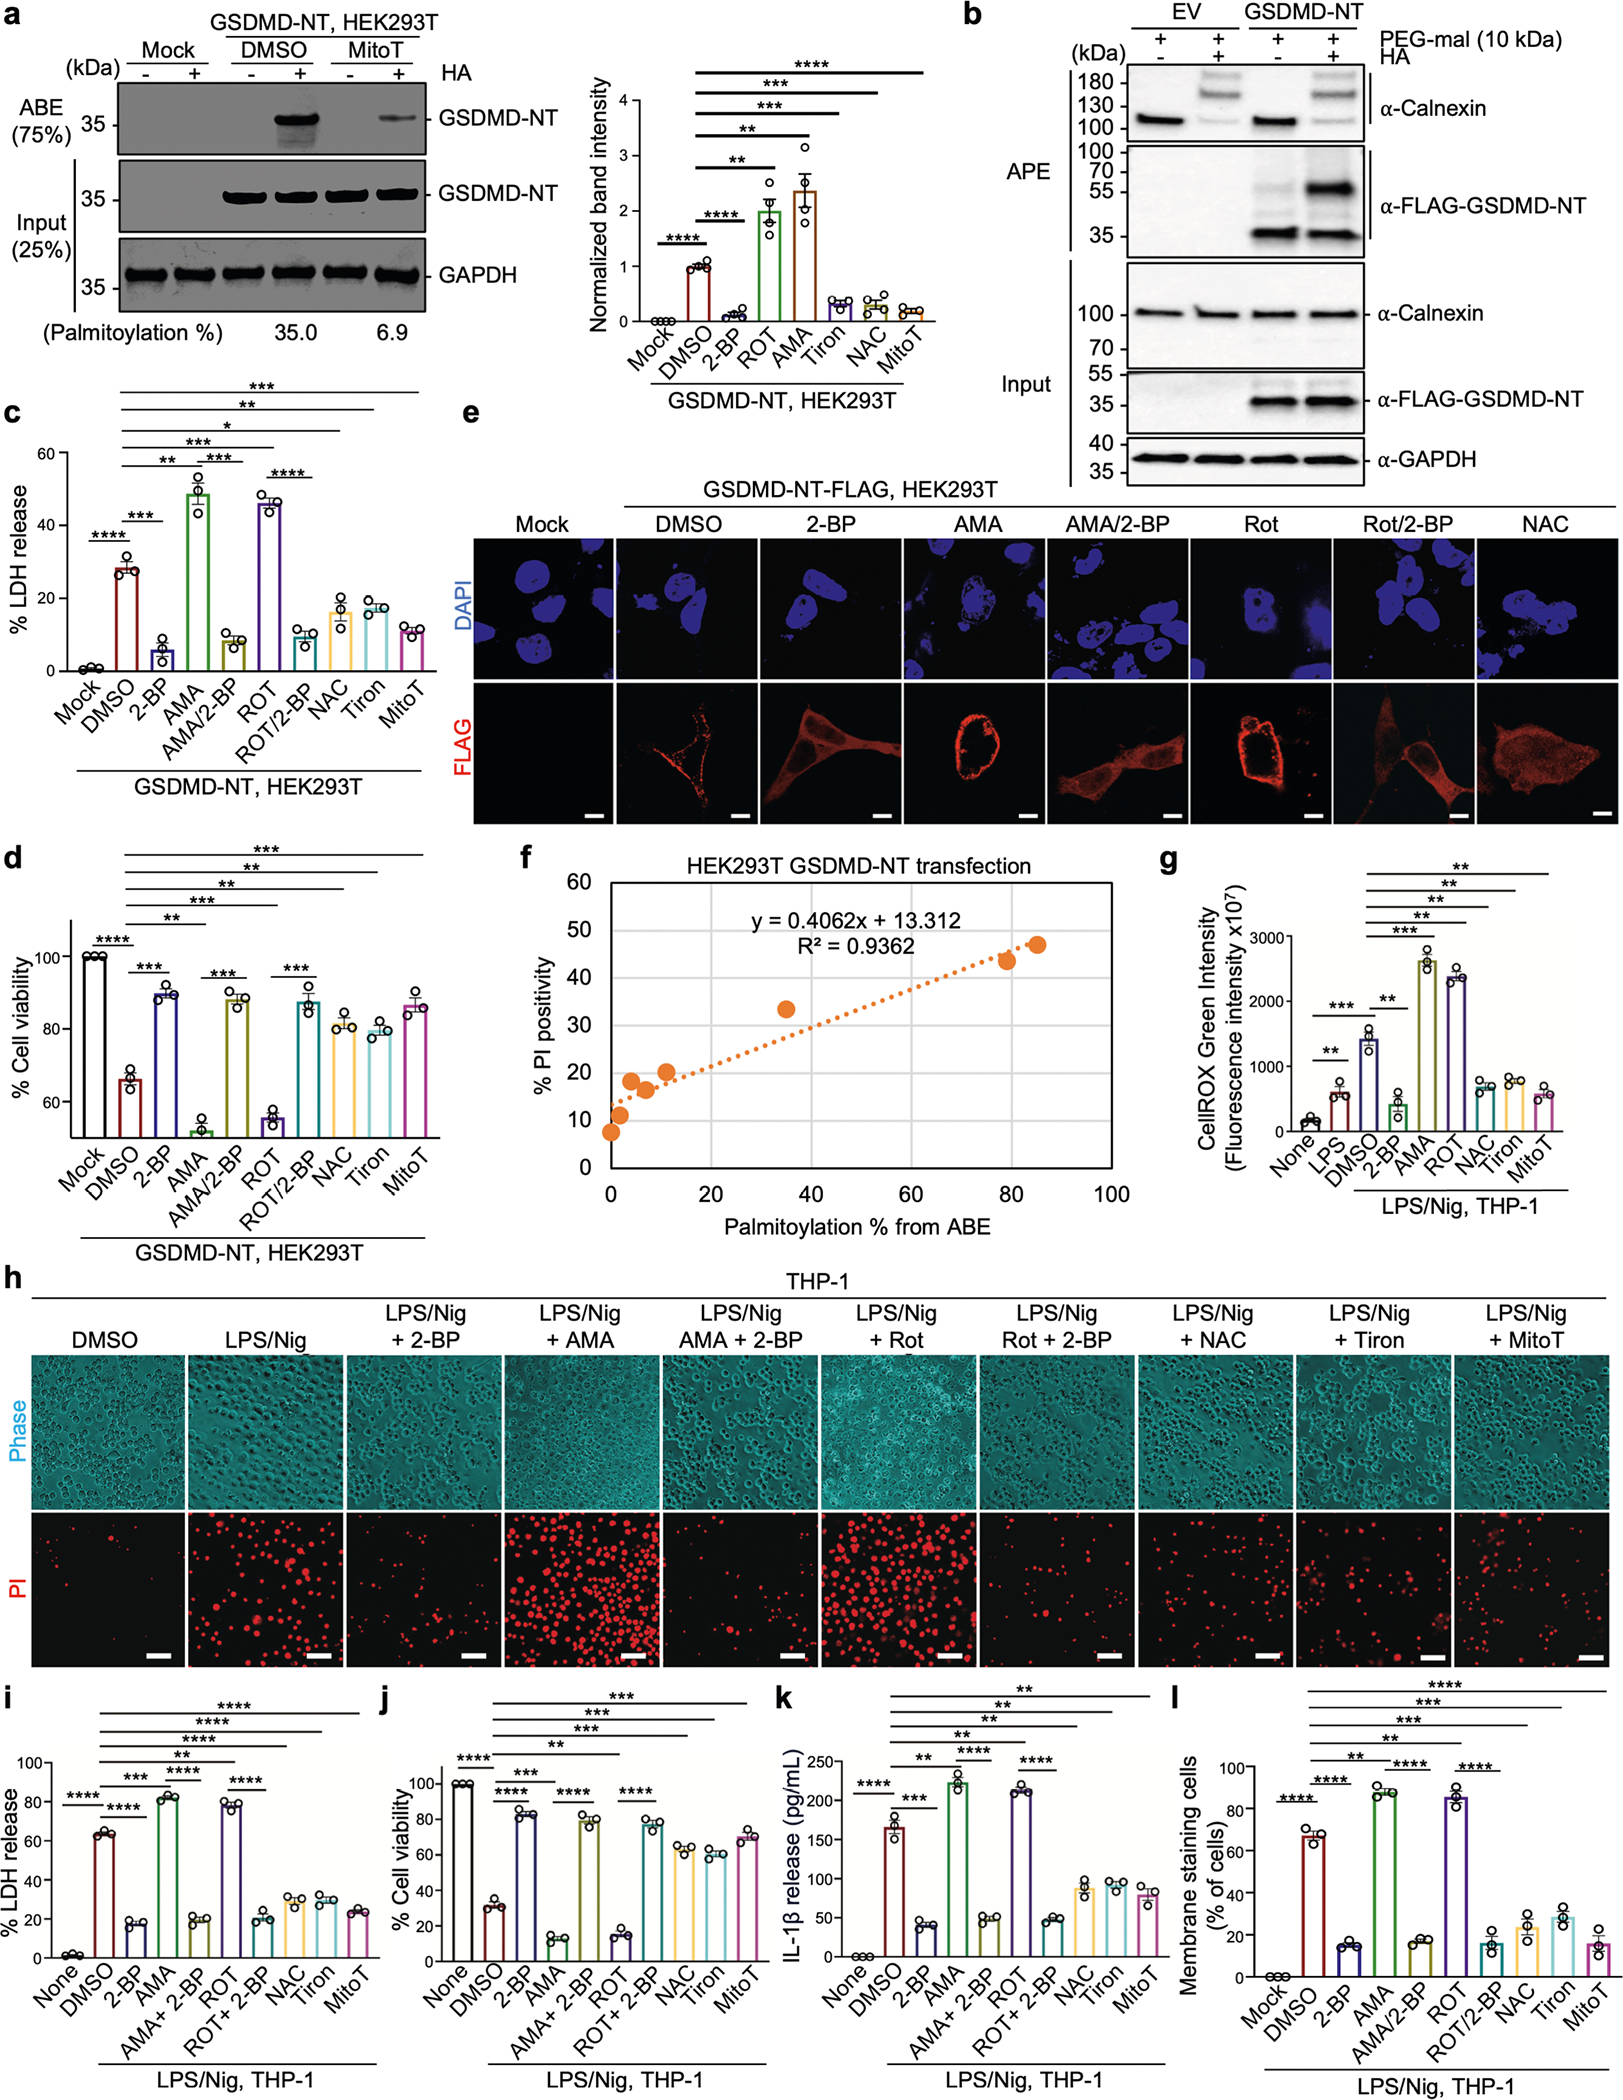
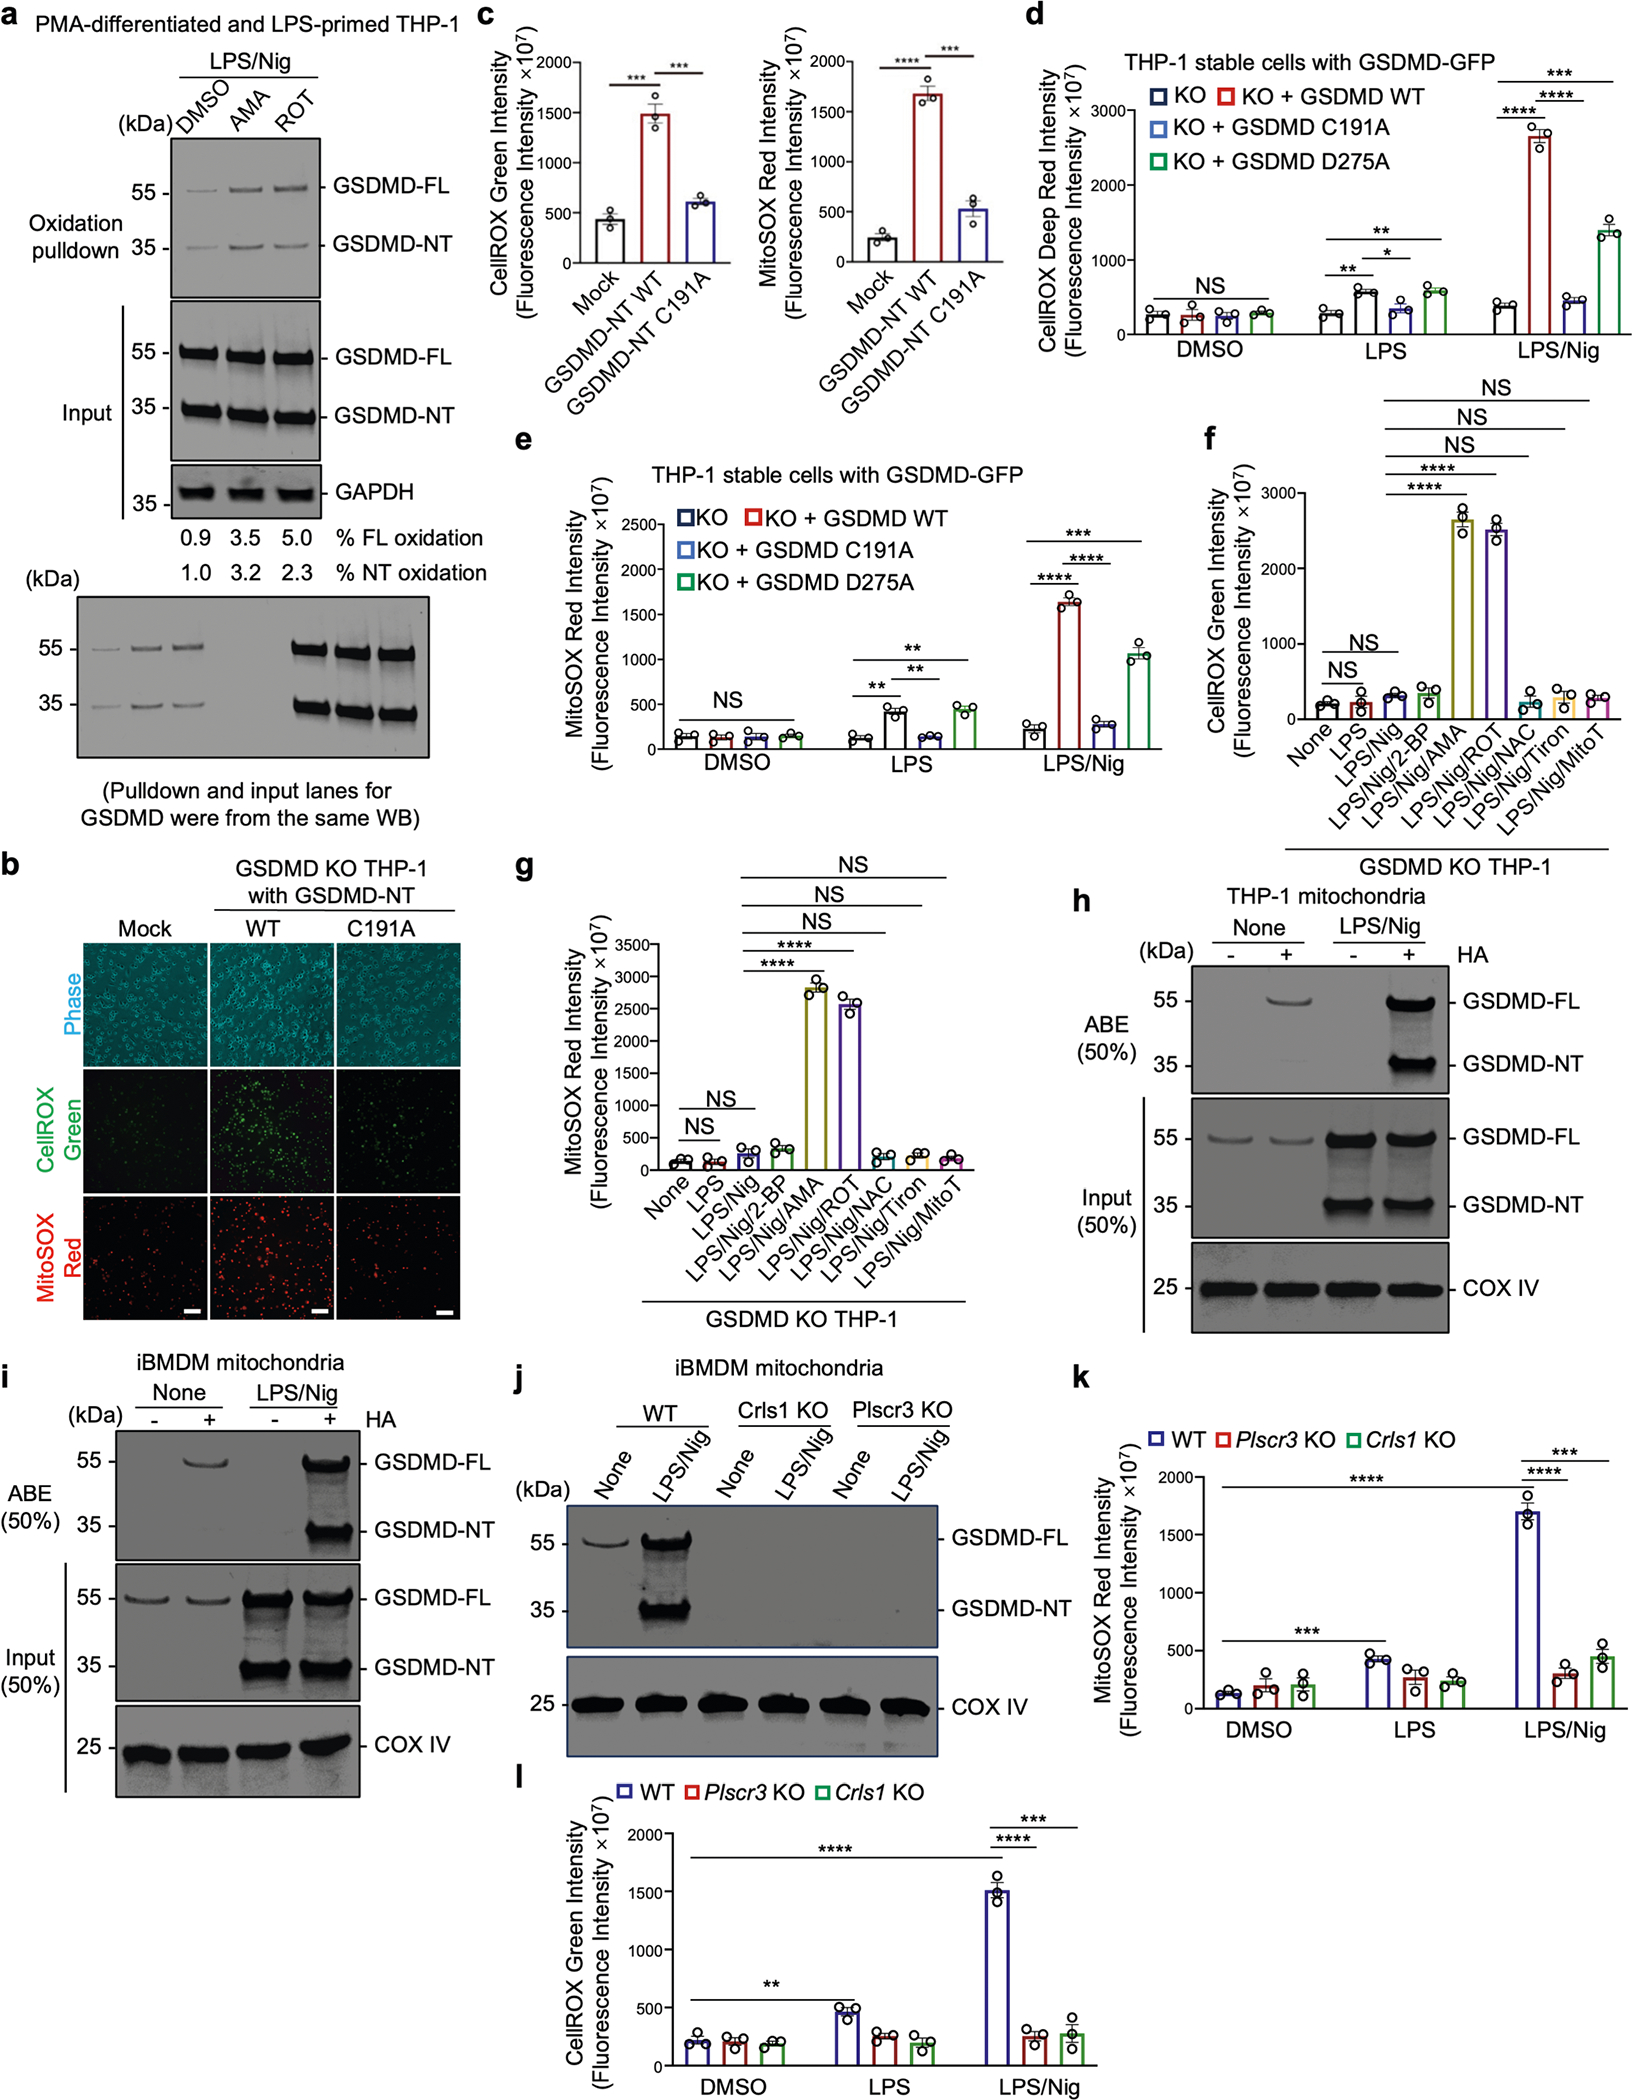
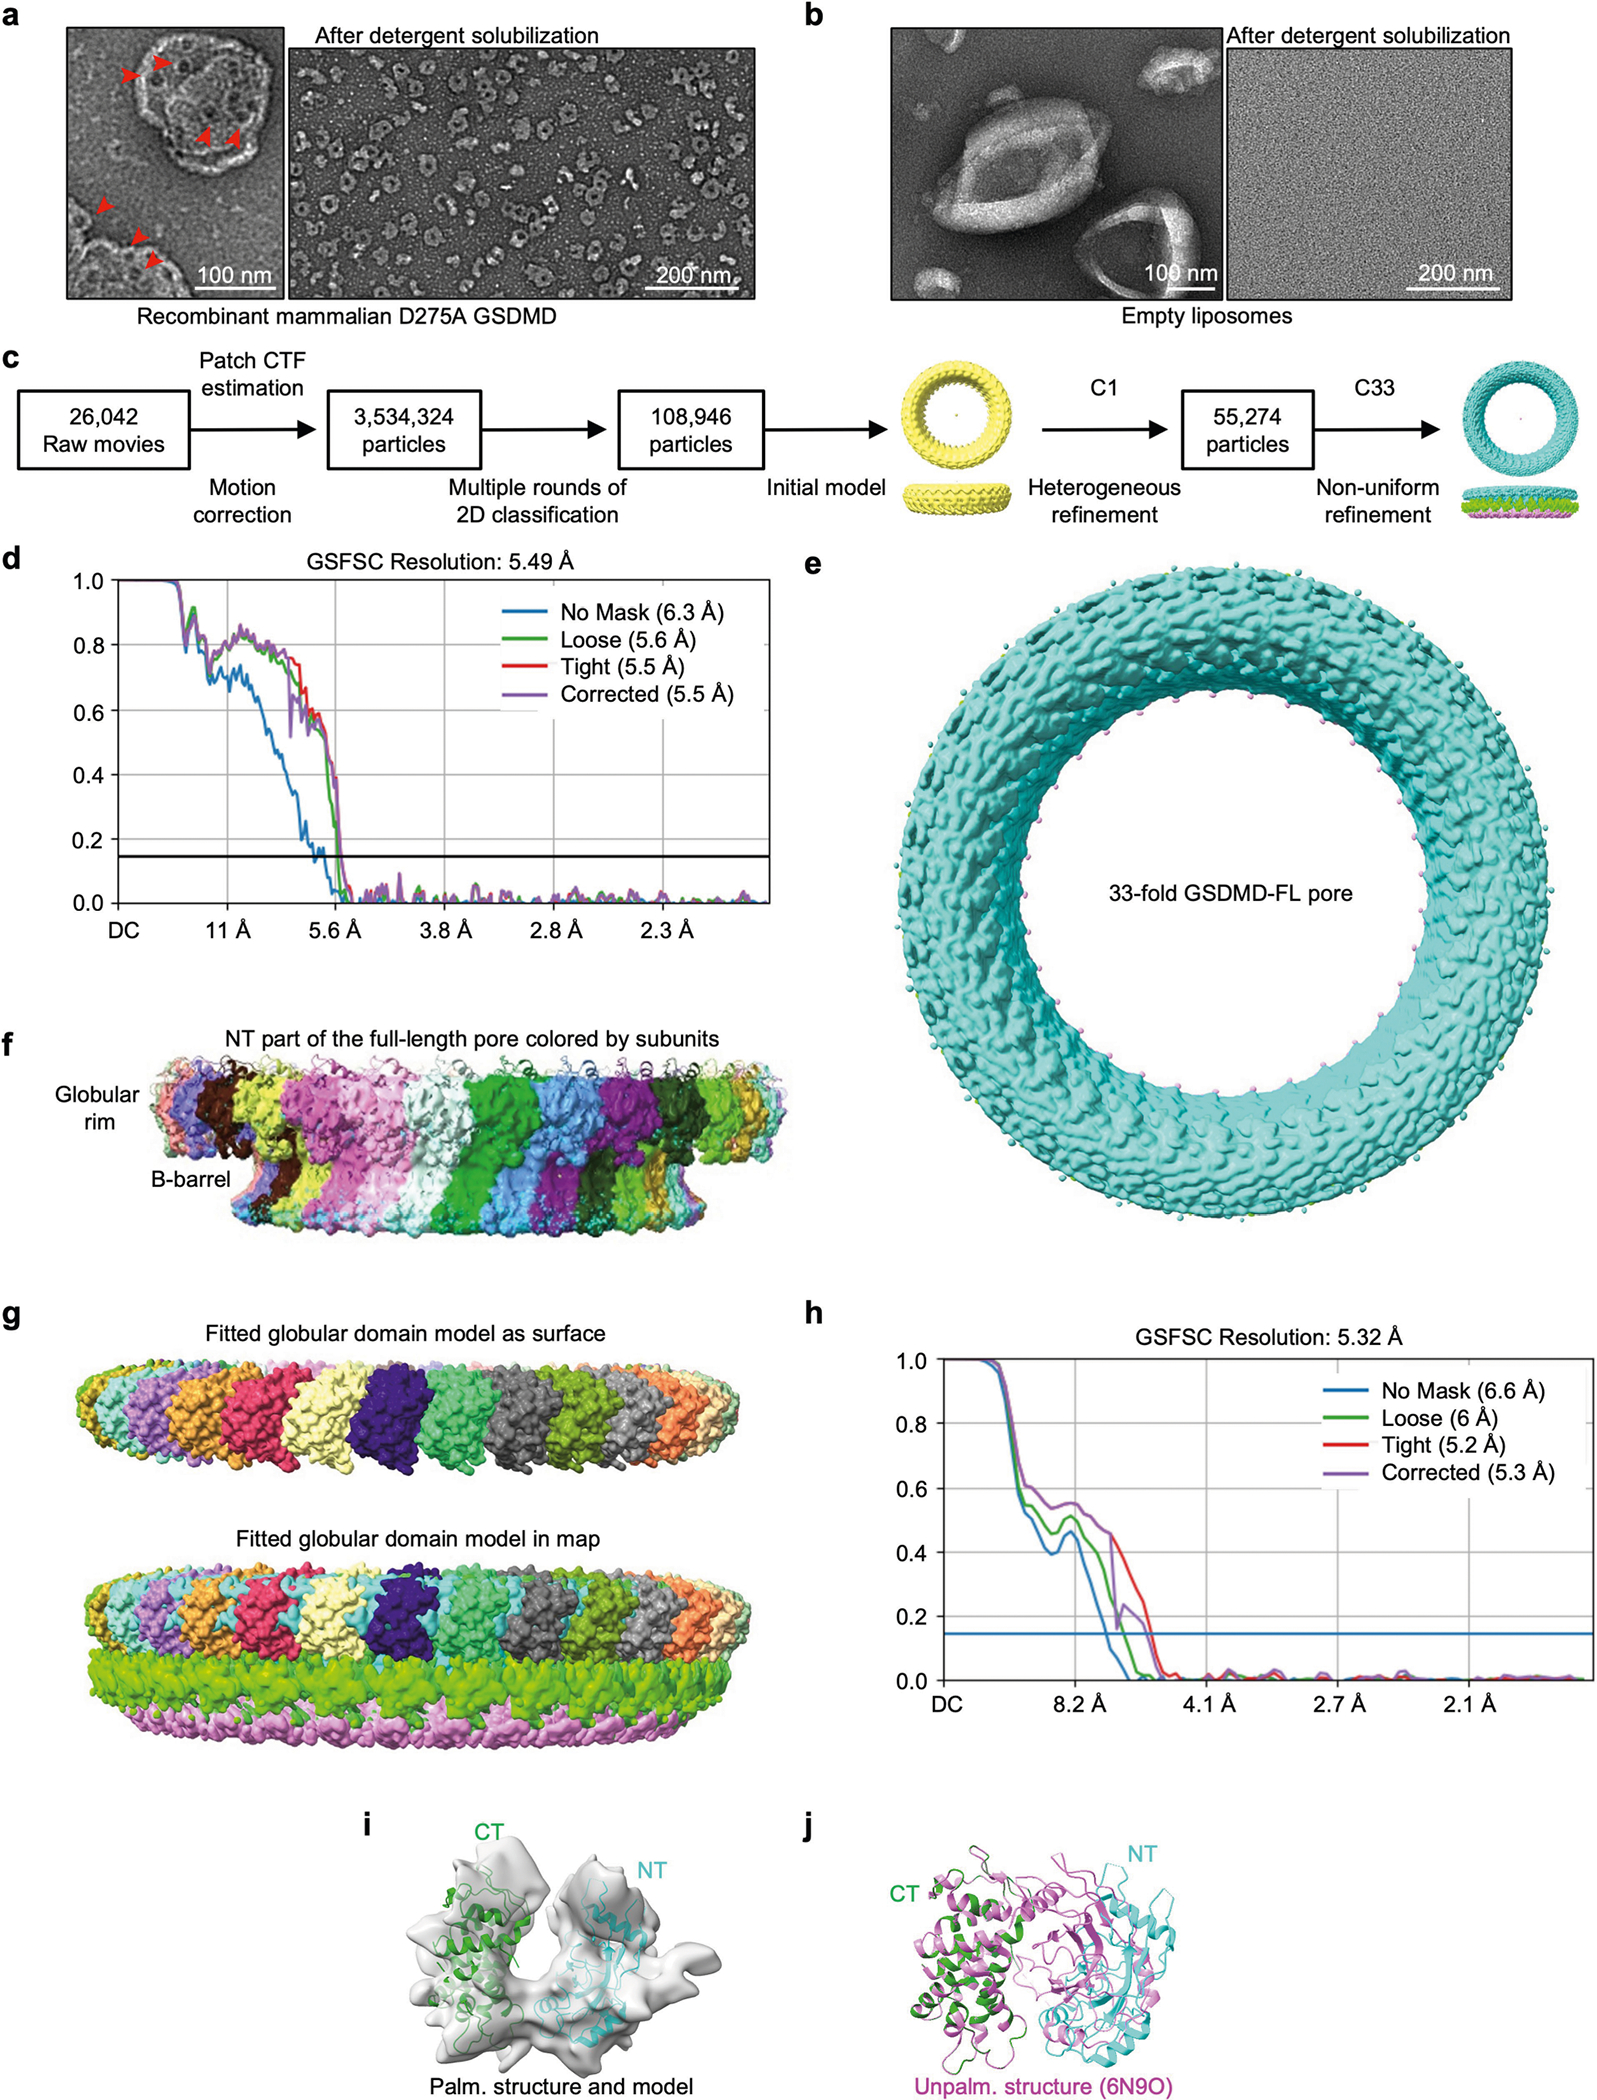
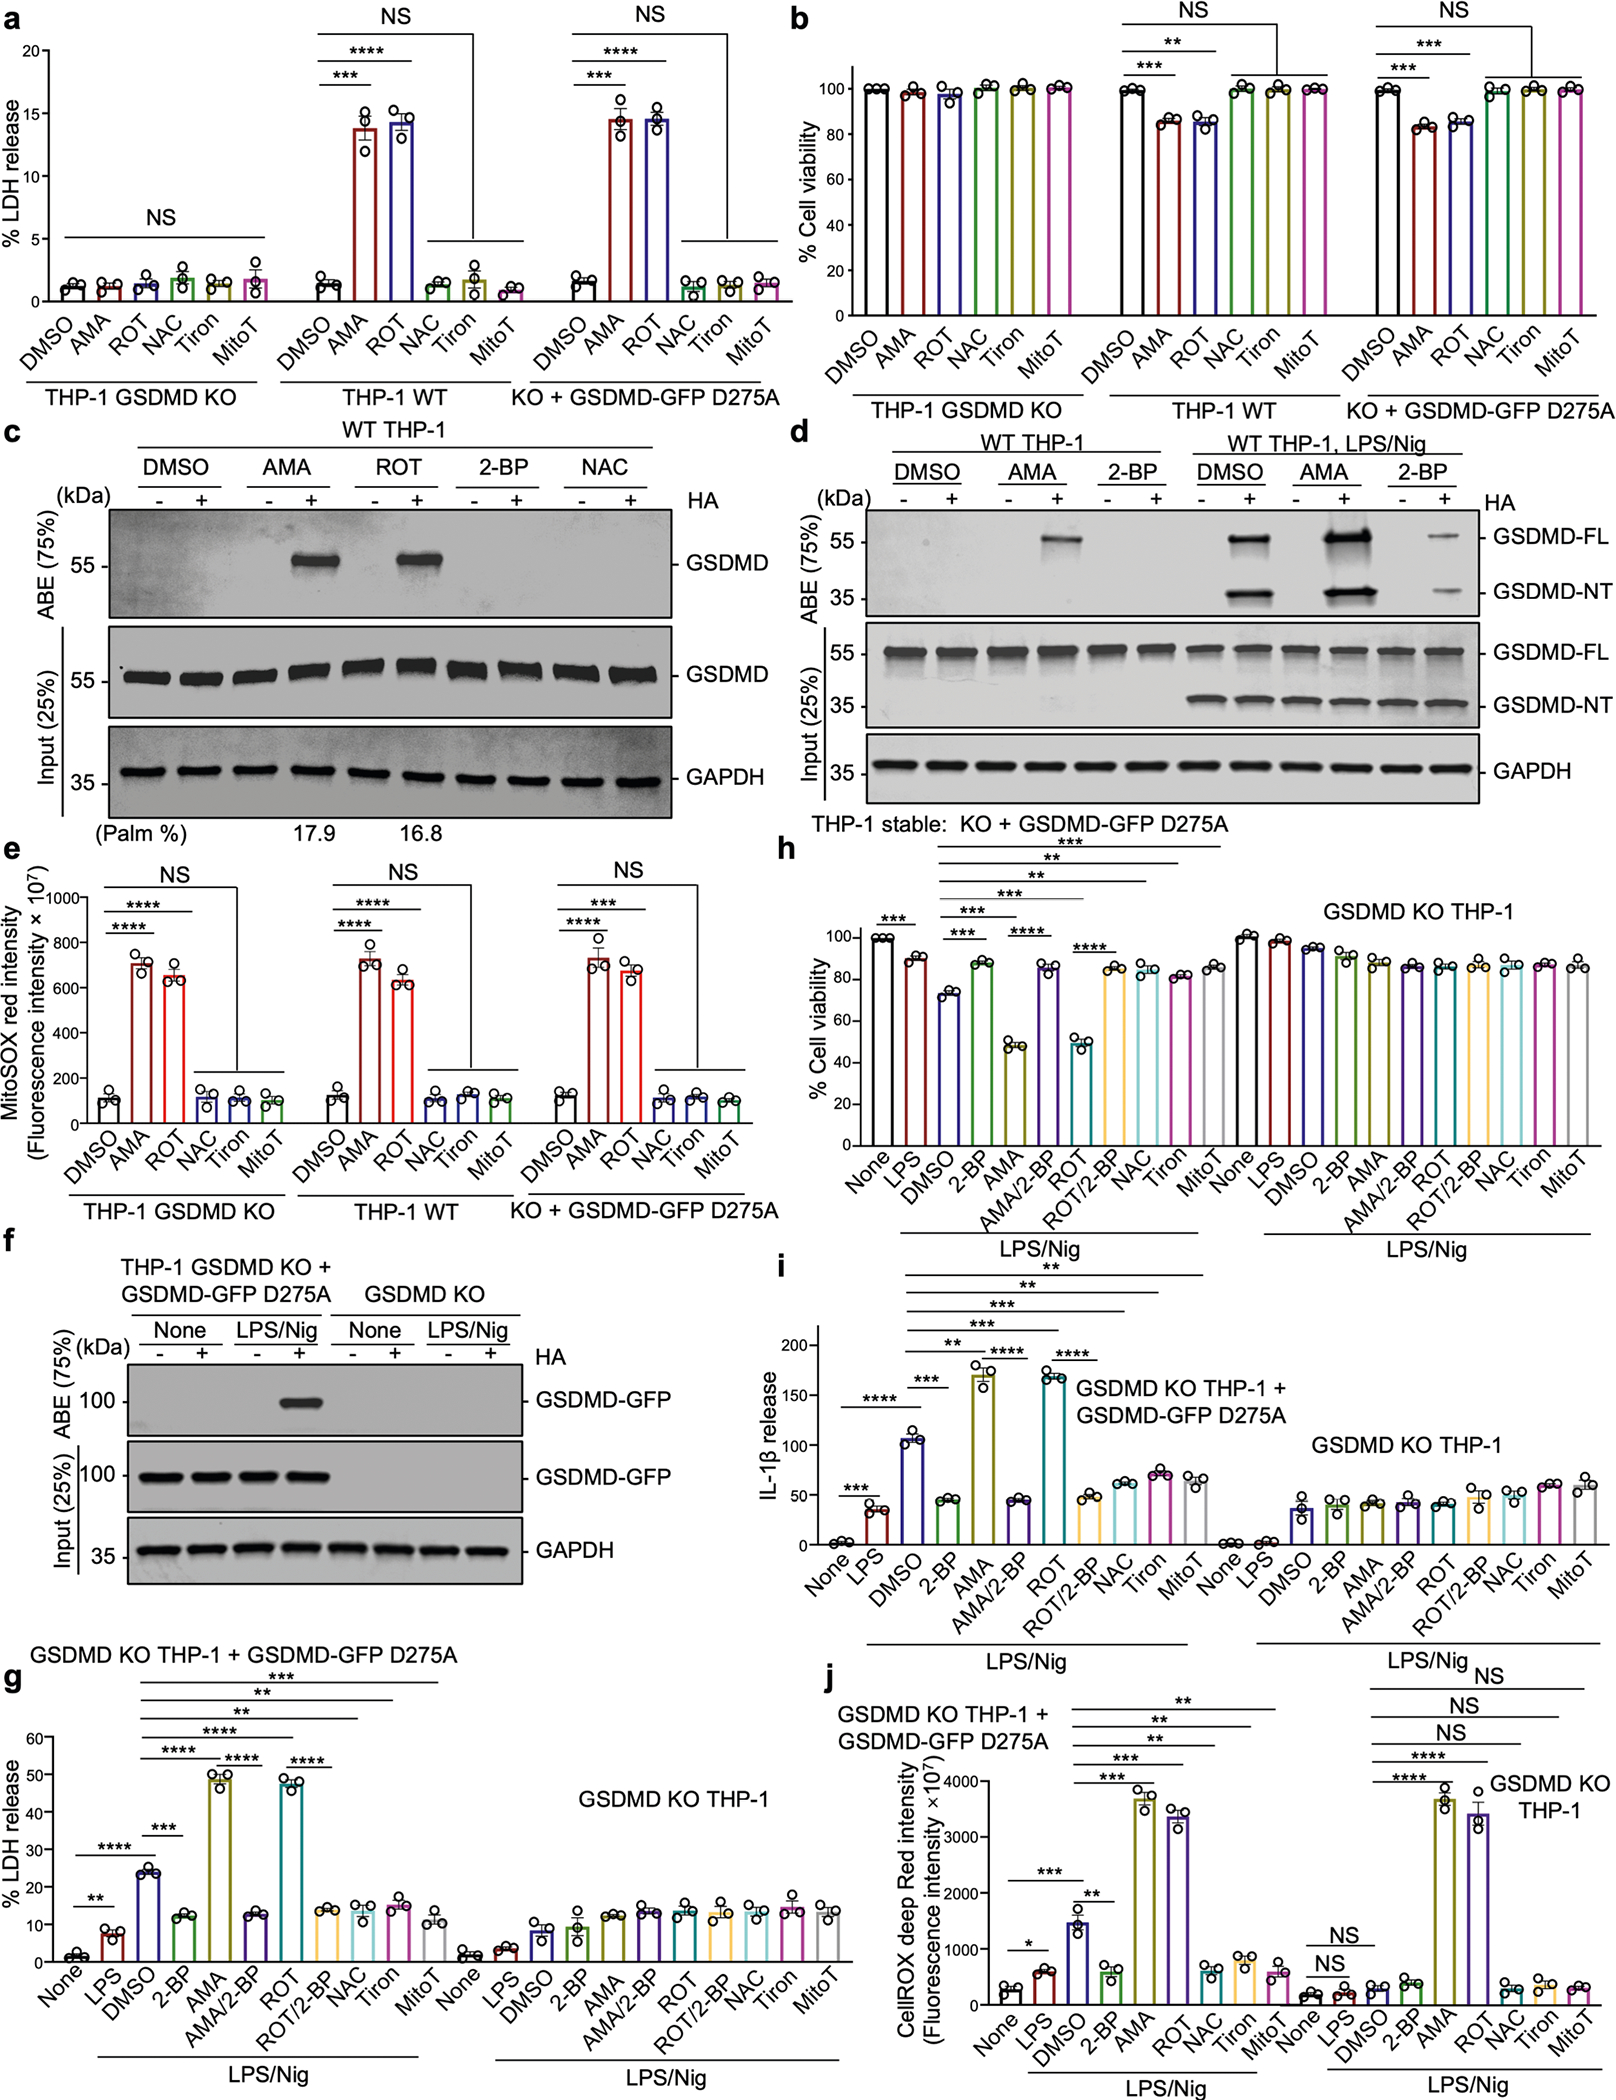
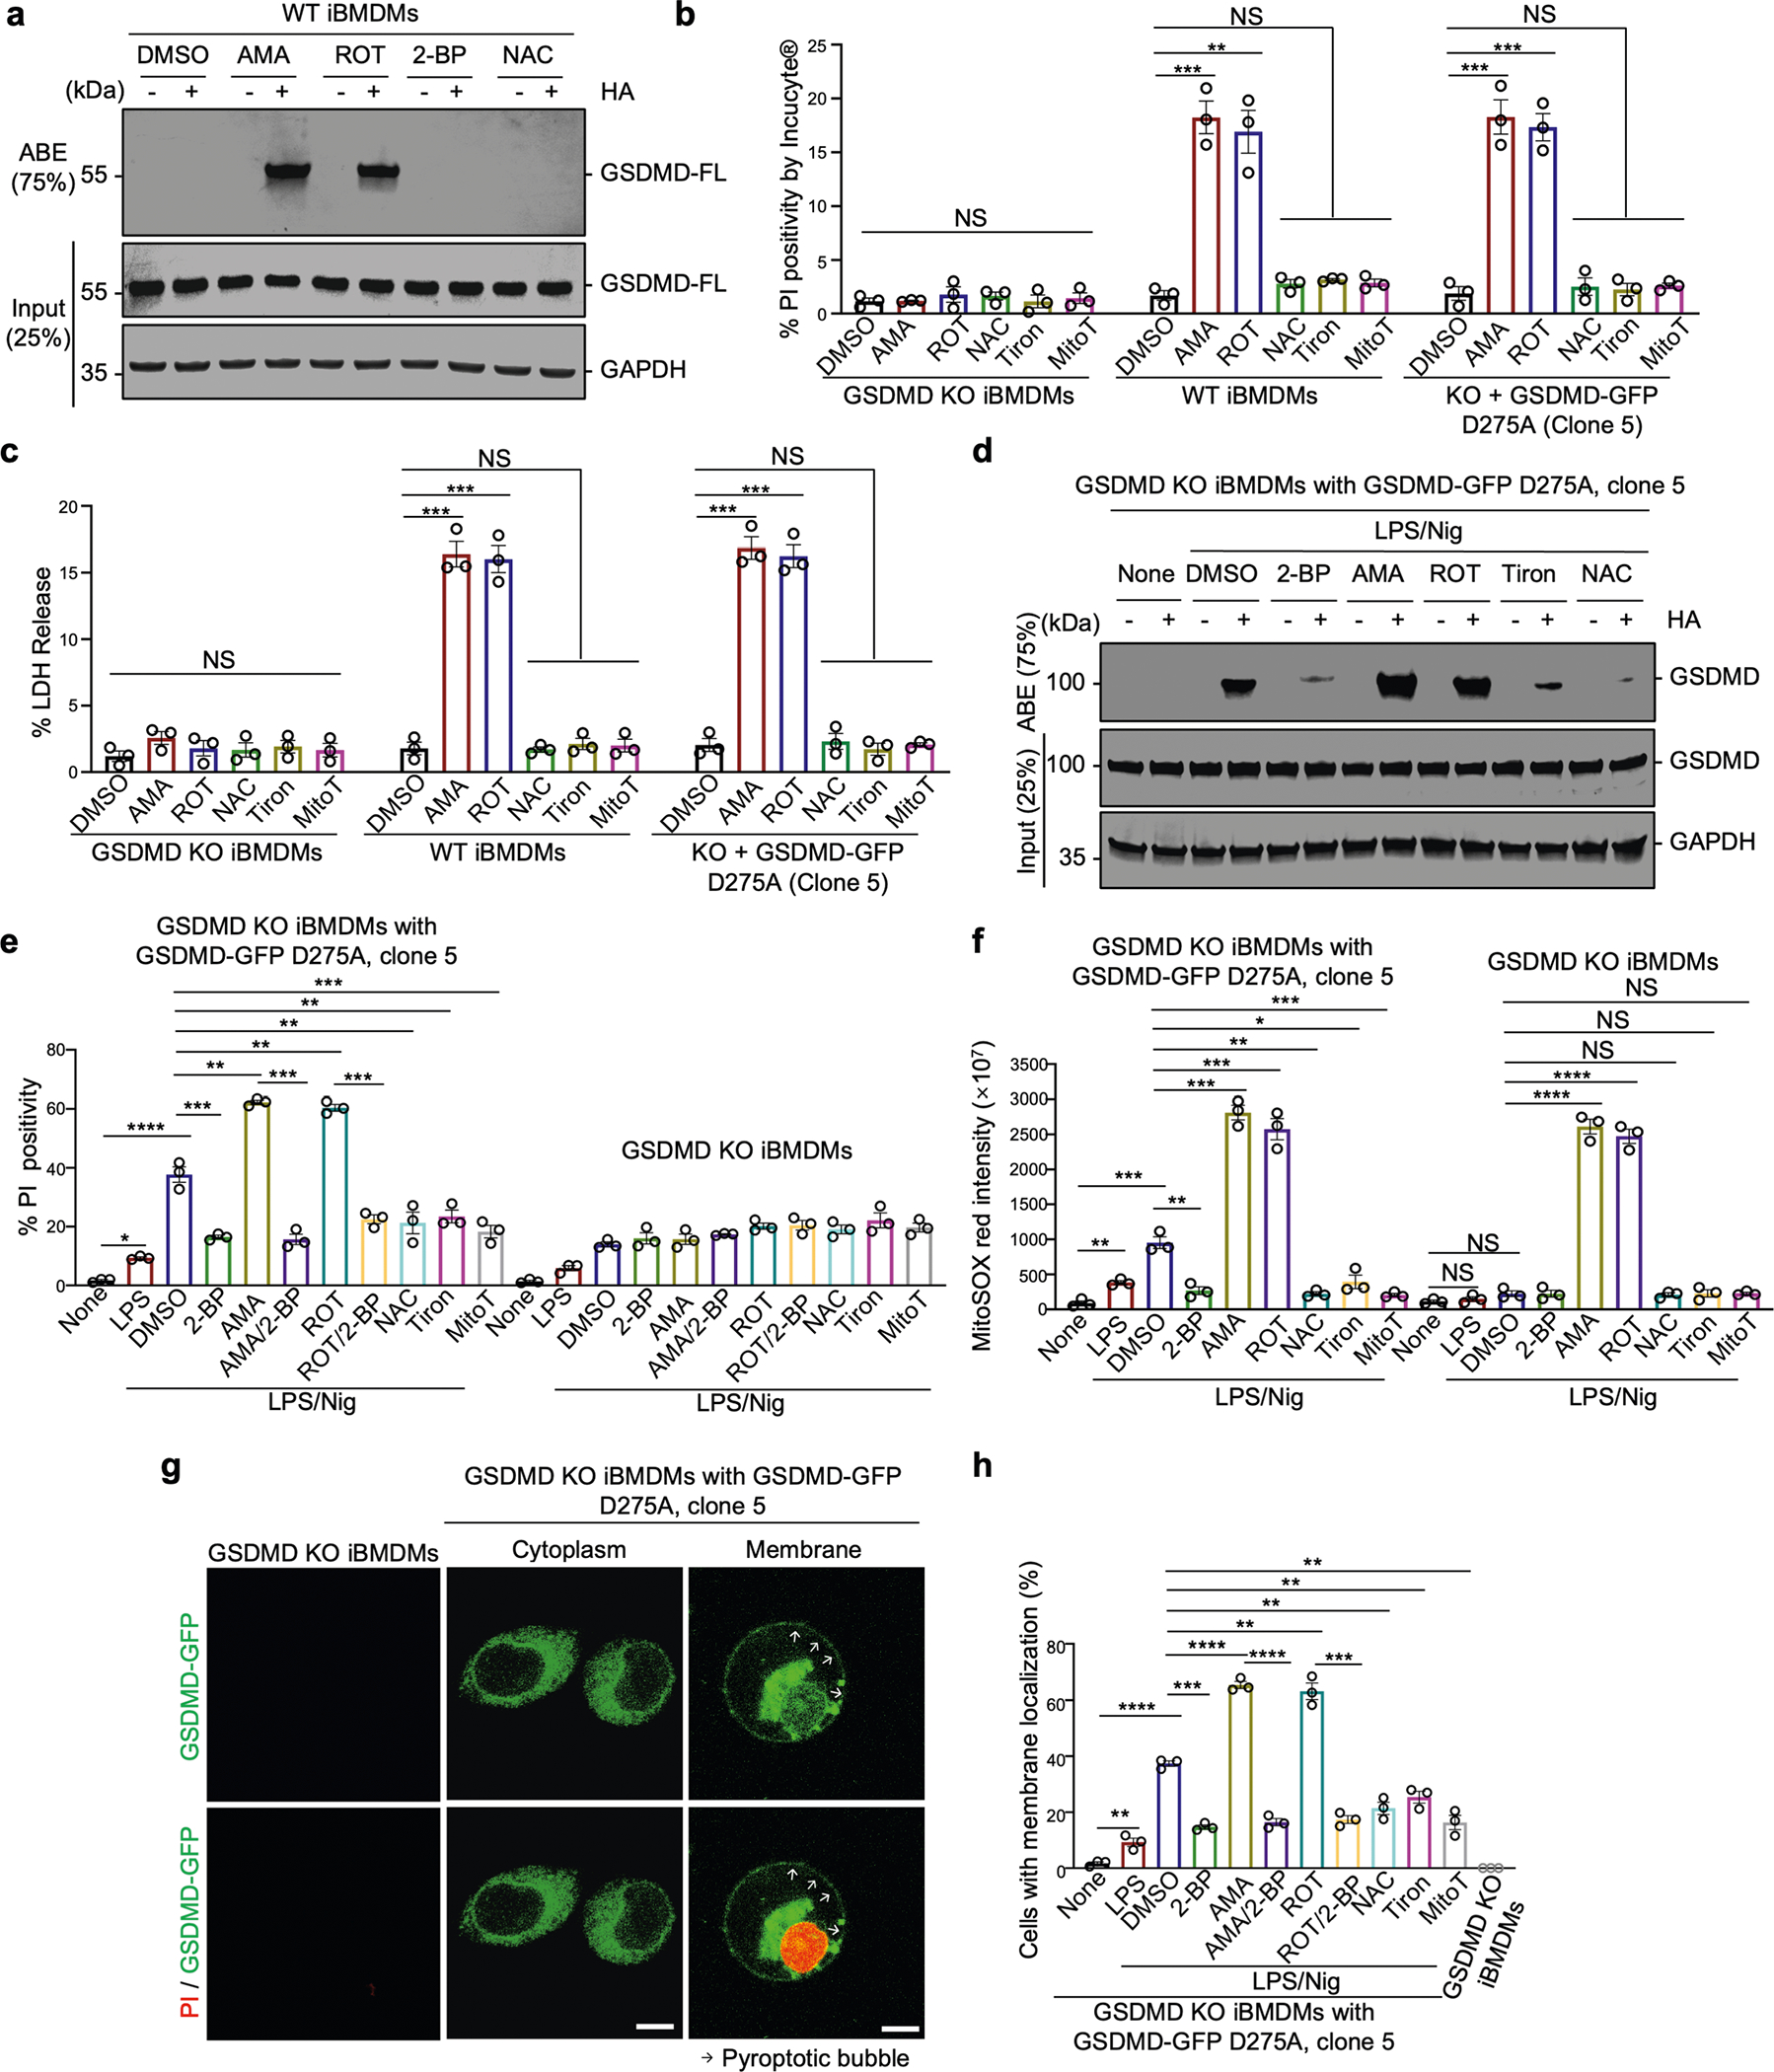
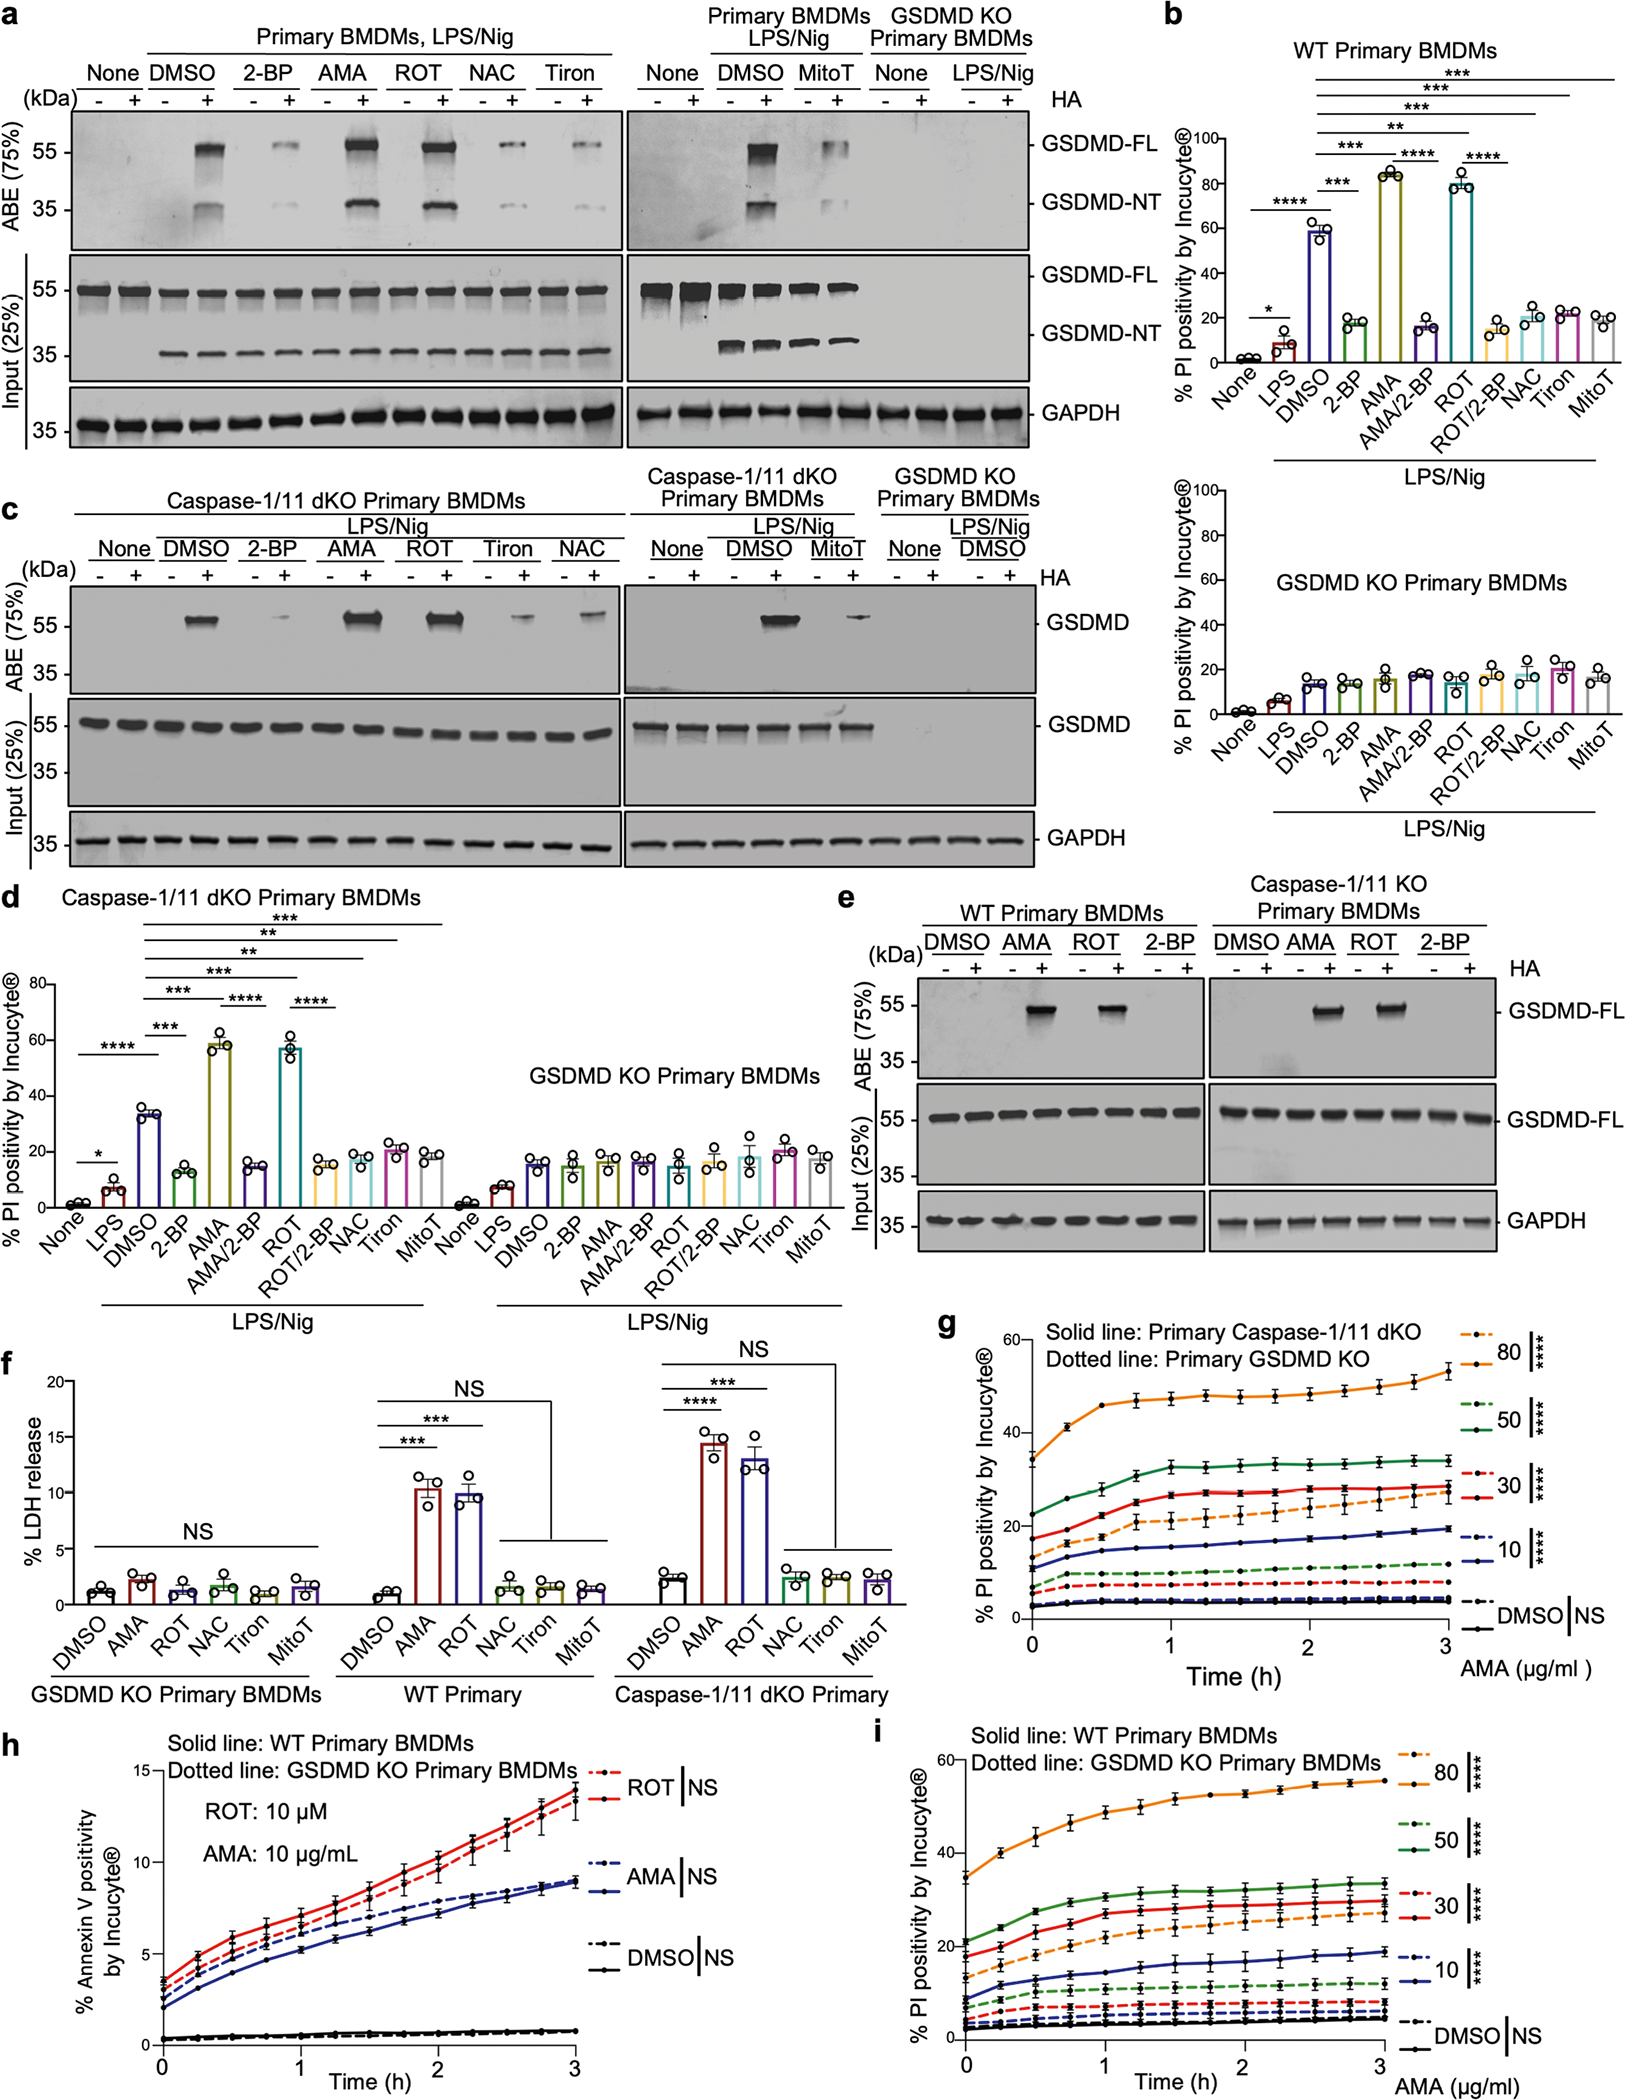
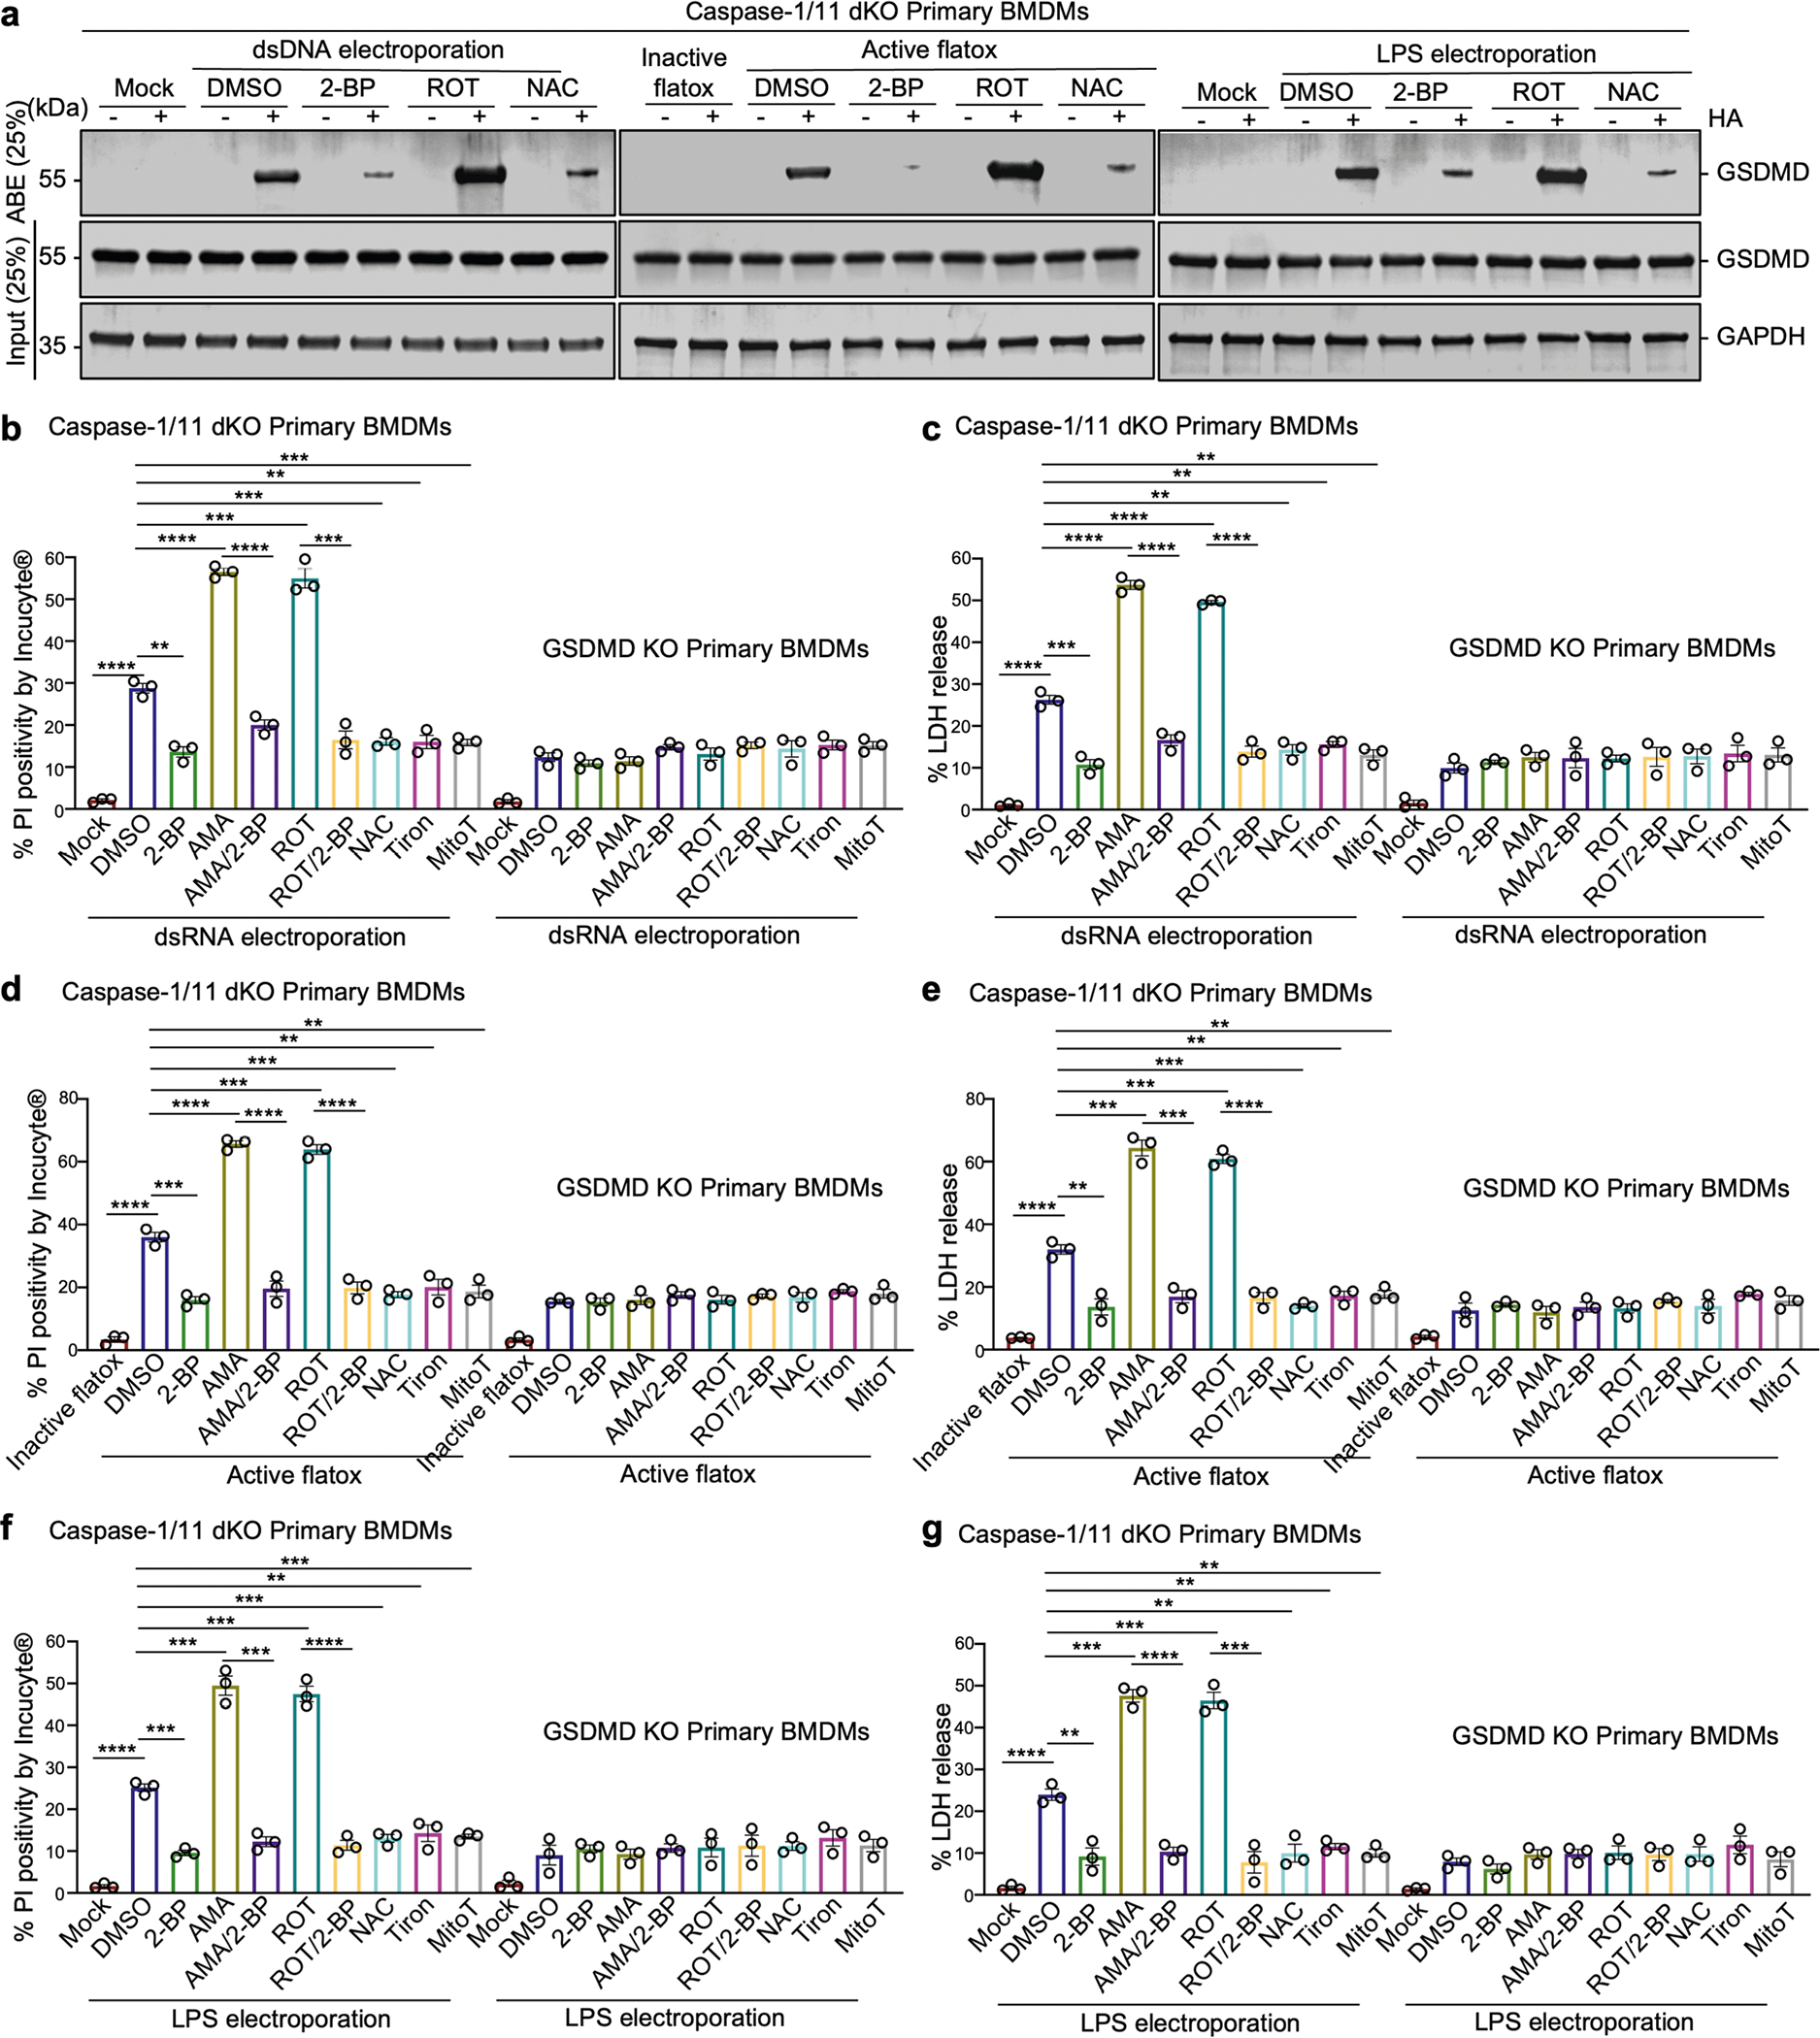
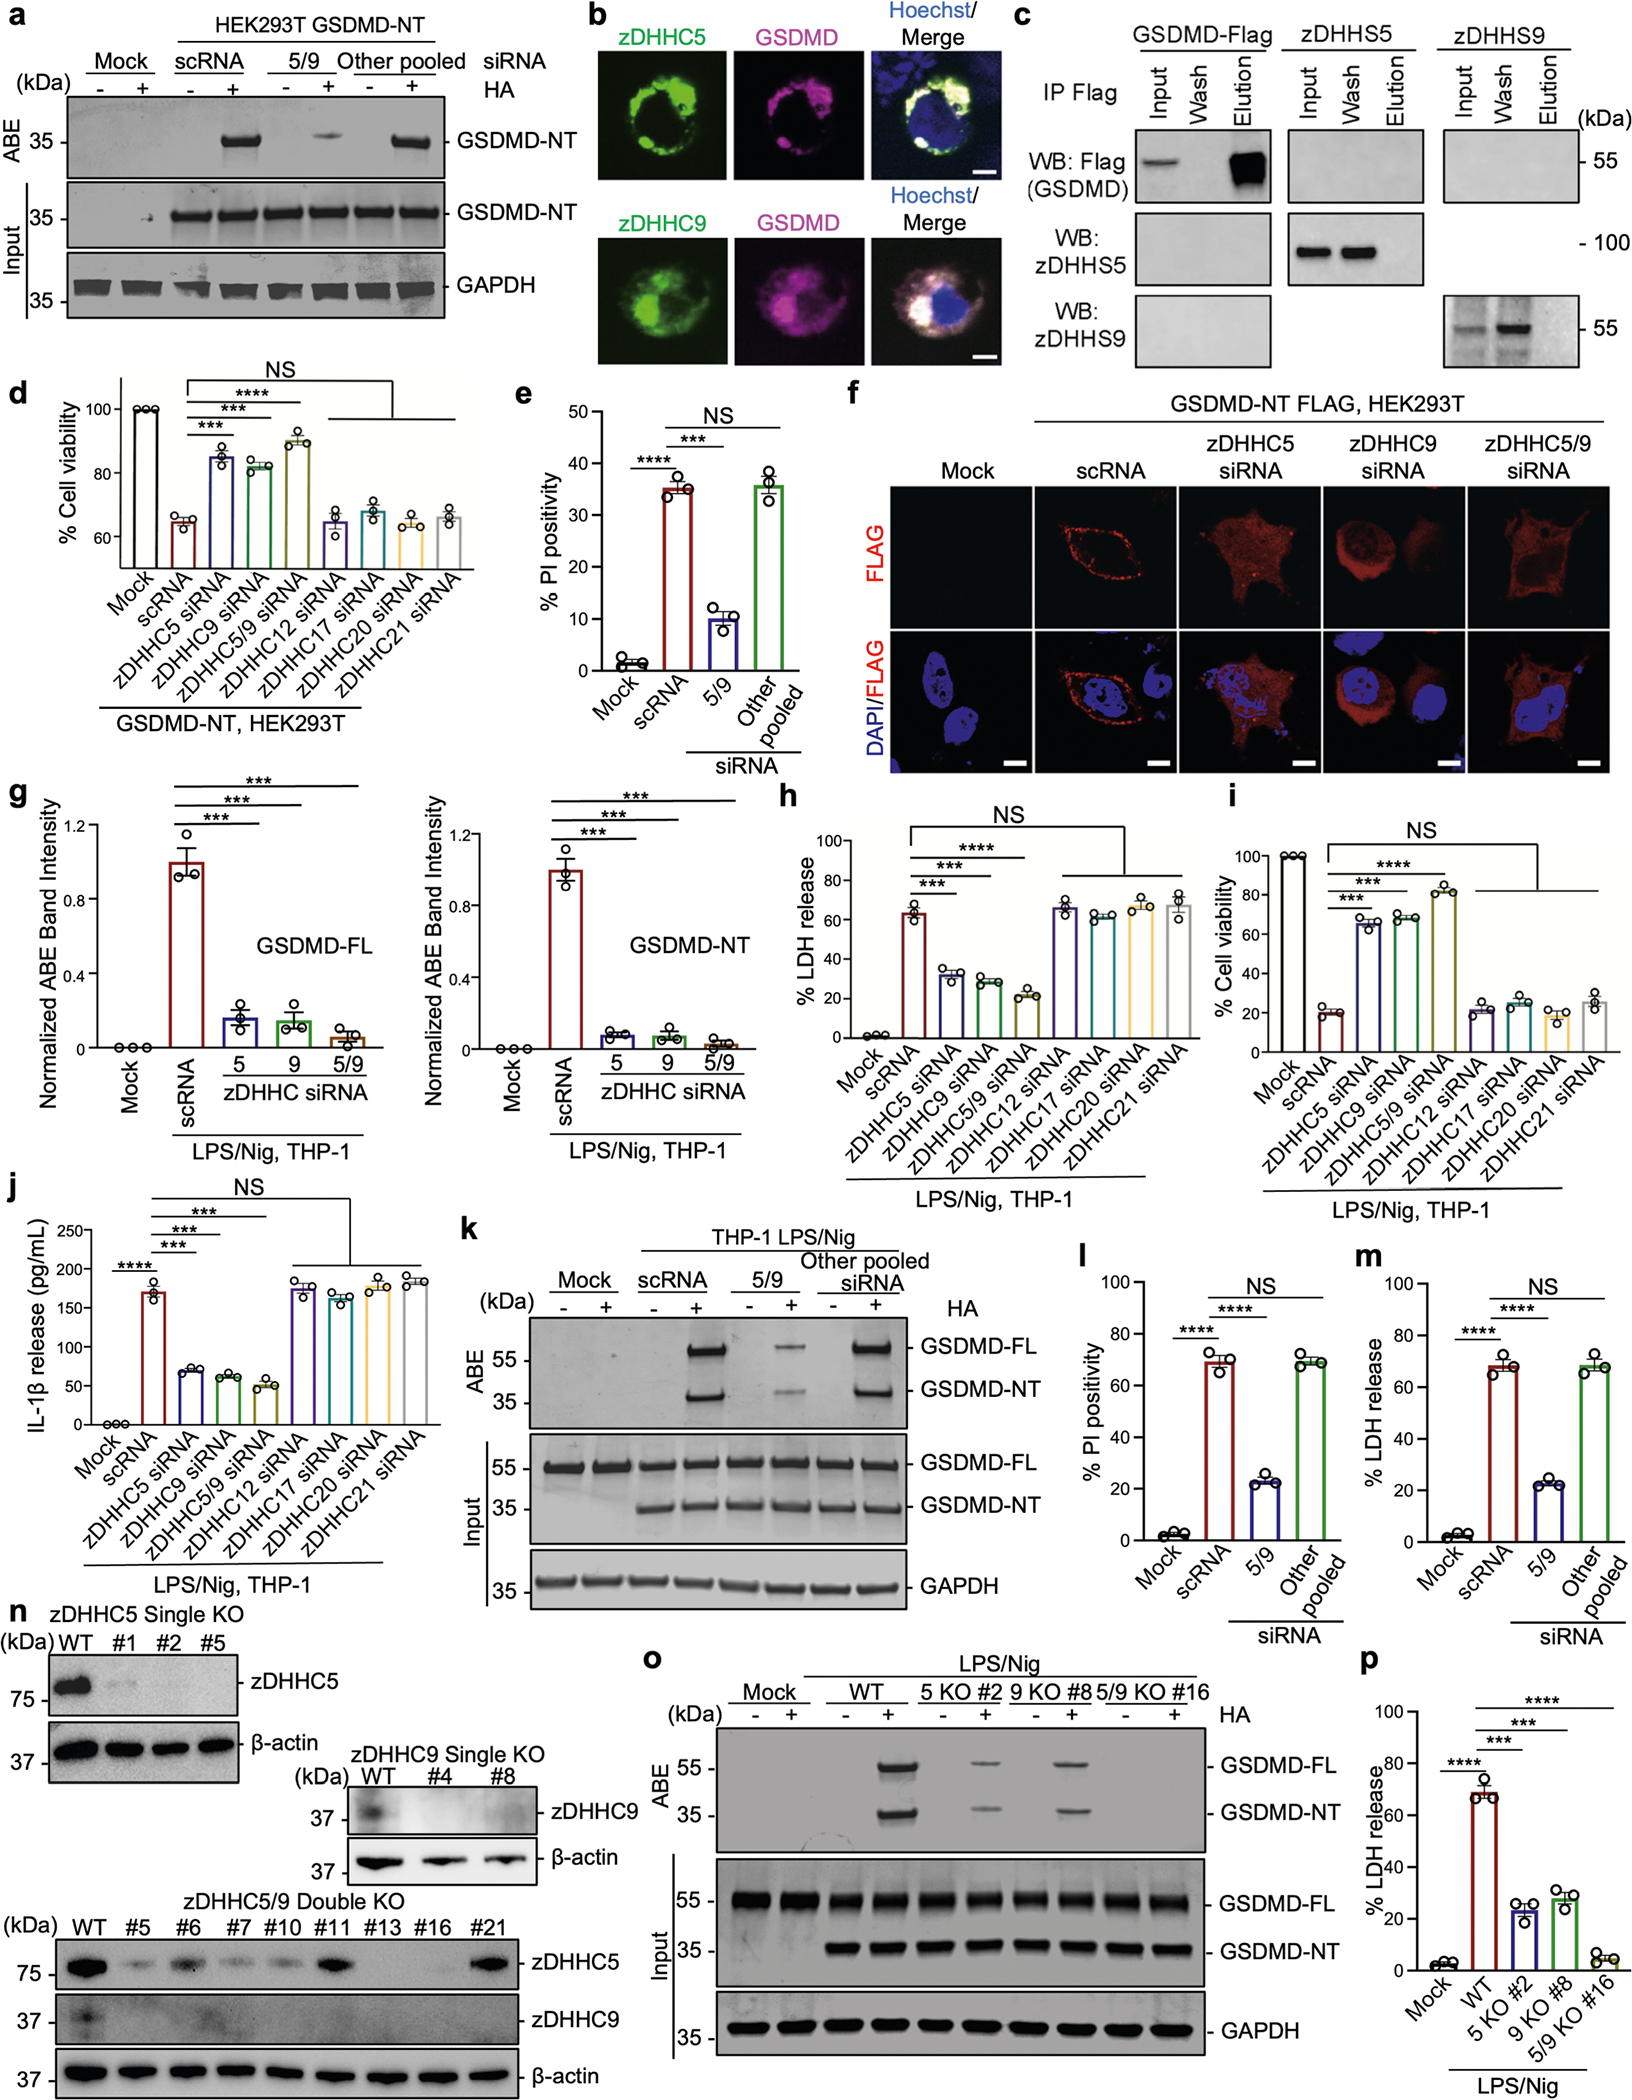
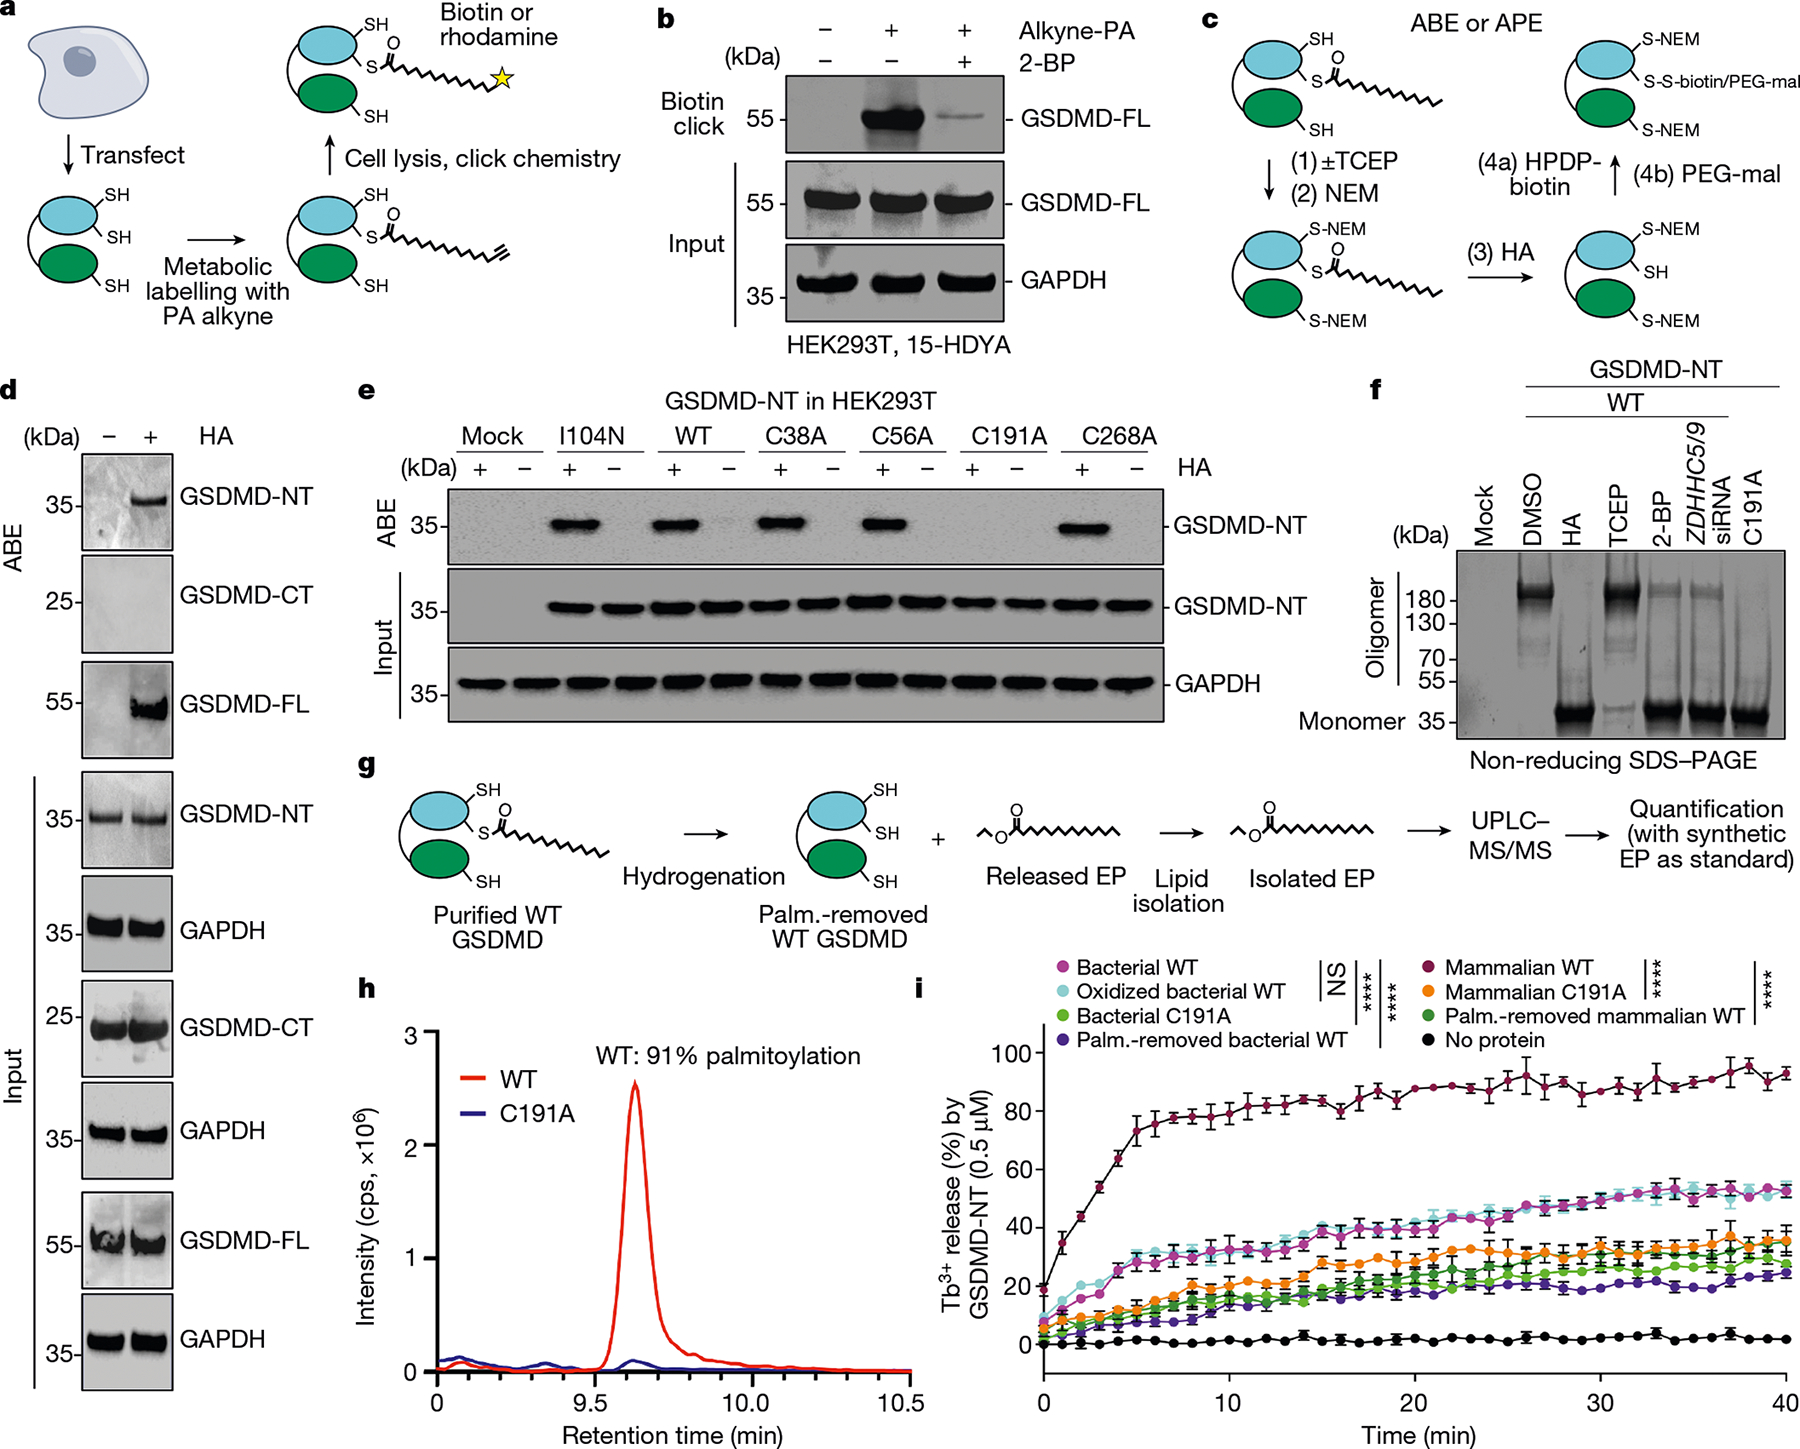
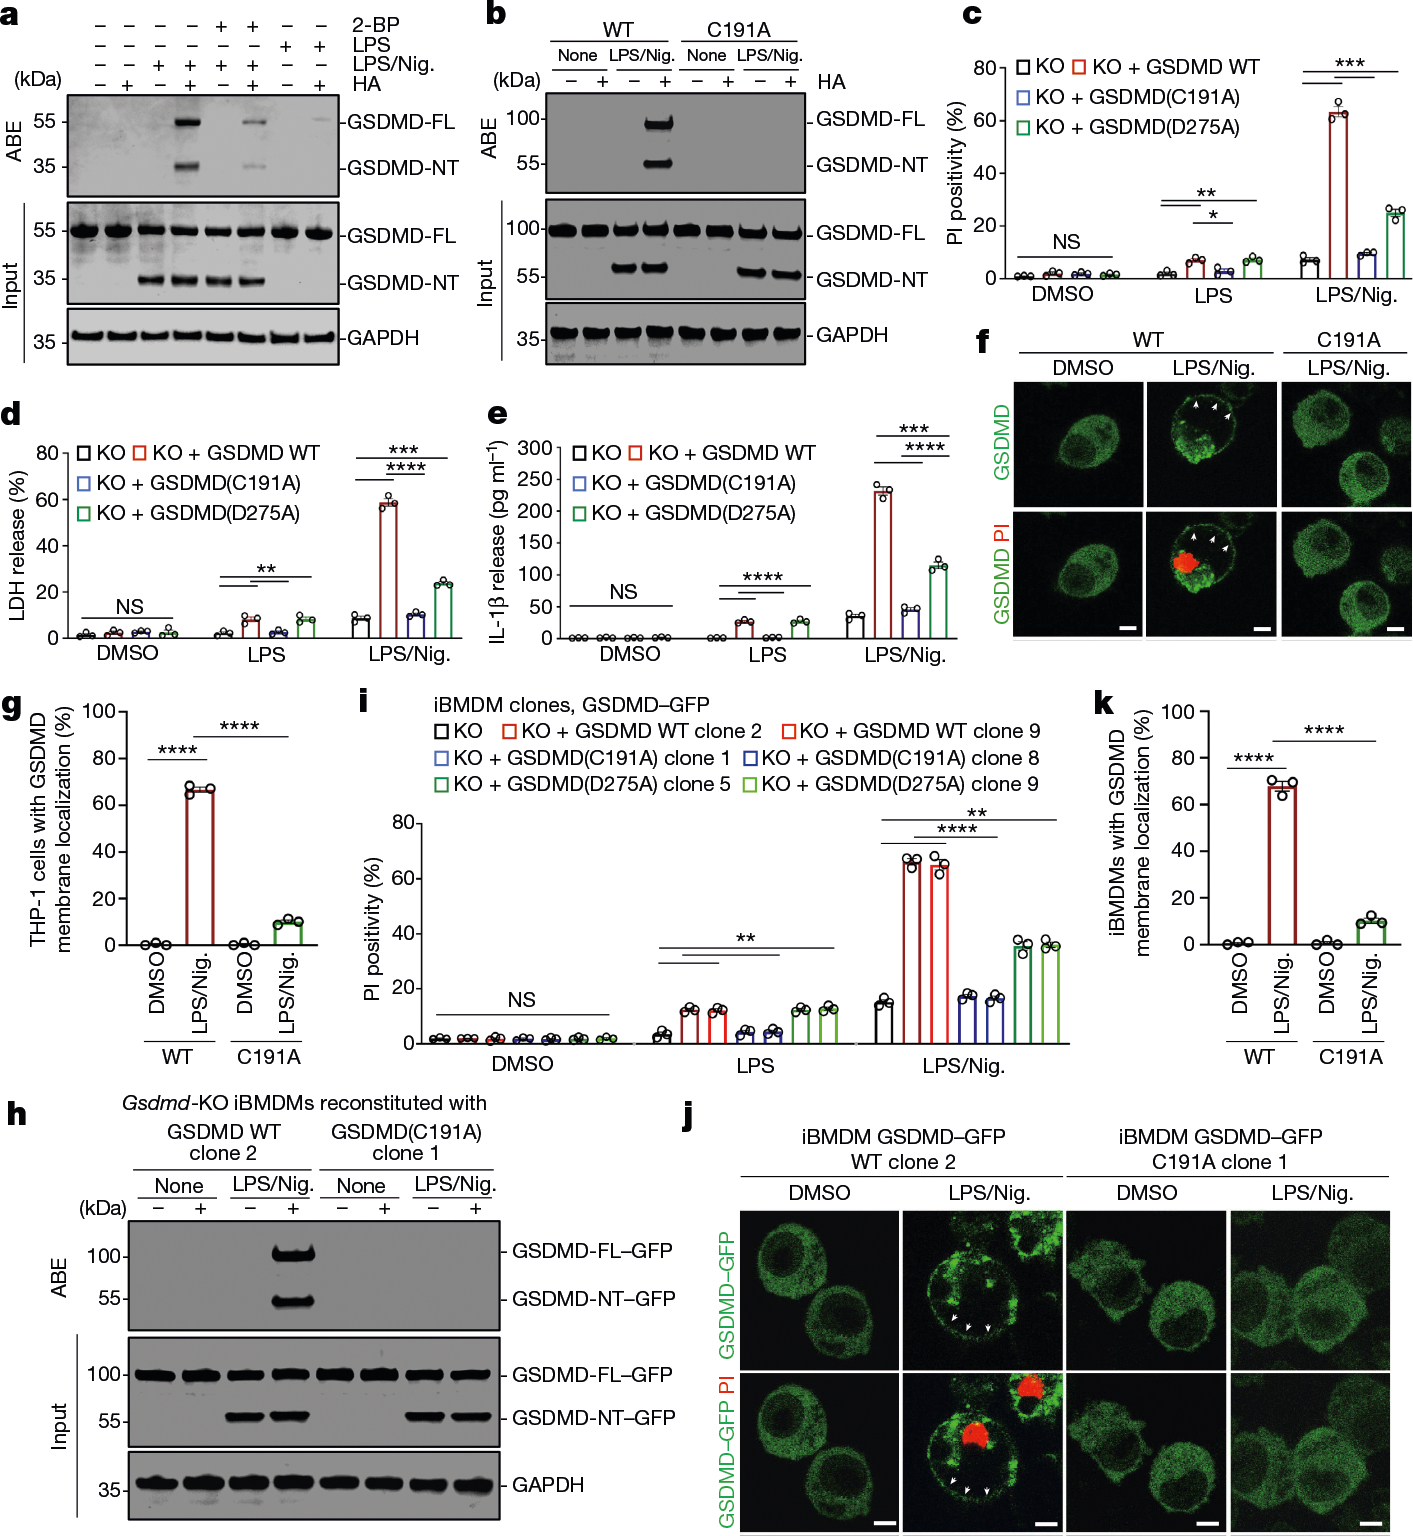
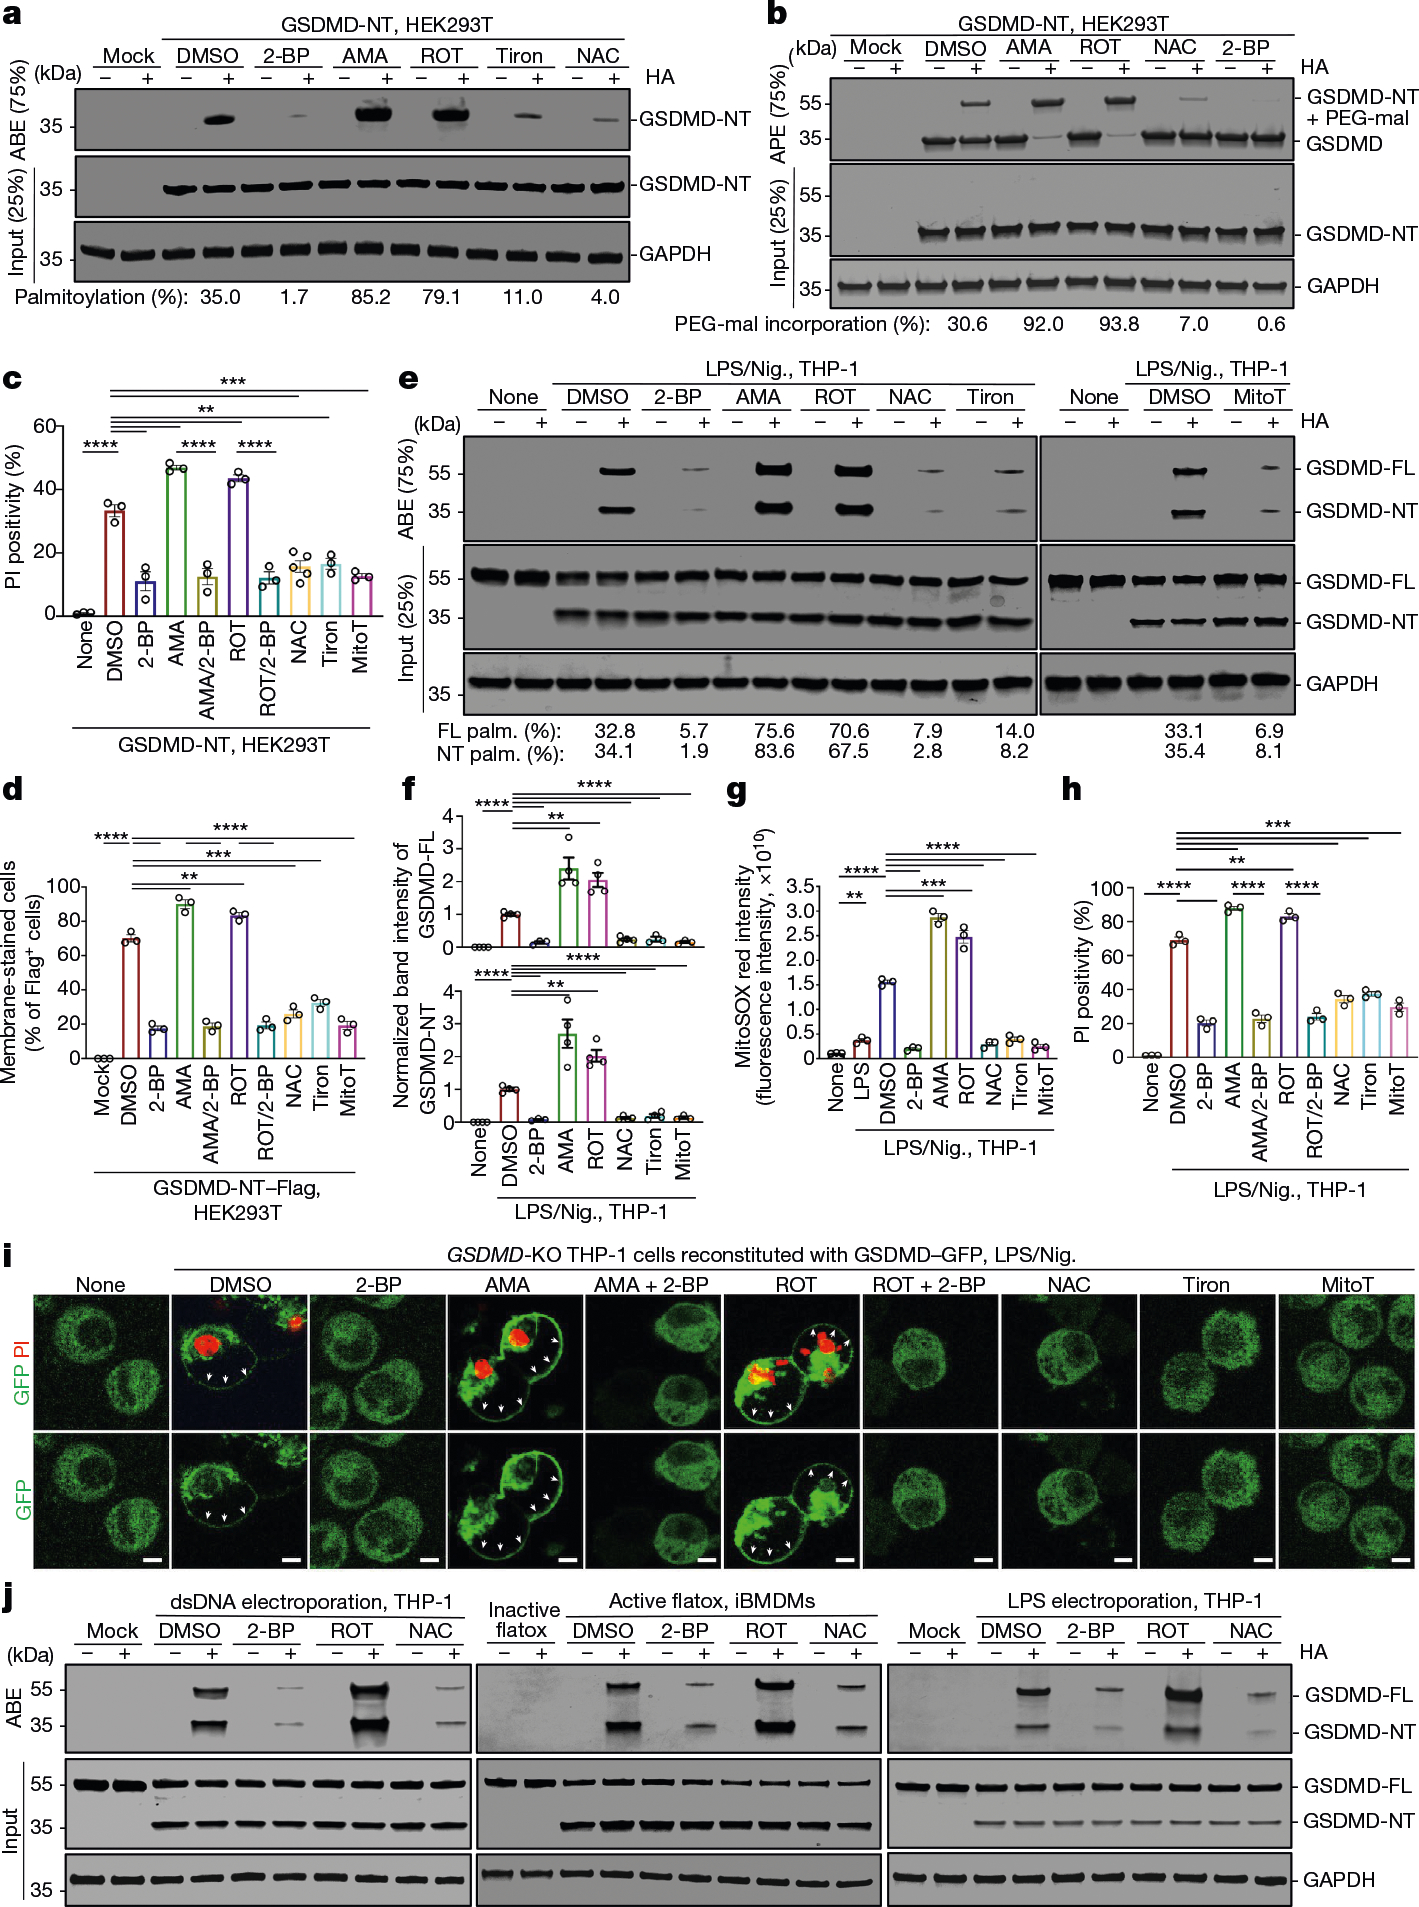
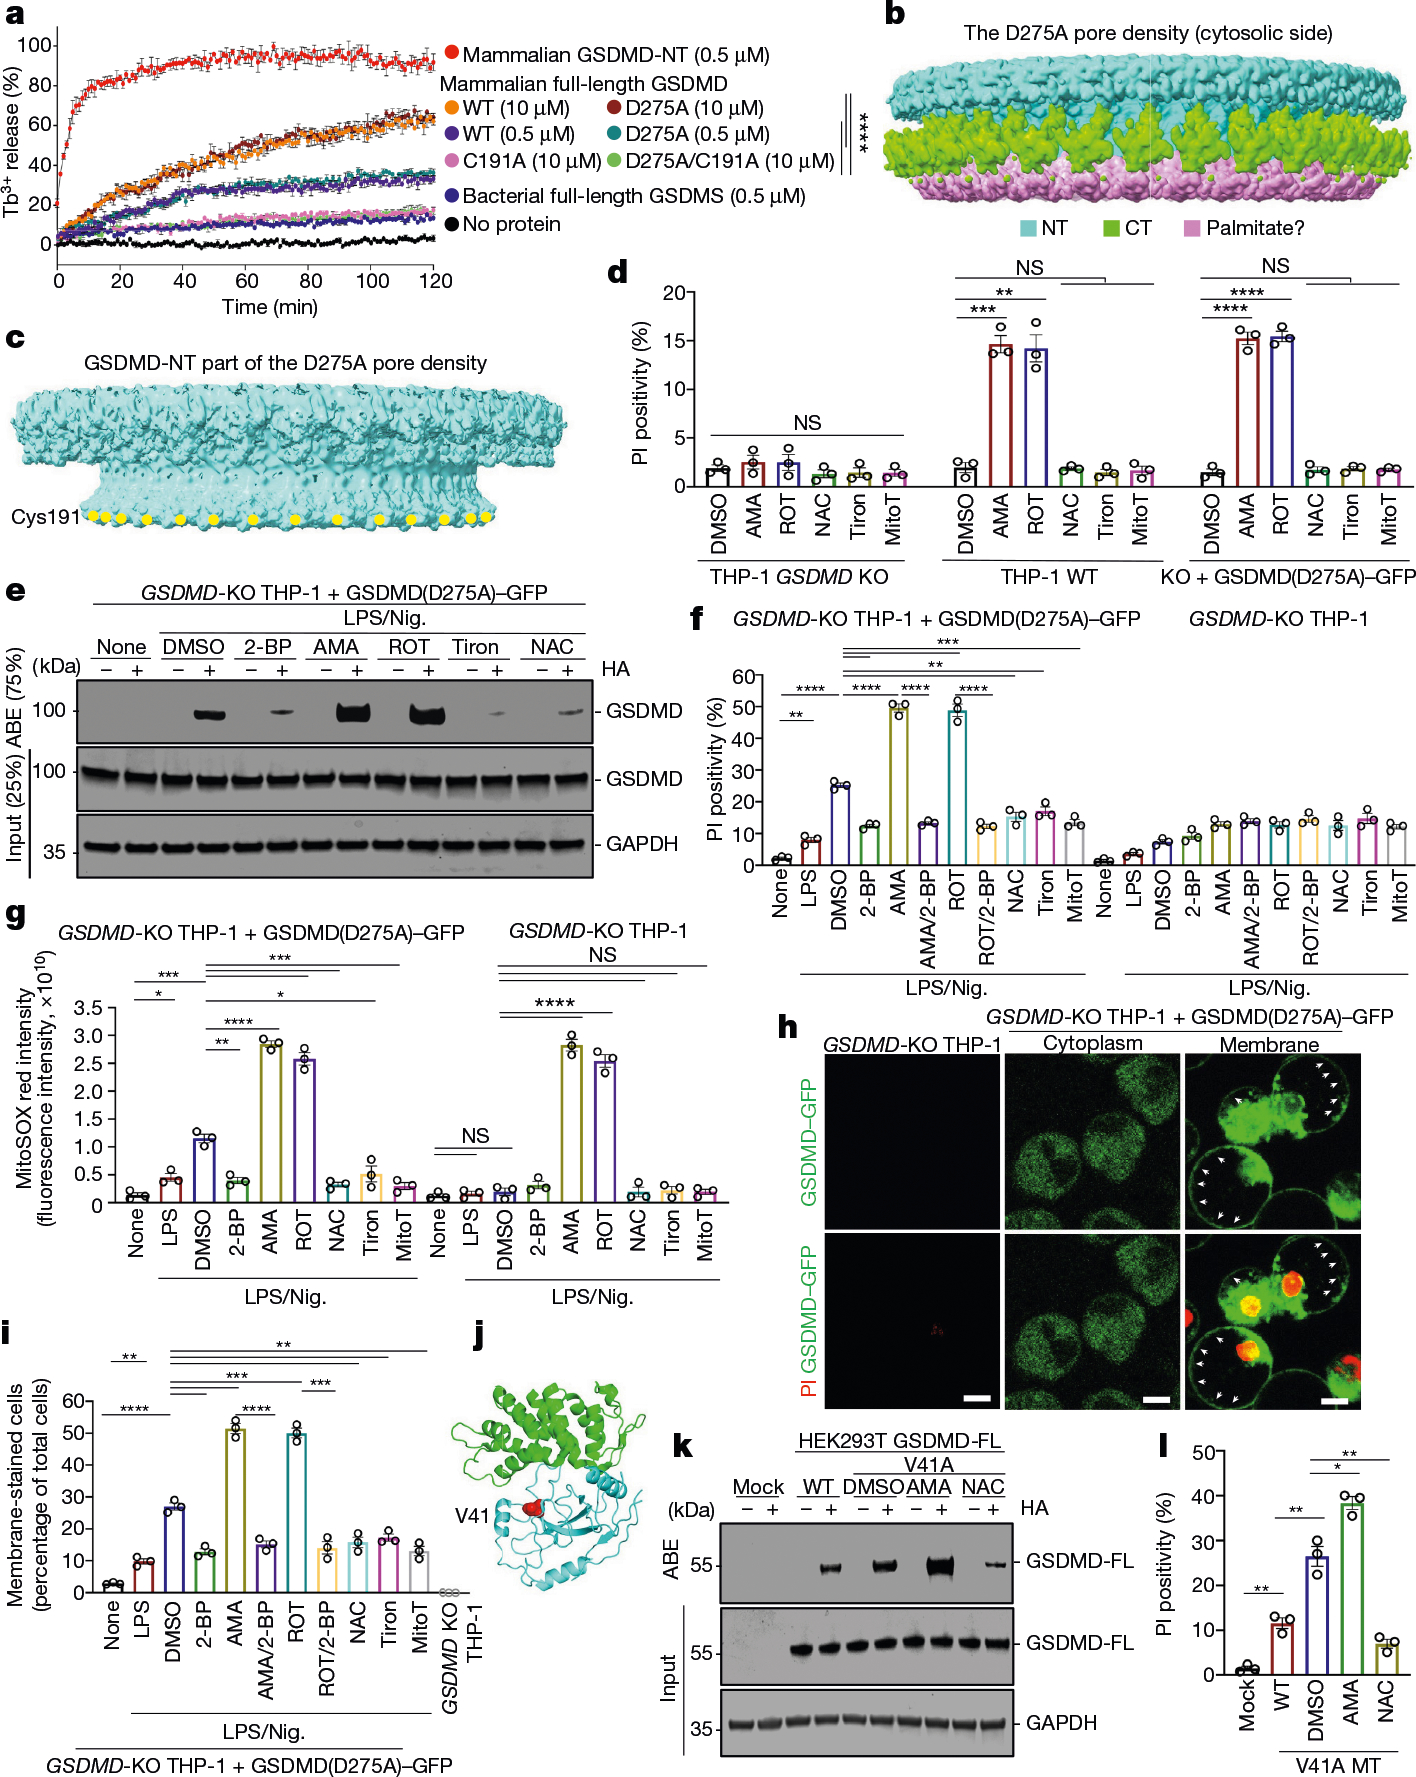
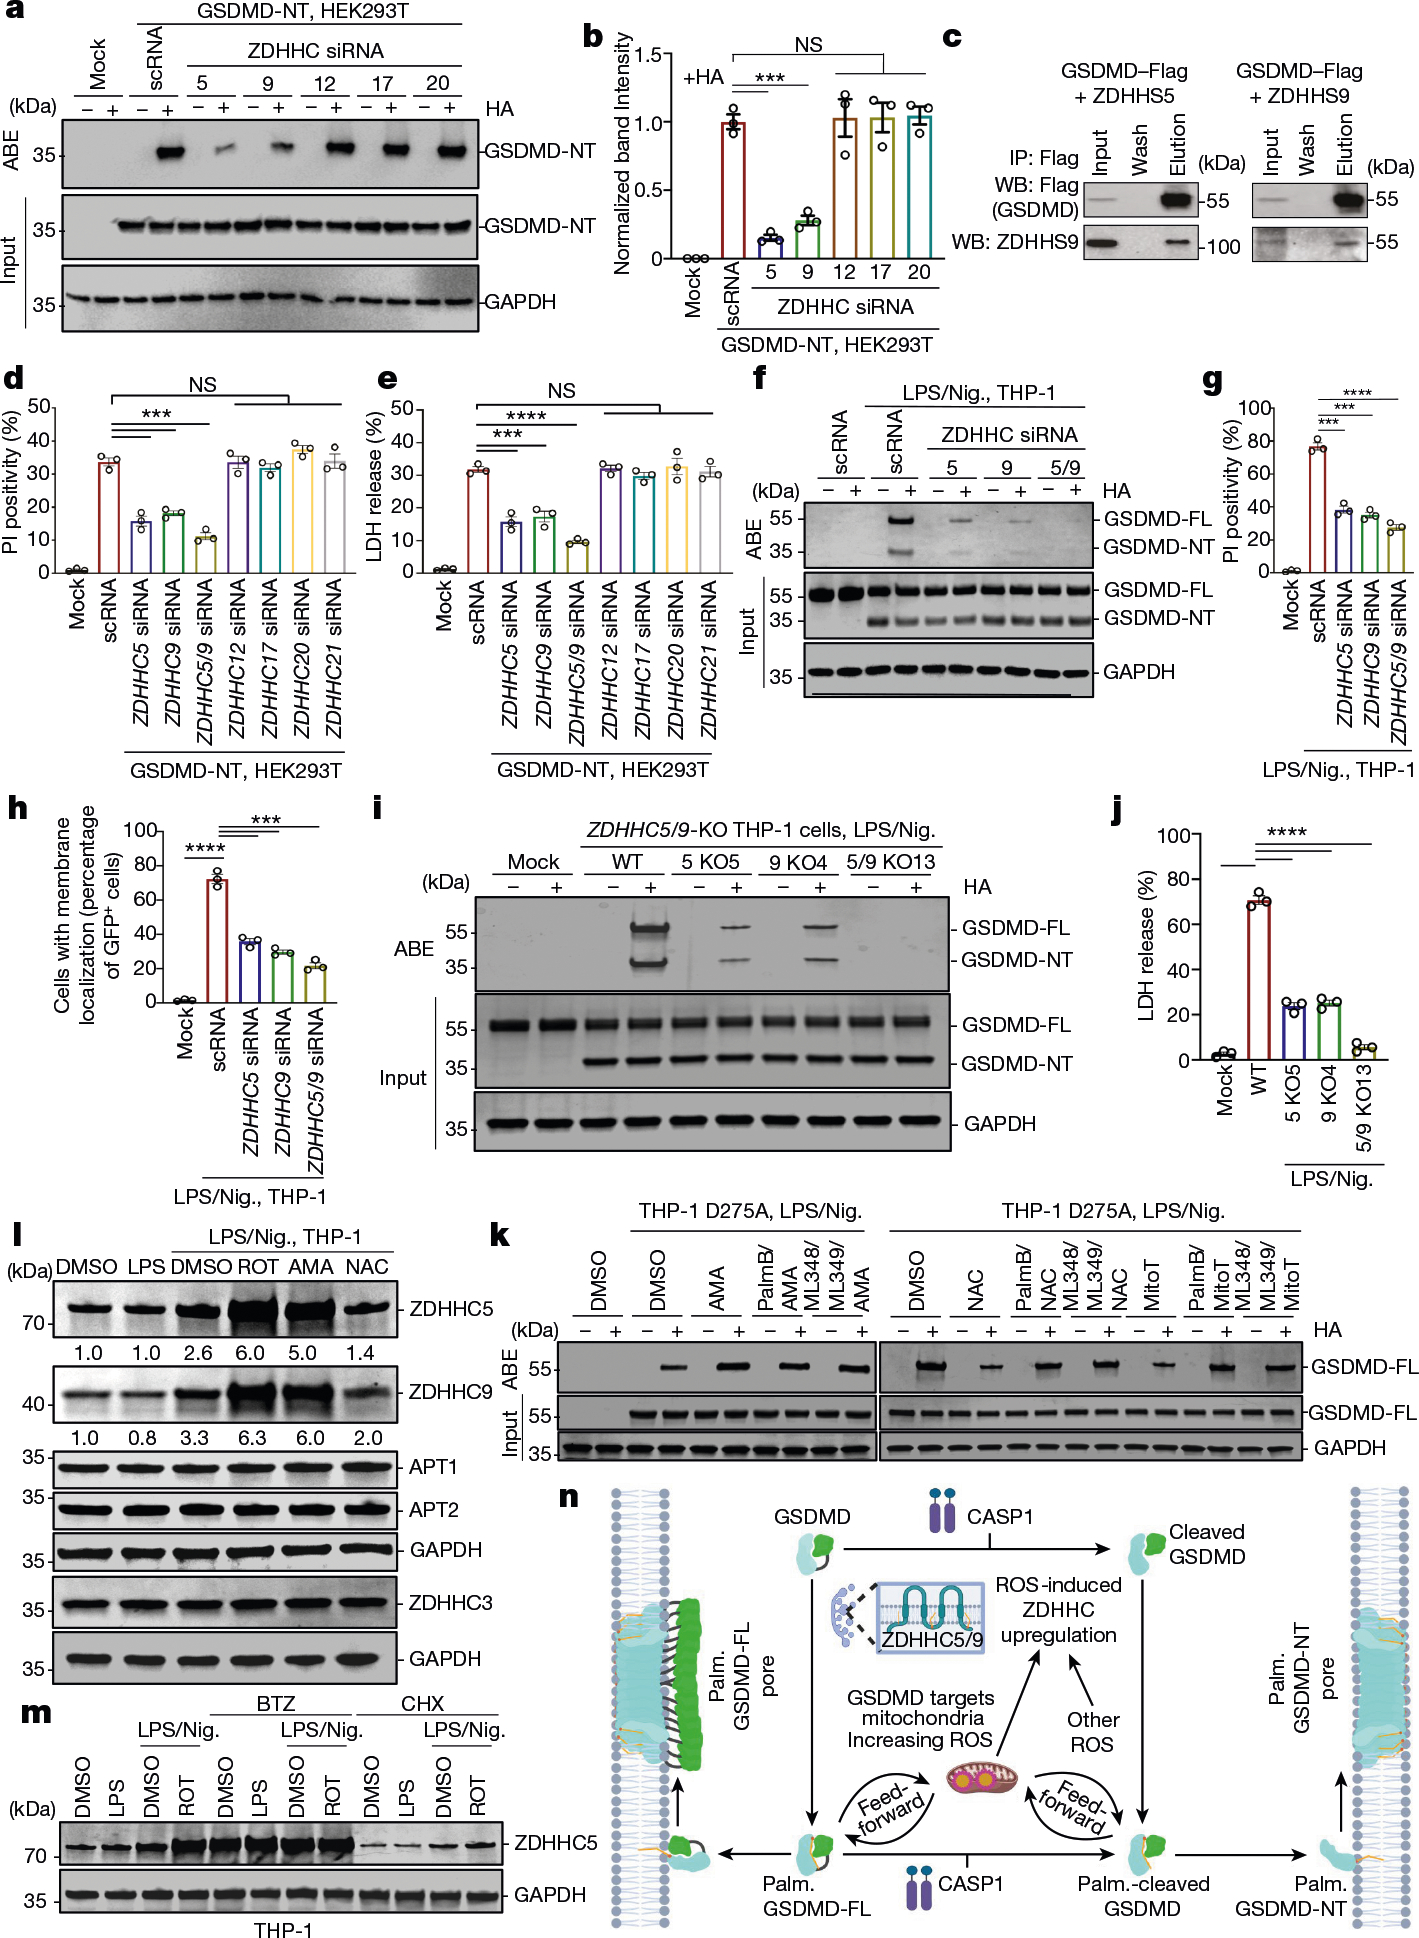
Gasdermin D (GSDMD) is the common effector for cytokine secretion and pyroptosis downstream of inflammasome activation and was previously shown to form large transmembrane pores after cleavage by inflammatory caspases to generate the GSDMD N-terminal domain (GSDMD-NT)1-10. Here we report that GSDMD Cys191 is S-palmitoylated and that palmitoylation is required for pore formation. S-palmitoylation, which does not affect GSDMD cleavage, is augmented by mitochondria-generated reactive oxygen species (ROS). Cleavage-deficient GSDMD (D275A) is also palmitoylated after inflammasome stimulation or treatment with ROS activators and causes pyroptosis, although less efficiently than palmitoylated GSDMD-NT. Palmitoylated, but not unpalmitoylated, full-length GSDMD induces liposome leakage and forms a pore similar in structure to GSDMD-NT pores shown by cryogenic electron microscopy. ZDHHC5 and ZDHHC9 are the major palmitoyltransferases that mediate GSDMD palmitoylation, and their expression is upregulated by inflammasome activation and ROS. The other human gasdermins are also palmitoylated at their N termini. These data challenge the concept that cleavage is the only trigger for GSDMD activation. They suggest that reversible palmitoylation is a checkpoint for pore formation by both GSDMD-NT and intact GSDMD that functions as a general switch for the activation of this pore-forming family.


Conflict of interest statement

Competing interests H.W. and J.L. are cofounders of Ventus Therapeutics. J.C.K. consults and holds equity in Corner Therapeutics, Larkspur Biosciences, MindImmune Therapeutics and Neumora Therapeutics. None of these relationships impacted this study. The other authors declare no competing interests.

Figures

Extended Data Fig. 1 |
Extended Data Fig. 1 |. GSDMD is palmitoylated at its N-terminus at Cys191.
a, Protein sequence of human GSDMD N-terminal domain (GSDMD-NT). Certain residues are marked by colours. b, Domain organization and ribbon diagrams of autoinhibited full-length (FL) GSDMD (modelled after PDB 6N9O, left), membrane-inserted GSDMD-NT monomer (middle), and the GSDMD-NT pore oligomer modelled after PDB 6VFE (right). c, GSDMD-FL palmitoylation detected by alkyne stearic acid and rhodamine azide, and its inhibition by the general palmitoylation inhibitor 2-BP. d, Click chemistry for protein N-myristoylation did not detect N-myristoylation of GSDMD using the alkyne-myristate 13-TDYA. e, GSDMD-FL palmitoylation when expressed in HEK293T cells detected by ABE, with the known palmitoylated protein Calnexin as a positive control. f, GSDMD-NT palmitoylation when expressed in HEK293T cells, detected by ABE, and its inhibition by 2-BP. GAPDH acts as the loading control. g-l, PI staining (g), PI positivity (h), LDH release (i), cell viability (j), anti-FLAG immunofluorescence imaging for membrane localization (k), and its quantification (l) of HEK293T cells expressing GSDMD-NT WT or Cys mutants, showing the impairment of C191A in inducing pyroptosis. Scale bars represent 50 μm (g) and 5 μm (l). Data are presented as the mean ± SEM, n = 3 (h-j, l). (c-f) Representative of ≥3 independent experiments. Statistics were measured by two-tailed Student’s t-tests with NS (non-significant) for p > 0.05, *** for p < 0.001, and **** for p < 0.0001. Immunoblots were incubated with 1:1000 anti-FLAG® M2-peroxidase (HRP) antibody, 1:1000 anti-calnexin antibody, and 1:5000 anti-GAPDH antibody for GAPDH loading controls.
Extended Data Fig. 2 |
Extended Data Fig. 2 |. GSDMD palmitoylation at Cys191 and its functional effects, and cell death of WT and mutant iBMDMs.
a, UPLC-MS/MS analysis of released ethyl palmitoyl group from Expi293-expressed WT GSDMD (top half, red) and synthetic C16 ethyl palmitate control (bottom half, grey). b, Inputs and cleavage of bacterial expressed and mammalian expressed GSDMD proteins used in liposome leakage assays. All proteins were cleaved equally. c, APE of bacterially expressed recombinant GSDMD, WT and its C191A mutant, detected by the anti-GSDMD antibody CST-39754. Although each PEG-mal used was 10 kDa in size, the molecular weight shift it caused was about twice, as noted previously. d, Liposome pelleting assay. GSDMD insertion mutant (F184D/L186D) was designed from the GSDMD pore structure, which should bind to the membrane but does not fully insert into the membrane to form pores. Even at the high concentration used (35 μM) to enable detection by Coomassie staining, the role of palmitoylation in membrane association was apparent. e,f, ABE of undifferentiated THP-1 monocytes (e) or PMA-differentiated THP-1 macrophages (f) treated by LPS, nigericin, or LPS plus nigericin. For differentiated THP-1 cells, nigericin alone and LPS plus nigericin both induced GSDMD cleavage and palmitoylation. g, Palmitoylation by ABE of WT iBMDMs upon treatment by LPS, nigericin, or LPS plus nigericin. h, Western blot of GSDMD in WT THP-1 and in GSDMD KO THP-1 stably reconstituted with GSDMD-GFP by lentiviruses. Expression levels of GSDMD-GFP in reconstituted THP-1 cells were equal to endogenous GSDMD in WT THP-1 cells. i, Western blot of GSDMD in WT iBMDMs and GSDMD KO iBMDM clones stably reconstituted with GSDMD-GFP (WT, C191A, or D275A). Clones of GSDMD-GFP reconstituted iBMDMs with equal expression levels to endogenous GSDMD in WT iBMDMs were selected. The selected clones are labelled in red. j, LDH release of GSDMD KO iBMDMs reconstituted with WT, C191A, or D275A GSDMD-GFP upon treatment by LPS and nigericin. All results were obtained from at least 3 independent experiments. Error bars represent SEM. Statistics were measured by two-tailed Student’s t-tests with NS (non-significant) for p > 0.05, ** for p < 0.01, *** for p < 0.001, and **** for p < 0.0001. Immunoblots were incubated with 1:1000 anti-GSDMD antibody.
Extended Data Fig. 3 |
Extended Data Fig. 3 |. Regulation of GSDMD palmitoylation and pyroptosis by ROS modulators.
a, GSDMD-NT palmitoylation detected by ABE and quantified in HEK293T cells expressing GSDMD-NT treated or not ROS activators or quenchers. b, GSDMD-NT and calnexin palmitoylation detected by APE in HEK293T cells expressing GSDMD-NT or empty vector. Although the PEG-mal used was 10 kDa in size, the molecular weight shift it caused is roughly twice, as noted previously. c, d, LDH release (c), and cell viability (d) of HEK293T cells expressing GSDMD-NT and treated or not with ROS modulators. e, Anti-FLAG immunofluorescence imaging of HEK293T cells expressing GSDMD-NT and treated with ROS modulators, showing increased cell membrane localization by Rot and AMA and its inhibition by 2-BP, as well as the diffuse cytoplasmic localization upon treatment by NAC. Nuclei are marked by the DNA dye DAPI. Scale bars represent 5 μm. f, Plot of PI positivity against % GSDMD palmitoylation, showing an approximately linear relationship. g, Measurement of cellular oxidative stress by CellROX in THP-1 cells treated or not with LPS plus nigericin, and with ROS and palmitoylation modulators. h-l, PI staining (h), LDH release (i), cell viability (j), IL-1β secretion (k), and membrane staining (l) of THP-1 cells treated or not with LPS + nigericin and with ROS modulators. Scale bar represent 50 μm (h). All results were obtained from at least 3 independent experiments. Error bars represent SEM. Statistics were measured by two-tailed Student’s t-tests with * for p < 0.05, ** for p < 0.01, *** for p < 0.001, and **** for p < 0.0001. Scale bars represent 5 μm (e) and 50 μm (h). Immunoblots were incubated with 1:1000 anti-FLAG® M2-peroxidase (HRP) antibody, 1:1000 anti-calnexin antibody, and 1:5000 anti-GAPDH antibody for GAPDH loading controls.
Extended Data Fig. 4 |
Extended Data Fig. 4 |. GSDMD targets the mitochondria to induce ROS.
a, Pulldown of proteins with oxidized Cys residues in LPS primed and nigericin activated THP-1 cells followed by anti-GSDMD western blot (top). GSDMD is minorly oxidized in primed and activated cells even with additional ROS activators (≤5%). The pulldown and the input lanes were run on the same gel (bottom). b,c, Imaging (b) and quantification (c) of cellular oxidative stress by CellROX and MitoSOX in GSDMD KO THP-1 cells electroporated with GSDMD-NT WT or C191A. WT GSDMD-NT expression leads to higher cellular oxidative stress than C191A mutant. Data are presented as the mean ± SEM, n = 3. Scale bars represent 80 μm (b). d,e, Measurement of cellular and mitochondrial stress by CellROX (d), and MitoSOX (e) intensity in GSDMD KO THP-1 cells reconstituted with WT, C191A, or D275A (cleavage deficient) GSDMD upon treatment by DMSO, LPS or LPS and nigericin. C191A GSDMD-reconstituted cells did not enhance ROS production upon stimulation by LPS and nigericin as compared to WT GSDMD, while D275A GSDMD-reconstituted cells showed significantly enhanced ROS production. Expression levels of GSDMD-GFP in reconstituted THP-1 cells were equal to endogenous GSDMD in WT THP-1 cells. Data are presented as the mean ± SEM, n = 3. f,g, Measurement of cellular oxidative stress by CellROX (f), and MitoSOX (g) of GSDMD KO THP-1 cells treated with LPS, LPS and nigericin, or with additional ROS activators or quenchers, highlighting the GSDMD dependence of ROS generation during inflammasome activation. Data are presented as the mean ± SEM, n = 3. h,i, Palmitoylated GSDMD detected by ABE in isolated mitochondria from THP-1 cells (h) and iBMDMs (i) before and after inflammasome activation. j, Western blots of GSDMD in isolated mitochondria from WT iBMDMs, Crls1 KO iBMDMs, or Plscr3 KO iBMDMs, showing lack of GSDMD in mitochondria from the KO cells. k,l, ROS measured by MitoSox (k) or CellRox (l) showing close to baseline ROS in the KO iBMDMs even upon inflammasome activation, in contrast to WT cells. (h-j) Representative of ≥3 independent experiments. Data are presented as the mean ± SEM, n = 3. Statistics were measured by two-tailed Student’s t-tests with NS (non-significant) for p > 0.05, * for p < 0.05, ** for p < 0.01, *** for p < 0.001, and **** for p < 0.0001. All immunoblots were incubated with 1:1000 anti-GSDMD antibody, and 1:1000 anti-COX IV antibody for COX IV loading controls.
Extended Data Fig. 5 |
Extended Data Fig. 5 |. Cryo-EM structure of palmitoylated, full-length GSDMD.
a,b, Negative staining EM images of GSDMD pores by D275A GSDMD-FL (a), or empty liposomes (b) on liposomes (left) and after detergent solubilization (right). Red arrowheads indicate a few examples of pores. c, Cryo-EM workflow of GSDMD-FL pore structure. d, FSC curve of the cryo-EM reconstruction. e, Overall view of the cryo-EM density segmented to show GSDMD-NT in cyan. f, The globular rim of the GSDMD-NT structure is higher, shown by the ribbon diagram extending above the cryo-EM density of the GSDMD-NT region of the GSDMD-FL pore. g, The globular rim domain assembly in the pre-pore structure of GSDMD-NT (top) and its fitting into the density of full-length GSDMD pore. h, FSC curve for the cryo-EM structure of palmitoylated GSDMD. The resolution is likely over-estimated as we cannot visualize individual helices in the map. i, j, Cryo-EM map of palmitoylated GSDMD (grey) fitted separately with NT (cyan) and CT (green) from unpalmitoylated GSDMD structure (PDB: 6N9O) (i), and the comparison of the palmitoylated model with the unpalmitoylated GSDMD structure (j). The NT-CT interaction is less compact in the palmitoylated GSDMD structure, suggesting partial overcome of autoinhibition.
Extended Data Fig. 6 |
Extended Data Fig. 6 |. GSDMD KO THP-1 cells with uncleavable D275A GSDMD-FL induced ROS, pyroptosis, and membrane localization, and a GSDMD disease mutant enhanced cell death in a palmitoylation-dependent manner.
a,b, ROS activators alone induced significant LDH release (a) and reduced cell viability (b) in GSDMD KO THP-1 stably reconstituted with GSDMD-GFP D275A or WT GSDMD. Expression levels of GSDMD-GFP in reconstituted THP-1 cells were equal to endogenous GSDMD in WT THP-1 cells. c,d, Palmitoylation in THP-1 cells treated or not with ROS activators or quencher (c), or primed and activated and treated or not with ROS activators or quencher (d). e-j, ROS measured by MitoSox (e), palmitoylation (f), LDH release (g), cell viability (h), IL-1β release (i), and cellular ROS (j) in GSDMD KO THP-1 cells or GSDMD KO THP-1 cells reconstituted with D275A, treated or not with ROS activators or quenchers. Expression levels of GSDMD-GFP in reconstituted THP-1 cells were equal to endogenous GSDMD in WT THP-1 cells. All results were obtained from at least 3 independent experiments. Error bars represent SEM. Statistics used two-tailed Student’s t-tests, with NS (non-significant) for p > 0.05, ** for p < 0.01, *** for p < 0.001, and **** for p < 0.0001. Immunoblots were incubated 1:5000 anti-GAPDH antibody for GAPDH, and 1:1000 anti-GSDMD antibody.
Extended Data Fig. 7 |
Extended Data Fig. 7 |. GSDMD KO iBMDMs reconstituted with uncleavable D275A GSDMD-FL induce ROS, pyroptosis, and membrane localization upon inflammasome activation and/or ROS activators.
a, Palmitoylation in iBMDMs treated or not with ROS activators or quencher. b,c, ROS activators alone induced significant PI positivity as measured by Incucyte® (b) and increased LDH release (c) in GSDMD KO iBMDMs stably reconstituted or not with GSDMD-GFP D275A or WT GSDMD. d-f, Palmitoylation (d), PI positivity (e), and MitoSOX (f) in GSDMD KO iBMDMs reconstituted with GSDMD-GFP D275A, clone 5, activated by LPS and nigericin, and treated or not with additional ROS activators, quenchers, or 2-BP. g,h, GFP imaging (g) and quantification (h) for GSDMD membrane localization in clone 5 of GSDMD KO iBMDMs reconstituted with GSDMD-GFP D275A upon inflammasome activation and with or not ROS modulators and 2-BP. Scale bars represent 5 μm (g). All results were obtained from at least 3 independent experiments. GSDMD KO iBMDM clones reconstituted with D275A that had equal expression levels to endogenous GSDMD in WT iBMDMs were selected. Error bars represent SEM. Statistics used two-tailed Student’s t-tests, with NS (non-significant) for p > 0.05, * for p < 0.05, ** for p < 0.01, *** for p < 0.001, and **** for p < 0.0001. Immunoblots were incubated with 1:1000 anti-GSDMD antibody and 1:5000 anti-GAPDH antibody for GAPDH loading controls.
Extended Data Fig. 8 |
Extended Data Fig. 8 |. Primary BMDMs induce increased palmitoylation and pyroptosis upon inflammasome activation and/or ROS activators.
a-d, Palmitoylation (a,c) and PI positivity (b,d) in primary WT and Gsdmd KO BMDMs (a,b), or primary caspase-1/11 dKO and Gsdmd KO BMDMs (c,d) treated or not with 2-BP, ROS activators or quenchers. e, GSDMD palmitoylation by ROS activators or 2-BP in primary WT and caspase-1/11 dKO BMDMs. f, ROS activators alone increased LDH release in both WT and caspase-1/11 dKO primary BMDMs, but not in Gsdmd KO BMDMs. g-i, Time course as measured by Incucyte® of PI (g,i), or Annexin V positivity (h) with ROS induction without LPS and nigericin treatment in primary WT, Gsdmd KO, and caspase-1/11 dKO BMDMs. All results were obtained from at least 3 independent experiments. Error bars represent SEM. Statistics used two-tailed Student’s t-tests, or two-way ANOVA (g-i) with NS (non-significant) for p > 0.05, * for p < 0.05, ** for p < 0.01, *** for p < 0.001, and **** for p < 0.0001. Immunoblots were incubated with 1:1000 anti-GSDMD antibody and 1:5000 anti-GAPDH antibody for GAPDH loading controls.
Extended Data Fig. 9 |
Extended Data Fig. 9 |. GSDMD palmitoylation and cell death in primary BMDMs.
a, GSDMD palmitoylation detected by ABE in primary caspase-1/11 dKO BMDMs upon dsDNA electroporation, flatox treatment or LPS electroporation, and treated or not with ROS activator Rot, 2-BP, or ROS quencher NAC. b-g, PI positivity (b,d,f) and LDH release (c,e,g) in primary caspase-1/11 dKO BMDMs and primary GSDMD KO BMDMs upon AIM2 inflammasome activation by dsDNA electroporation (b,c), NAIP5/NLRC4 inflammasome activation by flatox treatment (d,e), and non-canonical inflammasome activation by LPS electroporation (f,g). All results were obtained from at least 3 independent experiments. Error bars represent SEM. Statistics were measured by two-tailed Student’s t-tests with * for p < 0.05, ** for p < 0.01, *** for p < 0.001, and **** for p < 0.0001.
Extended Data Fig. 10 |
Extended Data Fig. 10 |. Identification of ZDHHC5 and ZDHHC9 as the main palmitoyltransferases for GSDMD palmitoylation and their regulation.
a, Palmitoylation as measured by ABE of GSDMD-NT expressed in HEK293T cells cotransfected with pooled siRNAs for ZDHHC5 and ZDHHC9, or all human ZDHHCs except ZDHHC5/9. b, Co-localization imaging analysis of ZDHHC5-YFP and ZDHHC9-YFP with GSDMD-mCherry upon co-expression in HEK293T cells. Hoechst (blue) stained nuclei. The cap-like structures appear to be intact Golgi. Scale bars represent 5 μm. c, Anti-FLAG pulldown controls. ZDHHS5 and ZDHHS9 were not pulled down without co-expression with the GSDMD-FLAG bait, and GSDMD-FLAG did not pull down ZDHHS5 and ZDHHS9 without the expression of ZDHHS5 and ZDHHS9. d,e, Cell viability (d), and PI positivity (e) of GSDMD-NT expressing HEK293T cells upon siRNA knockdowns of ZDHHCs. Other pooled siRNA contained siRNAs for all human ZDHHCs except ZDHHC5/9. f, Anti-FLAG immunofluorescence imaging of HEK293T cells with siRNA knockdowns of ZDHHC5, ZDHHC9, or both expressing GSDMD-NT-FLAG. Only cells treated with scRNA showed strong cell surface staining. Nuclei are marked by the DNA dye DAPI. Scale bars represent 5 μm. g, Quantification of GSDMD palmitoylation in Fig. 5f detected by ABE in THP-1 cells upon siRNA knockdown of ZDHHC5, ZDHHC9, or both and treatment with LPS plus nigericin, showing that these knockdowns compromised GSDMD palmitoylation. h-j, LDH release (h), cell viability (i), and IL-1β release (j) of THP-1 cells upon siRNA knockdown of ZDHHC5, ZDHHC9, both, or other ZDHHCs and treatment with LPS plus nigericin. k-m, Palmitoylation as measured by ABE of GSDMD (k), PI positivity (l) and LDH release (m) of WT THP-1 cells in the presence of pooled siRNAs for ZDHHC5 and ZDHHC9, or all human ZDHHCs except ZDHHC5/9. n, Western blots of THP-1 cells with single and double knockouts of ZDHHC5 or ZDHHC9, or both. o,p, Palmitoylation (o), and LDH release (p) of ZDHHC knockout THP-1 cell clones primed and activated with LPS and nigericin. All results were obtained from at least 3 independent experiments. Error bars represent SEM. Statistics were measured by two-tailed Student’s t-tests with NS (non-significant) for p > 0.05, *** for p < 0.001, and **** for p < 0.0001. Immunoblots were incubated 1:1000 anti-FLAG® M2-peroxidase (HRP) antibody (a, c), 1:5000 anti-GAPDH antibody for GAPDH (a, k, o), 1:1000 anti-ZDHHC5 antibody (c), 1:1000 anti-ZDHHC9 antibody (c), 1:500 anti-ZDHHC5 antibody (n), 1:500 anti-ZDHHC9 antibody (n), 1:1000 anti-β-actin antibody (n), and 1:1000 anti-GSDMD antibody (k, o).
Fig. 1 |
Fig. 1 |. GSDMD is palmitoylated as detected using three methods, with 2-BP and C191A inhibiting palmitoylation.
a, Schematic of metabolic labelling and click chemistry for detecting protein modification by palmitic acid (PA). GSDMD-NT and GSDMD-CT are shown as ovals in cyan and green. The yellow star denotes biotin or rhodamine. b, Full-length GSDMD palmitoylation when expressed in HEK293T cells, detected by alkyne-PA labelling, biotin–azide click, and biotin pull-down, and its inhibition by palmitoylation inhibitor 2-BP. c, Schematic of ABE or APE for detecting protein acylation. NEM, N-ethylmaleimide. d, Palmitoylation of full-length GSDMD and GSDMD-NT, but not GSDMD-CT. e, Palmitoylation of WT GSDMD-NT and Cys mutants of GSDMD-NT; only C191A mutant was defective in palmitoylation. f, Non-reducing SDS–PAGE and western blot analysis of WT or C191A GSDMD-NT when expressed in HEK293T cells. WT GSDMD-NT lysates were untreated, treated with HA to break acylation, treated with TCEP to break disulfide bonds or reduce oxidation, pretreated with 2-BP, or co-expressed with siRNAs to knockdown ZDHHC5 and ZDHHC9, which mediate GSDMD palmitoylation. Cells were treated with the ROS activator ROT to increase palmitoylation. g, Schematic of quantitative palmitoylation (palm.) detection using ultra-high performance liquid chromatography coupled to tandem MS (UPLC–MS/MS). h, UPLC peaks during the UPLC–MS/MS analysis of released EP from purified WT and C191A GSDMD expressed in Expi293 cells under treatment with ROT. WT GSDMD palmitoylation was detected at 91%, whereas GSDMD (C191A) palmitoylation was not detected. cps, counts per second. i, The rate of liposome leakage for Expi293-cell-expressed palmitoylated GSDMD-NT compared with HA-treated depalmitoylated GSDMD-NT or GSDMD (C191A). Data are mean ± s.e.m. n = 3. Statistical analysis was performed using two-way analysis of variance (ANOVA); not significant (NS), P > 0.05; ****P < 0.0001. Representative of at least three independent experiments (b and df). Immunoblots were incubated with anti-Flag M2-peroxidase (HRP; 1:1,000) for GSDMs and anti-GAPDH (1:5,000; loading control) antibodies.
Fig. 2 |
Fig. 2 |. GSDMD palmitoylation during inflammasome activation, and the functional effects of palmitoylation-defective C191A and cleavage-deficient D275A mutants.
a, Palmitoylation of full-length GSDMD and GSDMD-NT in THP-1 cells after priming and activation. 2-BP inhibited GSDMD palmitoylation without affecting processing. be, Palmitoylation (b), PI positivity (c), LDH release (d) and IL-1β release (e) in GSDMD-KO THP-1 cells reconstituted with WT, C191A or cleavage-deficient D275A GSDMD–GFP. GSDMD(C191A) was defective in cell death after treatment by LPS and nigericin, whereas GSDMD(D275A) was partially functional despite the lack of cleavage. f,g, Representative images (f) and quantification (g) of GSDMD membrane localization in GSDMD-KO THP-1 cells that were reconstituted with WT or C191A GSDMD–GFP after priming and activation. Membrane localization was seen for WT GSDMD-reconstituted cells with substantially reduced membrane localization in GSDMD(C191A)-reconstituted cells. h, Palmitoylated GSDMD was detected by ABE in Gsdmd-KO iBMDMs that were reconstituted with WT or C191A GSDMD–GFP. i, PI positivity of Gsdmd-KO iBMDMs reconstituted with WT, C191A or D275A GSDMD–GFP after priming and activation. j,k, Representative images (j) and quantification (k) of GSDMD membrane localization in Gsdmd-KO iBMDMs that were reconstituted with WT or C191A GSDMD–GFP. For f and j, PI staining marks cell death; and the arrow heads indicate pyroptotic bubbles. Scale bars, 5 μm (f and j). All results were obtained from at least three independent experiments. Expression levels of GSDMD–GFP in reconstituted THP-1 cells were equal to endogenous GSDMD in WT THP-1 cells (bg). Clones of GSDMD–GFP-reconstituted iBMDMs with equal expression levels to endogenous GSDMD in WT iBMDMs were selected (hk). Data are mean ± s.e.m. For ce, g, i and k, statistical analysis was performed using two-tailed Student’s t-tests; *P < 0.05, **P < 0.01, ***P < 0.001. Immunoblots were incubated with anti-GSDMD (1:1,000) and anti-GAPDH (loading control; 1:5,000) antibodies.
Fig. 3 |
Fig. 3 |. Regulation of GSDMD palmitoylation and pyroptosis by ROS modulators.
a,b, Quantification of GSDMD-NT palmitoylation using ABE (a) or APE (b) in HEK293T cells treated with the ROS activators ROT or AMA, or the ROS quenchers Tiron, NAC or MitoT. Although the PEG-mal used was 10 kDa in size, the molecular mass shift that it caused is approximately twice this size, as noted previously. c,d, PI positivity (c) and membrane staining (d) of HEK293T cells expressing GSDMD-NT–Flag treated with ROS modulators, showing enhanced pyroptosis after treatment with ROT and AMA, and decreased pyroptosis after treatment with NAC, Tiron and NAC. e,f, Full-length GSDMD and GSDMD-NT palmitoylation (e) and quantification (f) was detected by ABE in THP-1 cells after activation by LPS and nigericin and treatment with ROS activators or quenchers. g,h, MitoSOX red intensity (g) and PI positivity (h) in THP-1 cells after activation by LPS and nigericin and treatment with ROS inducers or quenchers. i, Representative fluorescence microscopy images of GSDMD-KO THP-1 cells that were reconstituted with WT GSDMD–GFP after activation by LPS and nigericin and treated with ROS inducers or quenchers or 2-BP, showing enhanced GSDMD membrane localization by inflammasome activation and ROS activators, and inhibition by ROS quenchers and 2-BP. Expression levels of GSDMD–GFP in reconstituted THP-1 cells were equal to endogenous GSDMD in WT THP-1 cells. Scale bars, 5 μm. The arrowheads indicate pyroptotic bubbles. j, GSDMD palmitoylation detected by ABE in THP-1 cells or iBMDMs after activation of various inflammasomes, and after treatment with ROS activator ROT, ROS quencher NAC or 2-BP. All results were obtained from at least three independent experiments. Data are mean ±s.e.m. Statistical analysis was performed using two-tailed Student’s t-tests. Immunoblots were incubated with anti-Flag M2-peroxidase (HRP; 1:1,000; a and b), anti-GSDMD (1:1,000; e and j) and anti-GAPDH (1:5,000; loading controls) antibodies.
Fig. 4 |
Fig. 4 |. Palmitoylated intact GSDMD can form active full-length pores and induce pyroptosis.
a, Liposome leakage assay of Expi293-cell-expressed intact GSDMD WT, GSDMD(D275A), GSDMD(C191A) and GSDMD(D275A/C191A). Bacterially expressed intact GSDMD and Expi293-cell-expressed cleaved GSDMD were used as positive and negative controls. b, Overall view of the cryo-EM density segmented to show GSDMD-NT (cyan), the probable region for GSDMD-CT (green) and the probable region for palmitate (magenta). c, The GSDMD-NT part of the full-length GSDMD pore density; the location of Cys191 is coloured in yellow. d, ROS activators alone induced significant cell death in WT THP-1 and GSDMD-KO THP-1 cells that were reconstituted with the GSDMD(D275A)–GFP uncleavable mutant. eg, Palmitoylation (e), PI positivity (f) and MitoSOX intensity (g) in GSDMD-KO THP-1 cells that were reconstituted with GSDMD(D275A)–GFP, activated by LPS and nigericin, and treated with ROS activators, quenchers or 2-BP. h,i, GSDMD-KO THP-1 cells that were reconstituted with GSDMD(D275A)–GFP imaged with GFP and PI (h) and quantified (i). Scale bars, 5 μm (h). The arrowheads indicate pyroptotic bubbles. j, The structure of unpalmitoylated GSDMD (Protein Data Bank (PDB): 6N9O) with NT (cyan), CT (green) and Val41 at the NT–CT interface (red) highlighted. The autism-associated V41A mutation probably overcomes autoinhibition. k,l, Palmitoylation (k) and PI positivity (l) of HEK293T cells expressing the full-length GSDMD(V41A) autism-associated mutant and treated with ROS modulators showing enhanced pyroptosis by ROT and AMA, and decreased pyroptosis by NAC. The V41A autism-associated mutant has increased cell death compared with WT full-length GSDMD. All results were obtained from at least three independent experiments. Data are mean ± s.e.m. Statistical analysis was performed using two-tailed Student’s t-tests (d, f, g, i and l) and two-way ANOVA (a). Immunoblots were incubated anti-GSDMD (e; 1:1,000), anti-Flag M2-peroxidase (HRP; 1:1,000) for GSDMD (k) and anti-GAPDH (loading controls; 1:5,000) antibodies.
Fig. 5 |
Fig. 5 |. Identification of ZDHHC5 and ZDHHC9 as the main palmitoyltransferases for GSDMD palmitoylation.
a,b, Palmitoylation (a) and quantification (b) in HEK293T cells transfected with GSDMD-NT after siRNA knockdown of ZDHHCs. c, Anti-Flag pull-down of ZDHHS5 and ZDHHS9, co-expressed with GSDMD–Flag. IP, immunoprecipitation; WB, western blot. d,e, PI positivity (d) and LDH release (e) of GSDMD-NT-expressing HEK293T cells after siRNA knockdown of ZDHHCs. f, GSDMD palmitoylation in THP-1 cells after siRNA knockdown of ZDHHCs and treatment with LPS plus nigericin. g,h, PI positivity (g) and membrane localization (h) of THP-1 cells after siRNA knockdown of ZDHHCs and after priming and activation. i,j, Palmitoylation (i) and LDH release (j) of THP-1 clones with CRISPR–Cas9 knockout of ZDHHC5, ZDHHC9 or both. k, GSDMD palmitoylation in GSDMD-KO THP-1 cells reconstituted with GSDMD(D275A) pretreated with palmostatin B (PalmB), ML348/ML349 together, a ROS modulator, or LPS and nigericin. l, The expression levels of ZDHHC3/5/9 and APT1/2 in THP-1 cells treated with LPS, LPS plus nigericin, or LPS plus nigericin with ROS modulators. Quantified band intensities are shown for ZDHHC5 and ZDHHC9. m, The expression level of ZDHHC5 in THP-1 cells treated with LPS, LPS plus nigericin, LPS plus nigericin treated with ROT, or additionally treated with the proteasome inhibitor BTZ or protein translation inhibitor CHX. n, The proposed model for how palmitoylation enhances GSDMD-NT and full-length GSDMD pore formation. All results were obtained from at least three independent experiments. The schematic in n was created using BioRender. Data are mean ± s.e.m. Statistical analysis was performed using two-tailed Student’s t-tests. Immunoblots were incubated with anti-Flag M2-peroxidase (HRP; 1:1,000; a and c), anti-ZDHHC5 (1:1,000) and anti-ZDHHC9 (1:1,000; c); anti-ZDHHC5 (1:500) and anti-ZDHHC9 (1:500; l and m); anti-GSDMD (1:1,000; f, i and k); anti-APT1 (1:1,000) and anti-APT2 (1:1,000; l); anti-ZDHHC3 (1:1,000; l); and anti-GAPDH (1:5,000; loading controls) antibodies.

Update of

Similar articles

Cited by

References

    1. Kayagaki N et al. Caspase-11 cleaves gasdermin D for non-canonical inflammasome signalling. Nature 526, 666–671 (2015). - PubMed
    1. Shi J et al. Cleavage of GSDMD by inflammatory caspases determines pyroptotic cell death. Nature 526, 660–665 (2015). - PubMed
    1. Liu X et al. Inflammasome-activated gasdermin D causes pyroptosis by forming membrane pores. Nature 535, 153–158 (2016). - PMC - PubMed
    1. Ding J et al. Pore-forming activity and structural autoinhibition of the gasdermin family. Nature 535, 111–116 (2016). - PubMed
    1. Gaidt MM & Hornung V The NLRP3 inflammasome renders cell death pro-inflammatory. J. Mol. Biol. 430, 133–141 (2018). - PubMed

MeSH terms

LinkOut - more resources