. 2024 Jun;1870(5):167161.
doi: 10.1016/j.bbadis.2024.167161. Epub 2024 Apr 9.

The transcription factor BMI1 increases hypoxic signaling in oral cavity epithelia

Affiliations

The transcription factor BMI1 increases hypoxic signaling in oral cavity epithelia

Jorge Baquero et al. Biochim Biophys Acta Mol Basis Dis. 2024 Jun.

Abstract

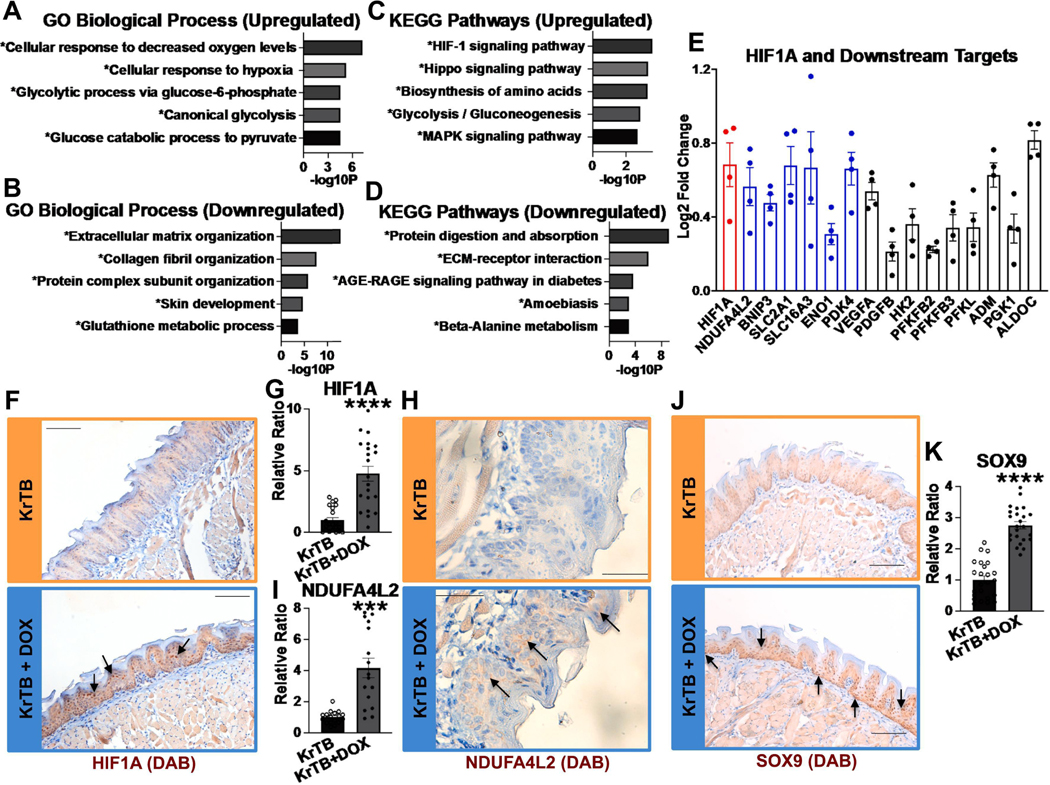
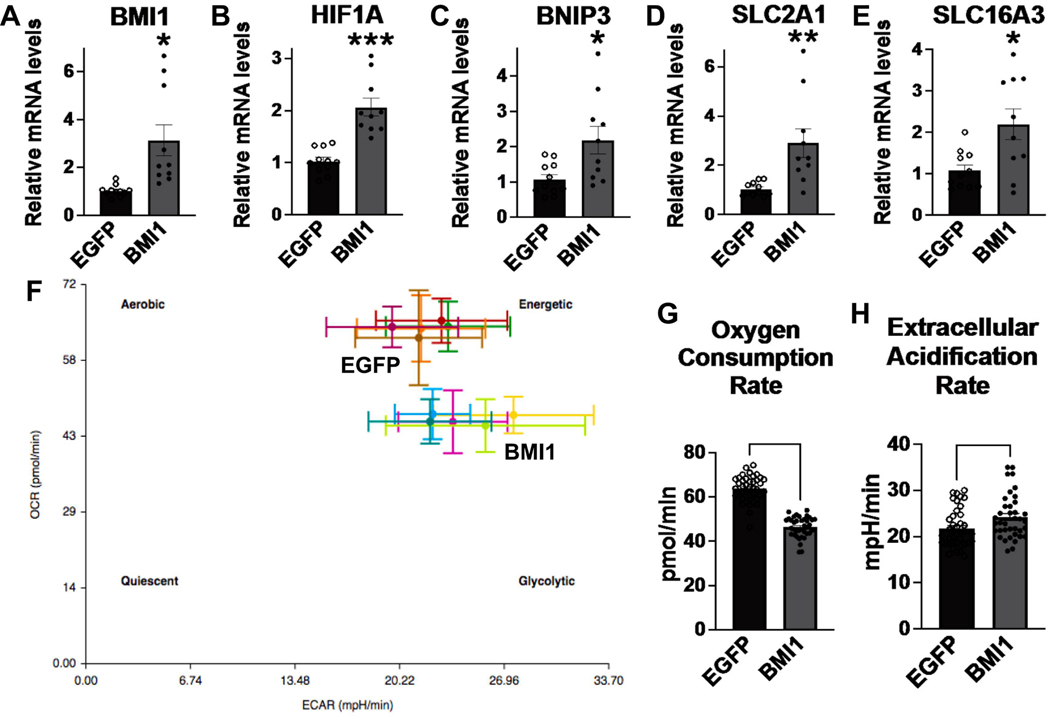
The tongue epithelium is maintained by a proliferative basal layer. This layer contains long-lived stem cells (SCs), which produce progeny cells that move up to the surface as they differentiate. B-lymphoma Mo-MLV insertion region 1 (BMI1), a protein in mammalian Polycomb Repressive Complex 1 (PRC1) and a biomarker of oral squamous cell carcinoma, is expressed in almost all basal epithelial SCs of the tongue, and single, Bmi1-labelled SCs give rise to cells in all epithelial layers. We previously developed a transgenic mouse model (KrTB) containing a doxycycline- (dox) controlled, Tet-responsive element system to selectively overexpress Bmi1 in the tongue basal epithelial SCs. Here, we used this model to assess BMI1 actions in tongue epithelia. Genome-wide transcriptomics revealed increased levels of transcripts involved in the cellular response to hypoxia in Bmi1-overexpressing (KrTB+DOX) oral epithelia even though these mice were not subjected to hypoxia conditions. Ectopic Bmi1 expression in tongue epithelia increased the levels of hypoxia inducible factor-1 alpha (HIF1α) and HIF1α targets linked to metabolic reprogramming during hypoxia. We used chromatin immunoprecipitation (ChIP) to demonstrate that Bmi1 associates with the promoters of HIF1A and HIF1A-activator RELA (p65) in tongue epithelia. We also detected increased SC proliferation and oxidative stress in Bmi1-overexpressing tongue epithelia. Finally, using a human oral keratinocyte line (OKF6-TERT1R), we showed that ectopic BMI1 overexpression decreases the oxygen consumption rate while increasing the extracellular acidification rate, indicative of elevated glycolysis. Thus, our data demonstrate that high BMI1 expression drives hypoxic signaling, including metabolic reprogramming, in normal oral cavity epithelia.

Keywords: Epigenetics; HIF1α; Metabolic reprogramming; Oral epithelial stem cells; Transcriptional regulation.


Conflict of interest statement

Declaration of competing interest The authors declare no competing interests.

Figures

Fig. 1.
Fig. 1.. RNA sequencing reveals transcripts that are differentially expressed in KrTB+DOX compared to KrTB tongue epithelia.
(A) Schematic of normal tongue epithelium and the doxycycline-inducible expression system used to overexpress Bmi1 in murine basal stem cells. (B) BMI1 Immunohistochemistry (IHC) staining in KrTB and KrTB+DOX tongue epithelia (200X; scale bar: 100 μm; N = 3 mice/group, 8 fields/mouse; representative fields are shown). (C) Relative ratios of BMI1 protein in KrTB and KrTB+DOX tongue epithelia (KrTB 1.0 ± 0.25 vs. KrTB+DOX 9.1 ± 2.6, P < 0.0001). Data graphed denotes the mean ± standard error of the mean (SEM). Statistical significance was determined using Welch’s t-test. *0.01<p<0.05, **0.001<p<0.01, ***0.0001<p<0.001, ****p<0.0001. (D) Heatmap displaying genes that were differentially expressed between KrTB (N= 4) and KrTB+DOX (N= 4) tongue epithelia (adjusted p-value < 0.1). Genes are represented by rows, samples are represented by columns, and each cell displays normalized gene expression values. Red cells indicate significantly upregulated genes, blue cells indicate downregulated genes. (E) Volcano plot displaying the log2-fold changes and statistical significance of each gene calculated by performing differential gene expression analysis (adjusted p-value < 0.1). Every point in the plot represents a gene. Red points indicate significantly upregulated genes, blue points indicate downregulated genes. (D) and (E) were generated using BioJupies (Ma’ayan Lab, Icahn School of Medicine at Mount Sinai).
Fig. 2.
Fig. 2.. Pathways involved in the cellular response to hypoxia are increased in KrTB+DOX tongue epithelia.
(A-B) Gene Ontology (GO) enrichment analysis showing the biological processes that are overrepresented by the upregulated (A) or the downregulated (B) transcripts in KrTB+DOX compared to KrTB tongue epithelia. (C-D) Pathway enrichment analysis (using KEGG database) showing the biological pathways that are overrepresented by the upregulated (C) or the downregulated (D) transcripts in KrTB+DOX compared to KrTB tongue epithelia. (A-D) were generated using the BioJupies interface, and x axes indicate the -log10(P-value) for each term. (E) Fold change of gene expression levels of HIF1A (in red) and HIF1A downstream targets (targets validated via immunofluorescence in Figure 3 and Sup. Figure 5 are represented in blue; targets not further validated are represented in black) in KrTB+DOX vs. KrTB tongue epithelia. Data graphed denotes the mean ± standard error of the mean (SEM). (F) HIF1A IHC staining in tongue samples from KrTB and KrTB+DOX tongue epithelia. (G) Relative ratios of HIF1α protein in KrTB and KrTB+DOX tongue epithelia (KrTB 1.0 ± 0.99 vs. KrTB+DOX 4.8 ± 2.7, P < 0.0001). (H) NDUFA4L2 IHC staining in KrTB and KrTB+DOX tongue epithelia. (I) Relative ratios of NDUFA4L2 protein in KrTB and KrTB+DOX tongue epithelia (KrTB 1.0 ± 0.40 vs. KrTB+DOX 4.2 ± 2.5, P = 0.0001). (J) SOX9 IHC staining in KrTB and KrTB+DOX tongue epithelia. (K) Relative ratios of SOX9 protein in KrTB and KrTB+DOX tongue epithelia (KrTB 1.0 ± 0.60 vs. KrTB+DOX 2.8 ± 0.57, P < 0.0001). For (F), (H) and (J), cells with high expression of the corresponding protein are indicated by arrows (200X for F and J, 400X for H; scale bar: 100 μm; N = 3 mice/group, 5–8 fields/mouse; representative fields are shown). For (G), (I) and (K), data graphed denotes the mean ± standard error of the mean (SEM). Statistical significance was determined using Welch’s t-test. *0.01<p<0.05, **0.001<p<0.01, ***0.0001<p<0.001, ****p<0.0001.
Fig. 3.
Fig. 3.. Ectopic Bmi1 expression in tongue epithelia increases HIF1α and downstream targets associated with glycolysis.
(A) BMI1 and HIF1α IF staining in KrTB and KrTB+DOX tongue epithelia. (B) BMI1 and NDUFA4L2 IF staining in KrTB and KrTB+DOX tongue epithelia. (C) BNIP3 and BMI1 IF staining in KrTB and KrTB+DOX tongue epithelia. (D) GLUT1 and BMI1 IF staining in KrTB and KrTB+DOX tongue epithelia. Bmi1-overexpressing cells with high expression of the corresponding protein are indicated by arrows (200X; scale bar: 100 μm). We report ratios of integrated density of proteins of interest (measured by Fiji) over integrated density of Hoechst signal in the same area (N = 3 or 4 mice/group, 5–8 fields/mouse, representative fields are shown). All data graphed denotes the mean ± standard error of the mean (SEM). Statistical significance was determined using Welch’s t-test. *0.01<p<0.05, **0.001<p<0.01, ***0.0001<p<0.001, ****p<0.0001.
Fig. 4.
Fig. 4.. Bmi1 associates with the promoter regions of HIF1A and RELA genes in murine tongue epithelia.
Tongue epithelia from KrTB (N = 4) and KrTB+DOX (N = 3) mice were isolated and homogenized, and soluble chromatin samples (10 μg) were immunoprecipitated (IP’ed) with 1 μg of antibodies specific for Bmi1 or IgG (negative control). Purified DNA was used for qPCR analysis using primers specific for (A) HIF1A promoter, (B) RELA promoter, (C) a SOX2 enhancer, (D) a region in the PAX6 gene bound by Bmi1 (positive control), (E) a region in the FLNC gene bound by Bmi1 (positive control), and (F) a deserted region in chromosome 17 (negative control). Binding is expressed relative to the pre-IP input DNA. All data graphed denotes the mean ± standard error of the mean (SEM). Statistical significance was determined using Welch’s t-test, *0.01<p<0.05. For (A-C), we include schematic representations of the gene structures of HIF1A, RELA, and SOX2 that show the regions used for ChIP-qPCR analysis.
Fig. 5.
Fig. 5.. Bmi1 overexpression in tongue epithelia increases SC proliferation and oxidative stress.
(A) Ki67 IHC staining in KrTB and KrTB+DOX tongue epithelia. (B) Loricrin and BMI1 IF staining in KrTB and KrTB+DOX tongue epithelia. Representative areas containing loricrin expression at edges of layers are circled. (C) 4-HNE IHC staining in KrTB and KrTB+DOX tongue epithelia. Representative areas in the KrTB+DOX sample containing increased levels of 4-HNE are circled. (D) Nitrotyrosine and BMI1 IF staining in KrTB and KrTB+DOX tongue epithelia. Bmi1-overexpressing cells with increased nitrotyrosine levels are indicated by arrows. For (B) and (D), we report ratios of integrated density of proteins of interest (measured by Fiji) over integrated density of Hoechst signal in the same area. All images are 200X; scale bar: 100 μm (N = 3 or 4 mice/group, 5–8 fields/mouse, representative fields are shown). All data graphed denotes the mean ± standard error of the mean (SEM). Statistical significance was determined using Welch’s t-test. *0.01<p<0.05, **0.001<p<0.01, ***0.0001<p<0.001, ****p<0.0001.
Fig. 6.
Fig. 6.. Bmi1 overexpression in the human oral cell line OKF6-TERT1R increases HIF1A expression and glycolysis levels.
Reverse transcribed RNA isolated from transfected OKF6-TERT1R cells (N = 10 or 11/group) was subjected to qRT-PCR analysis to measure mRNA expression levels of (A) BMI1, (B) HIF1A, (C) BNIP3, (D) SLC2A1, and (E) SLC16A3, compared to HPRT (control) mRNA levels. (F) Energy map (Oxygen Consumption Rate, OCR, in pmol/min vs. Extracellular Acidification Rate, ECAR, in mpH/min) for OKF6-EGFP and OKF-BMI1 cells. This map was generated using the Agilent Seahorse Analytics Software at baseline and before the addition of oligomycin, and depicts the mean and standard deviation of OCR and ECAR values for each replicate (N = 5/cell line, 8 wells/replicate). (G) Graph of OCR (in pmol/min) in OKF6-EGFP vs. OKF6-BMI1 cells. (H) Graph of ECAR (in mpH/min) in OKF6-EGFP vs. OKF6-BMI1 cells. For A-E and G-H, data graphed denotes the mean ± standard error of the mean (SEM). Statistical significance was determined using Welch’s t-test. *0.01<p<0.05, **0.001<p<0.01, ***0.0001<p<0.001, ****p<0.0001.

References

    1. Allegra E, Trapasso S, Pisani D, and Puzzo L. (2014). The role of BMI1 as a biomarker of cancer stem cells in head and neck cancer: a review. Oncology 86, 199–205. - PubMed
    1. Bandookwala M, and Sengupta P. (2020). 3-Nitrotyrosine: a versatile oxidative stress biomarker for major neurodegenerative diseases. The International journal of neuroscience 130, 1047–1062. - PubMed
    1. Banerjee Mustafi S, Aznar N, Dwivedi SK, Chakraborty PK, Basak R, Mukherjee P, Ghosh P, and Bhattacharya R. (2016). Mitochondrial BMI1 maintains bioenergetic homeostasis in cells. FASEB journal : official publication of the Federation of American Societies for Experimental Biology 30, 4042–4055. - PMC - PubMed
    1. Baquero J, Tang XH, Scognamiglio T, and Gudas LJ (2021). EZH2 knockout in oral cavity basal epithelia causes more invasive squamous cell carcinomas. Carcinogenesis 42, 1485–1495. - PMC - PubMed
    1. Birajdar SS, Radhika M, Paremala K, Sudhakara M, Soumya M, and Gadivan M. (2014). Expression of Ki-67 in normal oral epithelium, leukoplakic oral epithelium and oral squamous cell carcinoma. Journal of oral and maxillofacial pathology : JOMFP 18, 169–176. - PMC - PubMed

Publication types

MeSH terms