. 2024 Apr;7(4):e1978.
doi: 10.1002/cnr2.1978.

Identifying the predictive role and the related drugs of oxidative stress genes in the hepatocellular carcinoma

Affiliations

Identifying the predictive role and the related drugs of oxidative stress genes in the hepatocellular carcinoma

Guole Nie et al. Cancer Rep (Hoboken). 2024 Apr.

Abstract

Background and aims: Oncogenesis and tumor development have been related to oxidative stress (OS). The potential diagnostic utility of OS genes in hepatocellular carcinoma (HCC), however, remains uncertain. As a result, this work aimed to create a novel OS related-genes signature that could be used to predict the survival of HCC patients and to screen OS related-genes drugs that might be used for HCC treatment.

Methods: We used The Cancer Genome Atlas (TCGA) database and the Gene Expression Omnibus (GEO) database to acquire mRNA expression profiles and clinical data for this research and the GeneCards database to obtain OS related-genes. Following that, biological functions from Gene Ontology (GO) and the Kyoto Encyclopedia of Genes and Genomes (KEGG) were performed on differentially expressed OS-related genes (DEOSGs). Subsequently, the prognostic risk signature was constructed based on DEOSGs from the TCGA data that were screened by using univariate cox analysis, and the Least Absolute Shrinkage and Selection Operator (LASSO) regression, and multivariate cox analysis. At the same time, we developed a prognostic nomogram of HCC patients based on risk signature and clinical-pathological characteristics. The GEO data was used for validation. We used the receiver operating characteristic (ROC) curve, calibration curves, and Kaplan-Meier (KM) survival curves to examine the prediction value of the risk signature and nomogram. Finally, we screened the differentially expressed OS genes related drugs.

Results: We were able to recognize 9 OS genes linked to HCC prognosis. In addition, the KM curve revealed a statistically significant difference in overall survival (OS) between the high-risk and low-risk groups. The area under the curve (AUC) shows the independent prognostic value of the risk signature model. Meanwhile, the ROC curves and calibration curves show the strong prognostic power of the nomogram. The top three drugs with negative ratings were ZM-336372, lestaurtinib, and flunisolide, all of which inversely regulate different OS gene expressions.

Conclusion: Our findings indicate that OS related-genes have a favorable prognostic value for HCC, which sheds new light on the relationship between oxidative stress and HCC, and suggests potential therapeutic strategies for HCC patients.

Keywords: GEO; TCGA; hepatocellular carcinoma; overall survival; oxidative stress‐related genes; prognostic.


Conflict of interest statement

The authors state that no commercial or financial connections that might be considered as a possible conflict of interest existed during the research.

Figures

FIGURE 1
FIGURE 1
Flowchart of the research.
FIGURE 2
FIGURE 2
Identification of DEOSGs. (A) The common OS‐related genes in GEO, TCGA, and GeneCards. (B) Volcano plot of DEOSGs between normal and tumor tissues from TCGA. (C) Heatmap of DEOSGs.
FIGURE 3
FIGURE 3
GO analysis of upregulated and downregulated DEOSGs. (A, B) Top 10 classes of GO enrichment terms of upregulated DEOSGs in biological process (BP), cellular component (CC), and molecular function (MF). (C, D) Top 10 classes of GO enrichment terms of downregulated DEOSGs in biological process (BP), cellular component (CC), and molecular function (MF). (E) Grid diagram of top 5 GO terms and upregulated DEOSGs. (F) Grid diagram of top 5 GO terms and downregulated DEOSGs.
FIGURE 4
FIGURE 4
KEGG analysis of upregulated and downregulated DEOSGs. (A, B) The top 20 KEGG enrichment terms of upregulated DEOSGs. (B, C) The top 20 KEGG enrichment terms of downregulated DEOSGs.
FIGURE 5
FIGURE 5
Construction of risk signature in the TCGA and GEO datasets. (A) Univariate Cox regression analysis for identification of prognosis‐associated DEOSGs. (B, C) The number of constructed prognostic risk signature genes was determined by LASSO analysis. (D, E) The ROCs and AUCs of risk score and clinical‐pathological factors, including age, gender, and stage, in TCGA and GEO datasets. (F, H) KM survival curves of TCGA and GEO datasets. (G, I) TimeROC curves for 1, 2, and 3‐year overall survival in TCGA and GEO datasets.
FIGURE 6
FIGURE 6
Association of risk score with survival time and prognosis‐related OS gene expression. (A, D) The risk curves of risk score distribution in the TCGA and GEO datasets. (B, E) Scatterplot of survival status of HCC patients in the TCGA and GEO datasets. (C, F) The heatmap displayed the expression levels of prognostic‐related DEOSGs in the high‐risk and low‐risk groups in the TCGA and GEO datasets.
FIGURE 7
FIGURE 7
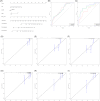
Construction and validation of prognostic nomogram. (A) The prognostic nomogram for HCC patients. (B, C) The time‐dependent ROC of nomogram at 1, 2, and 3 years in the TCGA and GEO datasets. (D–F) The 1,2,3‐years calibration curves of nomogram in the TCGA dataset. (G–I) The 1,2,3‐years calibration curves of nomogram in the GEO dataset.
FIGURE 8
FIGURE 8
Expression level of prognosis‐related DEOSGs. (A) The box plot of prognostic‐related DEOSGs in the TCGA dataset. (B) The heatmap of prognostic‐related DEOSGs in the TCGA dataset.
FIGURE 9
FIGURE 9
Structures of the screened small‐molecule drugs. (A, B) 2D and 3D structures of ZM‐336372. (C, D) 2D and 3D structures of lestaurtinib. (E, F) 2D and 3D structures of flunisolide.

References

    1. Yang JD, Hainaut P, Gores GJ, Amadou A, Plymoth A, Roberts LR. A global view of hepatocellular carcinoma: trends, risk, prevention and management. Nat Rev Gastroenterol Hepatol. 2019;16:589‐604. doi:10.1038/s41575-019-0186-y - DOI - PMC - PubMed
    1. Sung H, Ferlay J, Siegel RL, et al. Global cancer statistics 2020: GLOBOCAN estimates of incidence and mortality worldwide for 36 cancers in 185 countries. CA Cancer J Clin. 2021;71:209‐249. doi:10.3322/caac.21660 - DOI - PubMed
    1. Llovet JM, Kelley RK, Villanueva A, et al. Hepatocellular carcinoma. Nat Rev Dis Primers. 2021;7:6. doi:10.1038/s41572-020-00240-3 - DOI - PubMed
    1. Kangari P, Zarnoosheh Farahany T, et al. Enzymatic antioxidant and lipid peroxidation evaluation in the newly diagnosed breast cancer patients in Iran. Asian Pac J Cancer Prev. 2018;19:3511‐3515. doi:10.31557/APJCP.2018.19.12.3511 - DOI - PMC - PubMed
    1. Shen J, Chen M, Lee D, et al. Histone chaperone FACT complex mediates oxidative stress response to promote liver cancer progression. Gut. 2020;69:329‐342. doi:10.1136/gutjnl-2019-318668 - DOI - PubMed

Associated data