Powdery mildew-induced changes in phyllosphere microbial community dynamics of cucumber
- PMID: 38599637
- PMCID: PMC11062426
- DOI: 10.1093/femsec/fiae050
Powdery mildew-induced changes in phyllosphere microbial community dynamics of cucumber
Abstract
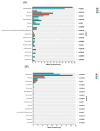
As an important habitat for microorganisms, the phyllosphere has a great impact on plant growth and health, and changes in phyllosphere microorganisms are closely related to the occurrence of leaf diseases. However, there remains a limited understanding regarding alterations to the microbial community in the phyllosphere resulting from pathogen infections. Here, we analyzed and compared the differences in phyllosphere microorganisms of powdery mildew cucumber from three disease severity levels (0% < L1 < 30%, 30% ≤ L2 < 50%, L3 ≥ 50%, the number represents the lesion coverage rate of powdery mildew on leaves). There were significant differences in α diversity and community structure of phyllosphere communities under different disease levels. Disease severity altered the community structure of phyllosphere microorganisms, Rosenbergiella, Rickettsia, and Cladosporium accounted for the largest proportion in the L1 disease grade, while Bacillus, Pantoea, Kocuria, and Podosphaera had the highest relative abundance in the L3 disease grade. The co-occurrence network analysis of the phyllosphere microbial community indicated that the phyllosphere bacterial community was most affected by the severity of disease. Our results suggested that with the development of cucumber powdery mildew, the symbiotic relationship between species was broken, and the entire bacterial community tended to compete.
Keywords: co-occurrence network; cucumber powdery mildew; degree of disease; diversity; phyllosphere microbiota; relative abundance.
© The Author(s) 2024. Published by Oxford University Press on behalf of FEMS.
Conflict of interest statement
None declared.
Figures


References
-
- Abarenkov K, Nilsson RH, Larsson K et al. The UNITE database for molecular identification of fungi–recent updates and future perspectives. New Phytol. 2010;186:281–5. - PubMed
-
- Bakker P, Pieterse CMJ, de Jonge R et al. The soil-borne legacy. Cell. 2018;172:1178–80. - PubMed
-
- Beilsmith K, Thoen MPM, Brachi B et al. Genome-wide association studies on the phyllosphere microbiome: embracing complexity in host-microbe interactions. Plant J. 2019;97:164–81. - PubMed
Publication types
MeSH terms
Substances
Grants and funding
LinkOut - more resources
Full Text Sources
Research Materials

