. 2024 May 15;34(4):590-605.
doi: 10.1101/gr.278576.123.

Transcriptional programs mediating neuronal toxicity and altered glial-neuronal signaling in a Drosophila knock-in tauopathy model

Affiliations

Transcriptional programs mediating neuronal toxicity and altered glial-neuronal signaling in a Drosophila knock-in tauopathy model

Hassan Bukhari et al. Genome Res. .

Abstract

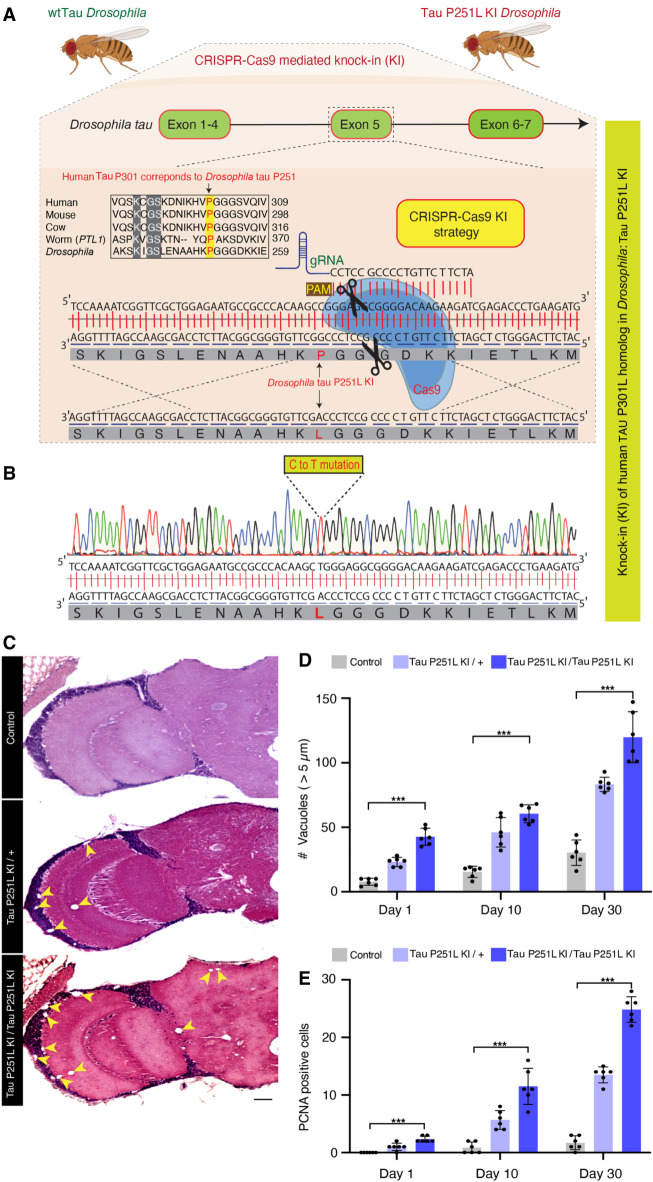
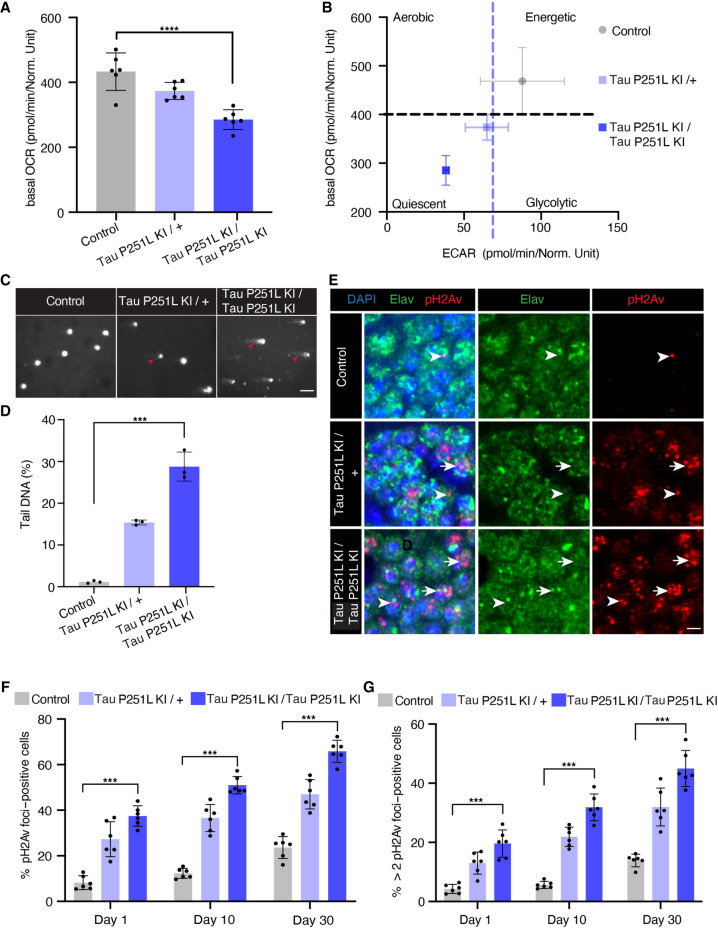
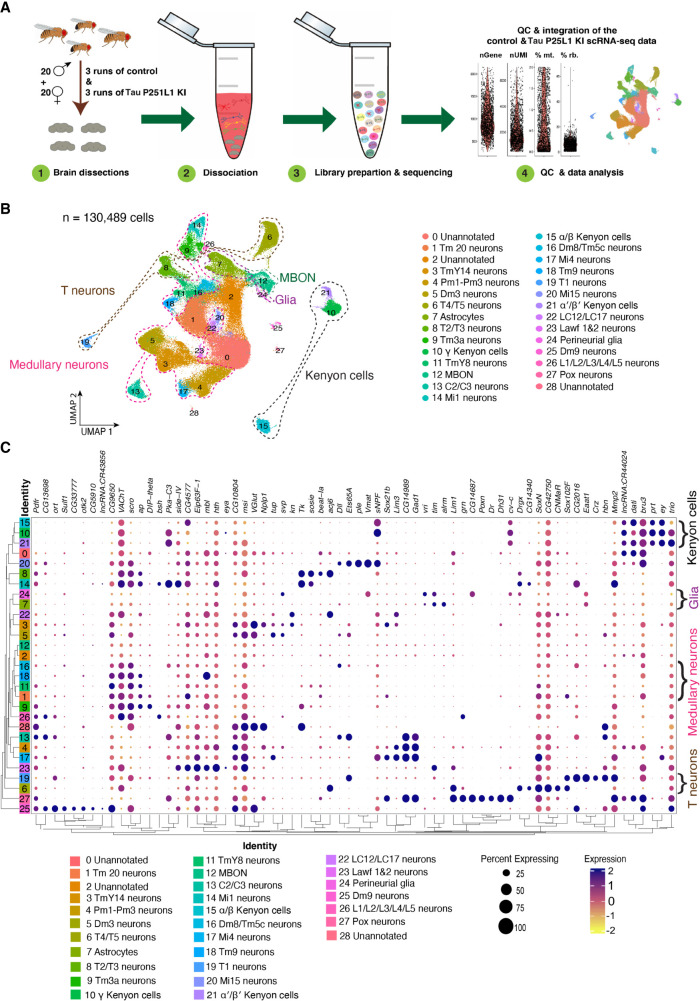
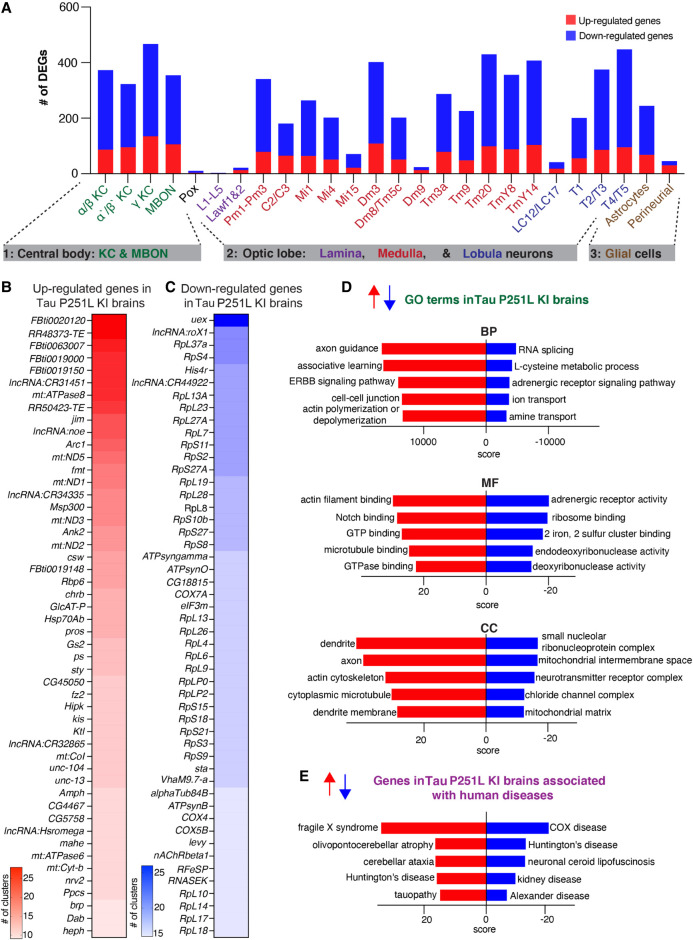
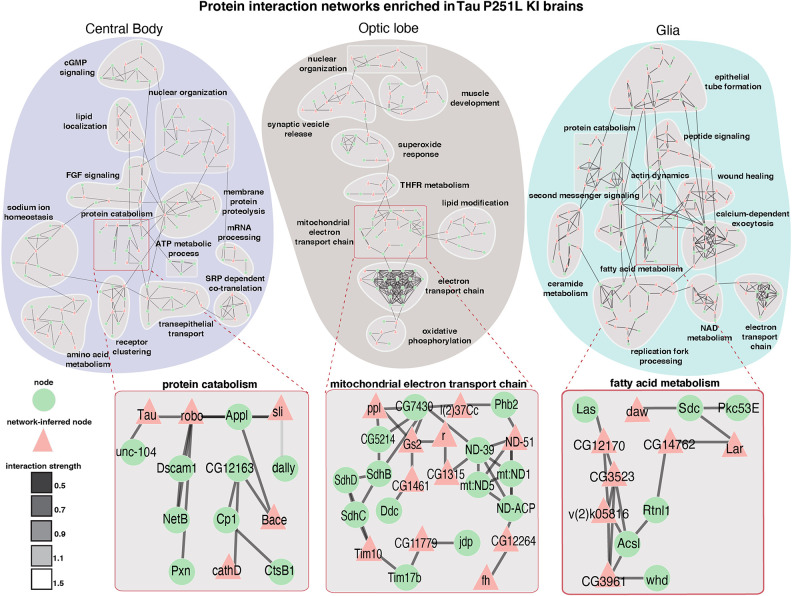
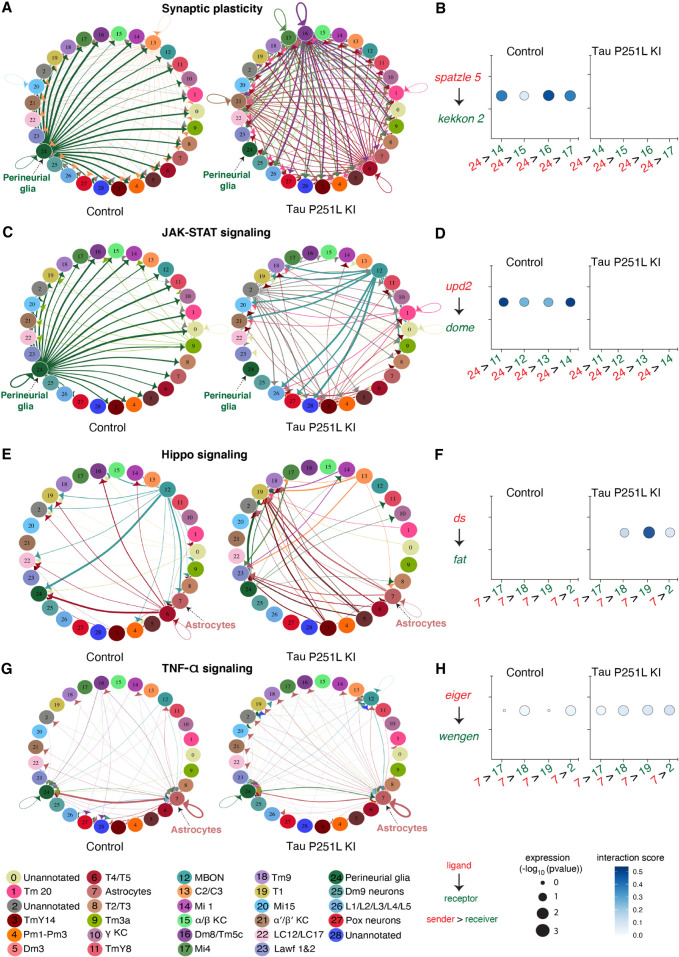
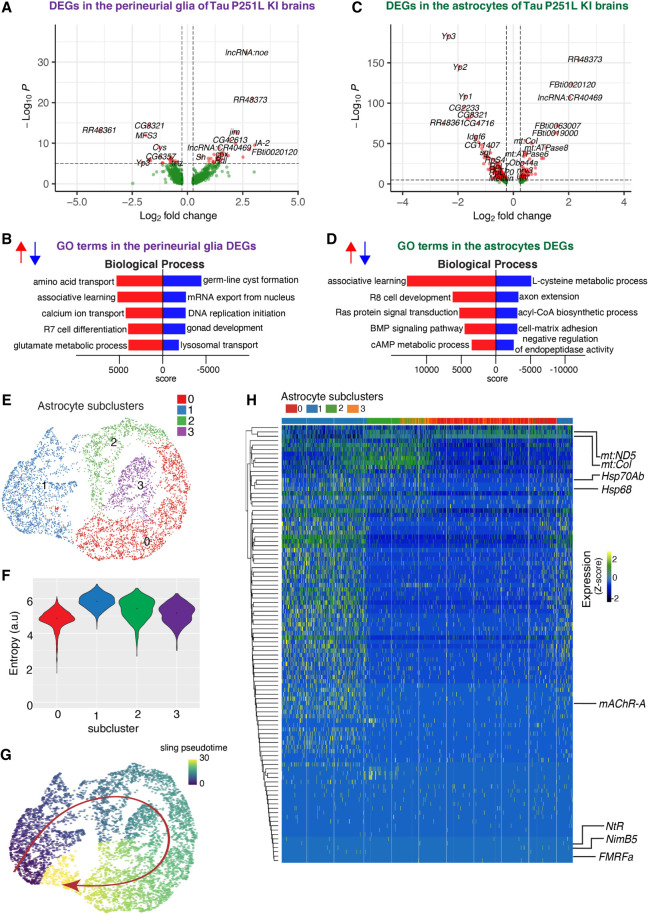
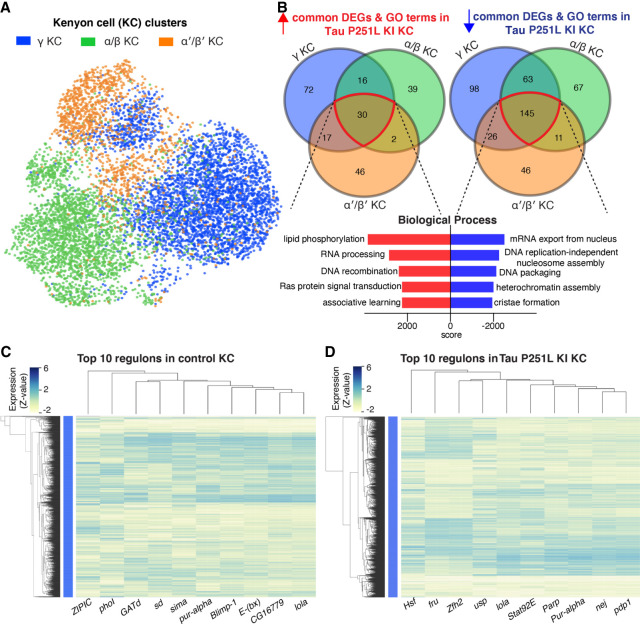
Missense mutations in the gene encoding the microtubule-associated protein TAU (current and approved symbol is MAPT) cause autosomal dominant forms of frontotemporal dementia. Multiple models of frontotemporal dementia based on transgenic expression of human TAU in experimental model organisms, including Drosophila, have been described. These models replicate key features of the human disease but do not faithfully recreate the genetic context of the human disorder. Here we use CRISPR-Cas-mediated gene editing to model frontotemporal dementia caused by the TAU P301L mutation by creating the orthologous mutation, P251L, in the endogenous Drosophila tau gene. Flies heterozygous or homozygous for Tau P251L display age-dependent neurodegeneration, display metabolic defects, and accumulate DNA damage in affected neurons. To understand the molecular events promoting neuronal dysfunction and death in knock-in flies, we performed single-cell RNA sequencing on approximately 130,000 cells from brains of Tau P251L mutant and control flies. We found that expression of disease-associated mutant tau altered gene expression cell autonomously in all neuronal cell types identified. Gene expression was also altered in glial cells, suggestive of non-cell-autonomous regulation. Cell signaling pathways, including glial-neuronal signaling, were broadly dysregulated as were brain region and cell type-specific protein interaction networks and gene regulatory programs. In summary, we present here a genetic model of tauopathy that faithfully recapitulates the genetic context and phenotypic features of the human disease, and use the results of comprehensive single-cell sequencing analysis to outline pathways of neurotoxicity and highlight the potential role of non-cell-autonomous changes in glia.


Figures

Figure 1.
Figure 1.
CRISPR-Cas9-mediated knock-in model of frontotemporal dementia in Drosophila. (A) CRISPR-Cas9 gene editing strategy to knock-in the human TAU P301L homologous mutation in Drosophila, Tau P251L, located in exon 5 of Drosophila tau. (B) Successful mutation in homozygous Tau P251L knock-in flies. (C,D) Hematoxylin and eosin staining reveals evidence of neurodegeneration as seen by an increased number of brain vacuoles (arrowheads) with age in homozygous and heterozygous knock-in animals. (C) Scale bar represents 10 µm. (E) Neurodegeneration is accompanied by abnormal cell-cycle reentry as marked by proliferating cell nuclear antigen (PCNA) staining. Flies are 30 d old in C and the age indicated in the figure labels in D,E. (D,E) n = 6 per genotype and time point. Data are presented as mean ± SD. (***) P < 0.001, one-way ANOVA with Tukey post-hoc analysis.
Figure 2.
Figure 2.
Mitochondrial dysfunction and DNA damage in Tau P251L knock-in brains. (A,B) Decreased oxygen consumption rate (OCR; A) and shift to a quiescent metabolic phenotype as indicated by plotting the OCR versus the extracellular acidification rate (ECAR; B) in homozygous and heterozygous Tau P251L knock-in brains compared with controls. n = 6 per genotype. (C,D) Elevated levels of DNA damage in Tau P251L knock-in brains as indicated by increased tail length (arrowheads) following electrophoresis of nuclei from dissociated brains in the comet assay. n = 3 per genotype. (E) Increase in the number of Kenyon cells neurons (identified by the neuronal marker elav) containing DNA double-strand breaks as marked by pH2Av foci (arrowheads; arrows indicate neuronal nuclei with more than two foci) in histological sections of mushroom bodies (Kenyon cells) from Tau P251L knock-in animals, as quantified in F,G. n = 6 per genotype and time point. Scale bars represent 5 µm. Flies are 10 d old in AD, 30 d old in E, and the age indicated in the figure labels in F,G. Data are presented as mean ± SD. (***) P < 0.001, one-way ANOVA with Tukey post-hoc analysis.
Figure 3.
Figure 3.
Single-cell RNA sequencing (scRNA-seq) of Tau P251L knock-in brains. (A) Schematic of the scRNA-seq analysis pipeline. Following dissection, brains were dissociated in the enzymatic solutions, and the single-cell suspension was encapsulated by the 10x Genomics Chromium platform. The 10x libraries were prepared and sequenced, and after quality control, data were analyzed. (B) UMAP representation of the six integrated scRNA-seq runs: three control and three Tau P251L knock-in. The integrated data set contains 130,489 cells, and 26 clusters out of 29 were annotated. (C) Percentage expression heatmap of the highly expressed marker genes within all clusters. Flies are 10 d old.
Figure 4.
Figure 4.
Differential gene expression and enrichment analysis of the scRNA-seq data set in Tau P251L knock-in brains compared with controls. (A) The number of differentially expressed genes (DEGs), both up-regulated and down-regulated genes, in all the annotated clusters of Tau P251L knock-in brains compared with controls. Results are displayed across three major anatomic and functional classes of cells: (1) central body containing three clusters of Kenyon cells (KCs), mushroom body output neurons (MBONs) and pox neurons; (2) optic lobe neurons containing lamina, medullary, and lobula neurons clusters; and (3) glia cells containing astrocytes and perineurial clusters. (B,C) Heatmaps of the top 50 up-regulated (B) and down-regulated (C) genes in all the clusters of Tau P251L knock-in brains compared with controls (Supplemental Table S3). (D) Gene Ontology (GO) enrichment analysis identified top up-regulated and down-regulated biological processes (BPs), molecular functions (MFs), and cellular components (CCs). (E) Analysis of human disease–associated genes revealed top up-regulated and down-regulated disease-associated gene sets. Score represents the combined score c = log(p) × z (Chen et al. 2013).
Figure 5.
Figure 5.
Protein interaction networks enriched in the central body, optic lobe, and glia in Tau P251L knock-in brains compared with controls. Protein interaction networks are largely distinct among central body neurons, optic lobe neurons, and glia. Subnetworks including nodes enriched for protein catabolism (central body), electron transport chain (optic lobe), or fatty acid metabolism (glia) are highlighted. Interaction strength displayed in gray shows the stringency of the interaction: The lower the strength, the stronger the interaction.
Figure 6.
Figure 6.
Cell–cell communication analysis predicts altered signaling in Tau P251L knock-in brains compared with controls. (A) Altered ligand and receptor expression predicts regulation of synaptic plasticity signaling mainly via perineurial glial cells in control brains. (B) Signaling from perineurial glia is significantly reduced in Tau P251L knock-in brains, as predicted by levels of spaetzle ligand and kekkon receptor. (C,D) JAK-STAT signaling, as predicted by expression of the upd2 ligand and dome receptor, mediated by perineurial glia in control brains (C), is substantially reduced in brains from Tau P251L knock-in animals (D). (E,F) Hippo signaling, indicated by expression of ds ligand and fat receptor, is up-regulated in astrocytes of flies expressing P251L mutant Tau compared with controls. (G,H) Predicted TNF-α signaling from ligand eiger to receptor wengen is increased in astrocytes of Tau P251L knock-in flies. In panels B,D,F,H, the interactions from and to the specified cell types are indicated on the x-axis, the size of the circle indicates the P-value, and the intensity of the blue color illustrates the interaction score as defined in the figure label below the panels.
Figure 7.
Figure 7.
Gene expression and trajectory analysis in glia. (A) Differentially regulated genes, both up-regulated and down-regulated, in perineurial glia of Tau P251L knock-in brains compared with controls. (B) GO analysis shows biological processes associated with the up-regulated and down-regulated genes in perineurial glia from Tau P251L knock-in brains compared with controls. (C) Differentially regulated genes, both up-regulated and down-regulated, in astrocytes of Tau P251L knock-in brains compared with controls. (D) GO analysis shows biological process associated with up-regulated and down-regulated genes in astrocytes of Tau P251L knock-in brains. All dots on the volcano plots are significant at FDR < 0.05 and log2FC > 0.25 for up-regulated and log2FC< −0.25 for down-regulated genes. Score represents the combined score c = log(p) × z (Chen et al. 2013). Astrocytes from both control and Tau P251L knock-in brains were further subclustered into four groups. (E,F) Entropy analysis to define the root for trajectory analysis revealed cluster 1 to have the highest entropy. (G) Slingshot trajectory analysis on astrocyte clusters identified a single lineage passing sequentially from clusters 1 to 2, 3, and 0. (H) Differential gene expression between astrocyte subclusters adjacent in pseudotime were used to cluster genes along the pseudotime trajectory. Each row in the heat map represents a gene. The columns are astrocyte subclusters arranged according to pseudotime from left to right. Examples of differentially regulated genes from enriched GO biological processes are shown on the calculated trajectory.
Figure 8.
Figure 8.
Gene expression and regulatory networks in Kenyon cells (KCs). (A,B) Three KC clusters—gamma-KC, alpha/beta-KC, and alpha′/beta′-KC—and biological process based on the common up-regulated and down-regulated genes in KC clusters in Tau P251L knock-in brains. Score represents the combined score c = log(p) × z (Chen et al. 2013). Control and Tau P251L knock-in Kenyon cells were clustered separately using SCENIC gene regulatory network analysis to identify regulons. (C,D) The top 10 regulons identified by SCENIC gene regulatory network analysis in control (C) and Tau P251L knock-in (D) KCs are presented in the heatmaps. Each row represents a KC; each column is a regulon.

Update of

References

    1. Aibar S, González-Blas CB, Moerman T, Huynh-Thu VA, Imrichova H, Hulselmans G, Rambow F, Marine J-C, Geurts P, Aerts J, et al. 2017. SCENIC: single-cell regulatory network inference and clustering. Nat Methods 14: 1083–1086. 10.1038/nmeth.4463 - DOI - PMC - PubMed
    1. Andorfer C, Acker CM, Kress Y, Hof PR, Duff K, Davies P. 2005. Cell-cycle reentry and cell death in transgenic mice expressing nonmutant human τ isoforms. J Neurosci 25: 5446–5454. 10.1523/JNEUROSCI.4637-04.2005 - DOI - PMC - PubMed
    1. Bardai FH, Ordonez DG, Bailey RM, Hamm M, Lewis J, Feany MB. 2018a. Lrrk promotes τ neurotoxicity through dysregulation of actin and mitochondrial dynamics. PLoS Biol 16: e2006265. 10.1371/journal.pbio.2006265 - DOI - PMC - PubMed
    1. Bardai FH, Wang L, Mutreja Y, Yenjerla M, Gamblin TC, Feany MB. 2018b. A conserved cytoskeletal signaling cascade mediates neurotoxicity of FTDP-17 τ mutations in vivo. J Neurosci 38: 108–119. 10.1523/JNEUROSCI.1550-17.2017 - DOI - PMC - PubMed
    1. Barnstedt O, Owald D, Felsenberg J, Brain R, Moszynski J-P, Talbot CB, Perrat PN, Waddell S. 2016. Memory-relevant mushroom body output synapses are cholinergic. Neuron 89: 1237–1247. 10.1016/j.neuron.2016.02.015 - DOI - PMC - PubMed

Publication types

MeSH terms