. 2024 Apr 10;15(1):3118.
doi: 10.1038/s41467-024-47434-x.

Parenchymal cues define Vegfa-driven venous angiogenesis by activating a sprouting competent venous endothelial subtype

Affiliations

Parenchymal cues define Vegfa-driven venous angiogenesis by activating a sprouting competent venous endothelial subtype

Laetitia Préau et al. Nat Commun. .

Abstract

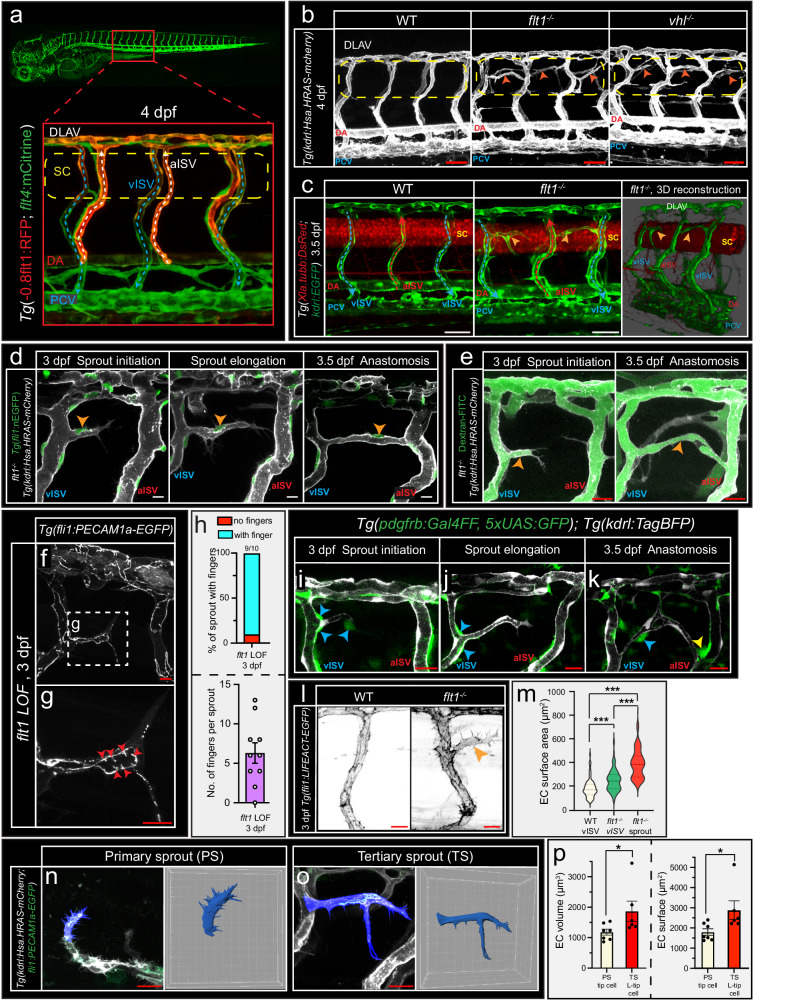
Formation of organo-typical vascular networks requires cross-talk between differentiating parenchymal cells and developing blood vessels. Here we identify a Vegfa driven venous sprouting process involving parenchymal to vein cross-talk regulating venous endothelial Vegfa signaling strength and subsequent formation of a specialized angiogenic cell, prefabricated with an intact lumen and pericyte coverage, termed L-Tip cell. L-Tip cell selection in the venous domain requires genetic interaction between vascular Aplnra and Kdrl in a subset of venous endothelial cells and exposure to parenchymal derived Vegfa and Apelin. Parenchymal Esm1 controls the spatial positioning of venous sprouting by fine-tuning local Vegfa availability. These findings may provide a conceptual framework for understanding how Vegfa generates organo-typical vascular networks based on the selection of competent endothelial cells, induced via spatio-temporal control of endothelial Kdrl signaling strength involving multiple parenchymal derived cues generated in a tissue dependent metabolic context.


Conflict of interest statement

The authors declare no competing interests.

Figures

Fig. 1
Fig. 1. Tertiary sprouts emanate from veins, and consist of a single lumenized endothelial cell that remodels into an anastomotic connection.
a Confocal images of Tg(−0.8flt1:RFP;flt4:mCitrine) showing overview and high magnification of trunk vasculature. Dotted arrows indicate flow direction; Dotted box shows ROI. b Trunk vasculature in WT, flt1−/− and vhl−/− mutants. Arrowheads indicate ectopic sprouts. Dotted line indicates the spinal cord. c Confocal images showing blood vessels (green) and spinal cord neuronal cells (red) in WT (left) and flt1−/− mutant (middle). 3D reconstruction of a confocal stack in flt1−/− mutant (right). Arrowheads indicate tertiary sprouts. d Tertiary sprout branching from vISV during initiation (left), elongation (middle) and upon anastomosis formation (right). Arrowheads indicate nuclei. e FITC-Dextran labelled blood plasma shows lumenized tertiary sprout at initiation stage (left) and upon anastomosis formation (right). f Confocal imaging of Tg(fli1:PECAM1a-EGFP) upon flt1 loss of function (LOF). g Endothelial junctional morphology in the lumenized endothelial tip cell. Arrowheads indicate finger-like structures. h Finger-like structure number per sprout upon flt1 LOF. Percentage (top) and Mean±s.e.m. (bottom); n = 10 sprouts/embryos. ik Confocal images of pericyte (green) distribution surrounding blood vessels (blue arrowheads) during tertiary sprout initiation (i), elongation (j) and anastomosis formation (k) in flt1−/− mutant. Yellow arrowhead indicates pericytes at the anastomotic-aISV connection. l Confocal imaging of actin reporter in WT and flt1−/− mutant, arrowhead indicates tertiary sprout. m Endothelial surface area for indicated scenario. Violin plot shows median and interquartiles; two-sided Mann–Whitney U test, WT: n = 74 cells (13 embryos), flt1−/− vISV: n = 116 cells (13 embryos), flt1−/− sprout: n = 28 cells (13 embryos). p < 0.0001 for all comparison. n, o Confocal imaging of Tg(kdrl:Hsa.HRAS-mcherry;fli1:PECAM1a-EGFP), segmentation and 3D rendering of primary sprout tip cell (n) and tertiary sprout volume (o). p Cell volume and surface area for indicated scenario. Mean ± s.e.m., two-sided Mann–Whitney U test, n = 7 tip cells/embryos and 6 L-Tip cells/embryos. p(volume) = 0.0221, p(surface) = 0.0350. Scale bars indicate 50 µm in b, c; 20 µm in d, f, g, il; 25 µm in e, n, o. DA dorsal aorta, SC spinal cord, DLAV dorsal lateral anastomotic vessel, aISV arterial intersegmental vessel, vISV venous intersegmental vessel, PCV posterior cardinal vein, dpf days post fertilization, LOF loss of function, EC endothelial cell, PS primary sprouting, TS tertiary sprouting. Source data are provided as a Source Data file.
Fig. 2
Fig. 2. In silico predictions of neural to endothelial cell communication.
a Experimental pipeline and UMAP plot showing the different cell clusters identified by single cell sequencing of 3 dpf WT and flt1−/− embryos. b UMAP plot of the neural cell sub-clusters. Each color represents an individual sub-cluster. c Predicted interactions from neural cells to ECs. d Predicted interactions from ECs to neural cells. e Main pathways predicted to signal from neural cells to ECs. f Overview of potential ligand-receptor interactions from neural cells to ECs in WT and flt1−/−. Circle size indicates p-values. The color scale indicates the communication probability. EC endothelial cell, ERG ependymal radial glia, Oligo oligodendrocytes, Mus. muscle, Ske. skeletal, OPC oligodendrocyte progenitor cell, MN motoneuron, PV parvalbumin, dl dorsal, v ventral, p3 progenitor 3, NPC neuronal progenitor cell, RP roof plate, FP floorplate, EDN endothelin, CALCR calcitonin receptor, TRAIL tumor necrosis factor-related apoptosis-inducing ligand, EDN Endothelin, TGFb Transforming growth factor beta, PDGF Platelet-derived growth factor.
Fig. 3
Fig. 3. Tertiary sprouting upon Vegf gain of function requires aplnra.
a Confocal images showing trunk vasculature in flt1−/− and flt1−/−; aplnra−/− double mutant at 4 dpf. Dotted box indicates ROI; arrowheads indicate ectopic vessels. b Quantification of branching complexity for indicated scenario. Violin plot shows median and interquartiles; two-sided Unpaired t test with Welch’s correction, flt1−/−: n = 36 and flt1−/−; aplnra−/−: n = 26; p = 0.0001. c Arterial to venous ISV ratio for indicated genotype. Mean±s.e.m.; two-sided Fisher’s exact test. flt1−/−: n = 36, flt1−/−; aplnra−/−: n = 26. d Confocal images showing trunk vasculature in vhl−/− mutant injected with control or aplnra targeting morpholino at 4 dpf. Dotted box indicates ROI, Arrowheads indicate ectopic vessels. e Branching complexity for indicated scenario. Violin plot showing median and interquartiles; two-sided Unpaired t test, control MO: n = 14; aplnra MO: n = 28; p < 0.0001. f Single cell sequencing pipeline. GFP+ cells were sorted from Tg(kdrl:EGFP) embryos, captured, bar-coded and sequenced. g UMAP plot of GFP+ sorted cells. Square indicates endothelial cell clusters. h UMAP plot of GFP+ sorted cells, color coded by expression level for tie1 and cdh5. i UMAP plot of EC subclusters. j Violin plot showing the expression of marker genes used to identify the individual EC subclusters. k Dot-plot showing aplnra and aplnrb expression for indicated endothelial subclusters. l Imaging of trunk vasculature in flt1−/− and flt1−/− injected with flt4-GFP-p2A-PTXS1. Dotted box indicates ROI; arrowheads indicate ectopic vessels. m Quantification of ectopic sprouts for indicated scenario. Mean±s.e.m., two-sided Mann-Whitney U test, flt1−/−: n = 30; flt1−/−+flt4-GFP-p2A-PTXS1: n = 37; p = 0.0006. n Arterial to venous ISV ratio for indicated scenario. Mean±s.e.m. Two-sided fisher’s exact test. flt1−/−: n = 30; flt1−/−+flt4-GFP-p2A-PTXS1: n = 37. o Confocal images showing trunk vasculature in flt1−/− mutant treated with DMSO or with Dasatinib at 3 dpf. p Quantification of ectopic sprouts for the indicated scenario. Mean±s.e.m.; two-sided Mann-Whitney U test, flt1−/− + DMSO: n = 8, flt1−/− + Dasatinib: n = 11; p = 0.0393. Scale bars indicate 50 µm in a, d, l, o. MO morpholino, EC endothelial cells, LEC lymphatic endothelial cell, vEC venous endothelial cell, cap. venous capillaries venous, cap. arterial capillaries arterial, aEC arterial endothelial cell, pEC proliferating EC, EdC endocardial cell, PTXS1 Pertussis-Toxin subunit 1, DA dorsal aorta, PCV posterior cardinal vein. Source data are provided as a Source Data file.
Fig. 4
Fig. 4. Aplnra is required for ventral-dorsal migration of EC in venous ISV.
a, b Confocal images showing endothelial cell movements in flt1−/− (a) and flt1−/−; aplnra−/− double mutant (b) at indicated time points. Arrowheads indicate EC nuclei and migration trajectory in the vISV. c Quantification of endothelial migration distance in vISV for indicated scenario. Mean±s.e.m.; two-sided unpaired t test with Welch’s correction, flt1−/−: n = 70 ECs (2–3 per vISVs), flt1−/−; aplnra−/−: n = 32 ECs (2–3 per vISV); p = 0.0030. d Traces of individual endothelial cell movements in flt1−/− (top) and flt1−/−; aplnra−/− double mutant (bottom). flt1−/−: n = 70 ECs, flt1−/−; aplnra−/−: n = 32 ECs. e Confocal images showing EC distribution in vISVs of flt1−/− mutant (left) and flt1−/− upon loss of aplnra (right) at 3 dpf. Asterisks mark ECs in the dorsal (red) and ventral (yellow) domain. f Quantification of dorsoventral distribution of ECs for indicated scenario. Mean±s.e.m.; two-sided Fischer’s exact test; flt1−/−: n = 123 ECs from 13 vISVs, flt1−/−+aplnra MO: n = 108 ECs from 12 vISVs; p = 0.0223. g Confocal images of Tg(−0.8flt1:RFP;flt4:mCitrine) to visualize ECs with arterial (red arrowhead) or venous (green arrowhead) identity in vISVs for flt1−/− (left) and flt1−/−; aplnra−/− double mutant (right) at 3 dpf. h Percentage ECs with arterial identity in the dorsal domain of vISVs. Mean; two-sided Mann–Whitney U test; flt1−/−: n = 32 vISVs from 16 embryos; flt1−/−; aplnra−/−: n = 66 vISVs from 33 embryos; p = 0.0148. i Confocal images of Tg(fli1:nEGFP;fli1:B4GALT1galT-mCherry) showing EC nuclei (green), and position of golgi (red) regarding blood flow direction (red arrow) indicated as angle α. For α = 150-180, polarized against flow-direction; for α = 0–30, polarized in flow-direction. j Confocal images of Tg(fli1:nEGFP;fli1:B4GALT1galT-mCherry) and diagrams showing polarization status of individual ECs in vISV for flt1−/− mutant (left) and flt1−/− upon loss of aplnra (right). k EC polarization for indicated scenario. Mean; Chi-square test, flt1−/−: n = 165 vECs from 21 embryos, flt1−/− + aplnra MO: n = 196 vECs from 19 embryos, p < 0.0001. Scale bars indicate 20 μm in a, b, e, g, j. DA dorsal aorta, PCV posterior cardinal vein, DLAV dorsal lateral anastomotic vessel, MO morpholino, vISV venous intersegmental vessel. Source data are provided as a Source Data file.
Fig. 5
Fig. 5. Tertiary sprouting requires neural Apelin and vascular Apelin-receptor-a signaling in venous EC.
a Relative mRNA expression of apln for indicated scenario at 3 dpf. Mean±s.e.m.; two-sided Unpaired t test with Welch’s correction; n = 6 samples of 20 pooled embryos per condition; p = 0.0007. b, c Violin Plot showing apln expression for indicated EC (b) and neural cell (c) cluster. d, e Imaging of TgBAC(apln:EGFP) reporter in the trunk of WT (d) and flt1 LOF embryos (e) at 3 dpf. Dotted line indicates spinal cord (SC; yellow) and notochord (blue) domain. Apelin expression detected in ISVs (white arrowheads), DLAV (blue arrowheads), and spinal cord neural cells (yellow arrowheads). f Confocal imaging of trunk vasculature and endothelial nuclei (green) in flt1−/− mutant injected with control (left) or apln (right) targeting morpholino at 3 dpf. Dotted box indicates ROI. g Quantification of ectopic sprouts for indicated scenario. Mean±s.e.m.; two-sided Mann–Whitney U test; n = 19 embryos/condition; p < 0.0001. h Arterial to venous ISV ratio for indicated scenario. Mean±s.e.m.; Two-sided Fisher’s exact test; n = 5 embryos/condition. i Number of nuclei in vISVs for indicated scenario. Mean ± s.e.m.; two-sided Mann–Whitney U test; Control MO: n = 41 vISVs; apln MO: n = 53 vISVs; p < 0.0001. j Confocal images showing trunk vasculature in flt1−/− embryo (left) and flt1−/− combined with neuronal specific overexpression of apln (right, indicated as aplnNC; apln expressing cells in green) at 3 dpf. Arrowheads indicate ectopic sprouts. k Quantification of ectopic sprouting for indicated scenario. Mean±s.e.m.; two-sided Mann–Whitney U test; flt1−/−: n = 14, flt1−/− + aplnNC: n = 12; p = 0.0046. l Confocal images showing trunk vasculature in flt1−/− mutant (left) and flt1−/− upon neuronal specific silencing of apln (right, indicated as aplnΔNC). m Quantification of branching complexity for indicated scenario. Mean±s.e.m.; two-sided Unpaired t-test with Welch’s correction; flt1−/−: n = 17, flt1−/− + aplnΔNC: n = 13; p = 0.0213. n Schematic illustration of proposed interaction between Apelin-receptor-a and Kdrl to enhance Kdrl signaling output via Gαi and c-Abl to induce tertiary sprouting. Scale bar indicates 50 µm in df, j, l. SC spinal cord, aISV arterial intersegmental vessel, vISV venous intersegmental vessel, DA dorsal aorta, PCV posterior cardinal vein, DLAV dorsal lateral anastomotic vessel, NC neuronal cells, MO morpholino. Source data are provided as a Source Data file.
Fig. 6
Fig. 6. Trio regulates endothelial morphogenesis in tertiary sprouts.
a Relative mRNA expression of trioa for indicated scenario at 3 dpf. Mean±s.e.m.; two-sided Unpaired t test with Welch’s correction; n = 6 samples of 20 pooled embryos; p = 0.0095. b Confocal images showing trunk vasculature in flt1−/− embryos injected with control (left) or trioa targeting morpholino (right) at 3 dpf. Dotted box indicates ROI. Arrowheads indicate tertiary sprouts. c Quantification of ectopic sprouting for indicated scenario. Mean±s.e.m.; two-sided Mann–Whitney U test, control MO n = 25, trioa MO n = 19; p < 0.001. d Confocal images of Tg(fli1:LIFEACT-EGFP) reporter showing tertiary sprouts in flt1−/− embryos injected with control (top) or trioa targeting morpholino (bottom) at 3 dpf. e Quantification of sprout volume for indicated scenario. Mean±s.e.m.; two-sided Mann–Whitney U test; control MO n = 9, trioa MO n = 7; p = 0.0021. f Confocal images showing trunk vasculature in flt1−/− embryos treated with DMSO (left) or ITX3 (right) at 3 dpf. Dotted box indicates ROI. g Quantification of tertiary sprout numbers for indicated scenario. Mean±s.e.m.; two-sided Mann–Whitney U test; n = 20 embryos per condition; p = 0.0011. h Confocal images of Tg(fli1:LIFEACT-EGFP) reporter showing ectopic sprouts in flt1−/− mutants treated with DMSO (left) or ITX3 (right) at 3 dpf. i Quantification of sprout volume for indicated scenario. Mean±s.e.m.; two-sided Mann–Whitney U test; DMSO: n = 10 sprouts/embryos, ITX3: n = 18 sprouts from 17 embryos; p = 0.0021. j, k Confocal images of Tg(fli1:LIFEACT-EGFP) reporter in flt1−/− embryo (j) and upon venous specific overexpression of TrioN (TrioNvEC) in flt1−/− mutant (k) at 3 dpf; Boxed region at higher magnification in the right panel. l Normalized ectopic network size (area/length) for indicated scenario. Mean±s.e.m.; two-sided Unpaired t-test with Welch’s correction; n = 8 ectopic networks/per condition; p = 0.0133. m Confocal images showing trunk vasculature in vehicle treated (left) and Rac1 inhibitor (right) treated flt1−/− embryos at 3.5 dpf. Dotted boxes indicate ROI; arrowheads indicate ectopic vessels. n Quantification of ectopic vessels for indicated scenario. Mean±s.e.m.; two-sided Mann–Whitney U test; DMSO, n = 23, Rac1inh, n = 23; p = 0.0108. Scale bars indicate 50 µm in b, f, j, k, m; 20 µm in d, h; 25 µm in k crop. MO morpholino, Mdk medaka, inh inhibitor, vEC venous endothelial cell, DA dorsal aorta, PCV posterior cardinal vein. Source data are provided as a Source Data file.
Fig. 7
Fig. 7. Tertiary sprouting requires Esm1.
a Esm1 expression for indicated scenario. Mean±s.e.m.; two-sided unpaired t test; n = 3 samples of 20 pooled embryos; p = 0.0176. b Images of WT or flt1−/− embryos injected with esm1Bac:mCitrine construct. Box indicates the spinal cord. Arrowheads indicate esm1 expression. c Image of esm1 expression (arrowheads) in spinal cord at 3 dpf. dg Trunk vasculature in WT (d), esm1−/− (e), flt1−/− (f), and esm1−/−;flt1−/− embryos (g) at 4 dpf. Box indicates ROI. Arrowheads indicate ectopic vessels. h Branching complexity for indicated scenario. Violin plot indicates median and interquartiles; two-sided Unpaired t test with Welsch’s correction; WT: n = 14, flt1−/−: n = 20, esm1−/−: n = 20, flt1−/−; esm1−/−: n = 26. p < 0.0001 for all indicated comparisons. i Arterial to venous ratio for indicated scenario. Mean±s.e.m.; two-sided Fischer’s exact test; flt1−/−: n = 20, flt1−/−;esm1−/−: n = 26. j Trunk vasculature in vhl−/− and vhl−/− upon esm1 LOF embryos at 4 dpf. Dotted box indicates ROI. k Branching complexity for indicated scenario. Mean±s.e.m.; two-sided unpaired t test; vhl−/−: n = 16; vhl−/−+esm1 LOF: n = 10. P = 0.0001. l Trunk vasculature in flt1−/−, flt1−/− upon vascular esm1 GOF (esm1EC) and flt1−/− upon neuronal esm1 GOF (esm1NC) embryos at 4 dpf. Arrowheads indicate esm1 expression. m Branching complexity for indicated scenario. Violin plot showing median and interquartiles; two-sided Unpaired t-test with Welch’s correction; flt1−/−: n = 13; flt1−/− + Esm1EC: n = 21; flt1−/− + esm1NC: n = 40. p(flt1−/− vs.flt1−/−+esm1NC)<0.0001. n Trunk vasculature in flt1−/−;esm1−/− and flt1−/−;esm1−/− upon vascular esm1 GOF (esm1EC) embryos at 3 dpf. Arrowheads indicate ectopic sprouts. o Ectopic sprout number for indicated scenario. Mean±s.e.m.; two-sided Mann–Whitney U test; n = 7 per condition. p Trunk vasculature in flt1−/−;esm1−/− and flt1−/−;esm1−/− upon neuronal esm1 GOF (esm1NC) embryos at 4 dpf. Arrowheads indicate ectopic vessels. q Ectopic vessel number for indicated scenario. Mean±s.e.m.; two-sided Mann–Whitney U test, flt1−/−;esm1−/−: n = 37; flt1−/−;esm1−/− + esm1NC: n = 43. p < 0.0001. r Schematic illustration of Esm1 function. Scale bars indicate 20 µm in b; 10 µm in c; 50 μm in dg, k, l, n, p. LOF loss of function, EC, endothelial cell, NC neuronal cell, SC spinal cord, aISV arterial intersegmental vessel, vISV venous intersegmental vessel, DA dorsal aorta, FN Fibronectin, ECM extracellular matrix, GOF gain of function. Source data are provided as a Source Data file.
Fig. 8
Fig. 8. Spinal cord vascularization in day 12 WT larvae shows morphological similarities to tertiary sprouting.
a Confocal images showing trunk vasculature at 10, 12 and 14 dpf in WT. Sprouts emanating from ISVs (blue arrowhead) and VTAs (yellow arrowhead). Representative images of 10 embryos per time point. b Confocal images of Tg(−0,8flt1:RFP; flt4:mCitrine) showing the arterial (flt1+, red)—venous (flt4+, green) identity of ISV and VTA derived sprouts at 14 dpf. c Confocal image showing a venous ISV expressing the venous marker CoupTFII in the ventral domain (yellow arrowhead), and two sprouts emanating from the dorsal aspect of this vISV (blue arrowheads) at 12 dpf. Blood flow indicated by dotted arrow. d Expression of arterial-venous identity markers flt1 and flt4 in ISV (left panel) and VTA (right panel) derived sprouts. Note: the majority of the ISV derived sprouts express the venous marker flt4, whereas all VTA derived sprouts express the artery marker flt1. Percentage; n = 50 sprouts for ISV derived and 39 sprouts for VTA derived from 19 animals. e Quantification of the percentage of ISV derived sprouts that emerged from a CoupTFII expressing vein. Percentage; n = 15 sprouts from 7 animals. f Confocal images of Tg(kdrl:TagBFP;fli1:nEGFP) showing EC nuclei in ISV (blue arrowhead) and VTA (yellow arrowhead) derived sprouts at 12 dpf. g Quantification of nuclei number in ISV and VTA derived sprouts. Mean±s.e.m.; n = 17 ISV derived sprouts and 12 VTA derived sprouts from 12 animals. h Injection of TexasRed-Dextran into Tg(kdrl:TagBFP) at 12 dpf to image blood plasma distribution, shows blood plasma in the ISV derived sprout consistent with the sprout being lumenized. In most VTA derived sprouts, no blood plasma was detected, consistent with absence of lumenization during the early stage of sprout remodeling. i Quantification of lumenization in ISV and VTA derived sprouts based on images in h. n = 15 ISV derived sprouts and 13 VTA derived sprouts from 11 animals. Scale bars indicate 50 µm in a; 20 µm in b, c, f and 10 µm in h. DA dorsal aorta, PCV posterior cardinal vein, ISV intersegmental vessel, VTA vertebral artery. Source data are provided as a Source Data file.
Fig. 9
Fig. 9. Spinal cord vascularization in WT larvae is regulated by aplnra, esm1 and flt1.
a Confocal images showing spinal cord vascular network in the trunk of day 14 WT siblings (left) and flt1−/− mutant (right). Arrowheads indicate sprouts. b Quantification of spinal cord vessel sprouting events (left) and ISV derived sprout number (right) in WT siblings and flt1−/− mutant based on images in a. Mean ± s.e.m.; two-sided Mann–Whitney U test; WT: n = 10; flt1−/−: n = 9; p(left) = 0.008, p(right) = 0.0004. c Confocal images showing spinal cord vascular network in WT siblings (left) and esm1−/− mutant (right) at 14 dpf. Arrowheads indicate sprouts. d Quantification of spinal cord sprouting events (left) and ISV derived sprout number (right) in WT siblings and esm1−/− mutant. Mean ± s.e.m.; two-sided Mann–Whitney U test; WT: n = 16; esm1−/−: n = 13; p(left) = 0.0006, p(right) = 0.0243. e Confocal images showing ISV derived sprout morphology in WT (top) and flt1−/− mutant (bottom) at 14 dpf. f Sprout diameter for indicated scenario. Violin plot showing the diameter distribution, median (dashed lines), interquartiles (dotted lines); two-sided Unpaired t test with Welch’s correction; WT: n = 36 ISV-derived sprouts from 10 larvae, flt1−/−: n = 45 ISV-derived sprouts from 8 larvae; p < 0.0001. g Confocal images showing ISV derived sprout morphology in WT (top) and esm1−/− mutant (bottom) at 14 dpf. h Sprout diameter for indicated scenario. Violin plot showing the diameter distribution, median (dashed lines), interquartiles (dotted lines); two-sided Unpaired t test with Welch’s correction; WT: n = 21 ISV-derived sprouts from 10 larvae, esm1−/−: n = 16 ISV-derived sprouts from 8 larvae; p = 0.0074. i Confocal images showing spinal cord vascular network in WT (left) and aplnra−/− mutant (right) at 14 dpf. Arrowheads indicate sprouts. j Quantification of spinal cord vessel sprouting events in aplnra−/− mutant and WT. Mean±s.e.m., two-sided Mann–Whitney U test, WT: n = 35 larvae; aplnra−/−: n = 18 larvae; p = 0.046. Scale bars indicate 50 µm in a, c, e and 10 µm in g, i. ISV, intersegmental vessel. Source data are provided as a Source Data file.

References

    1. Rafii S, Butler JM, Ding BS. Angiocrine functions of organ-specific endothelial cells. Nature. 2016;529:316–325. doi: 10.1038/nature17040. - DOI - PMC - PubMed
    1. Augustin HG, Koh GY. Organotypic vasculature: from descriptive heterogeneity to functional pathophysiology. Science. 2017;357:eaal2379. doi: 10.1126/science.aal2379. - DOI - PubMed
    1. Potente M, Mäkinen T. Vascular heterogeneity and specialization in development and disease. Nat. Rev. Mol. Cell Biol. 2017;18:477–494. doi: 10.1038/nrm.2017.36. - DOI - PubMed
    1. Ferrara N, Davis-Smyth T. The biology of vascular endothelial growth factor. Endocr. Rev. 1997;18:4–25. doi: 10.1210/edrv.18.1.0287. - DOI - PubMed
    1. Olsson AK, Dimberg A, Kreuger J, Claesson-Welsh L. VEGF receptor signalling—In control of vascular function. Nat. Rev. Mol. Cell Biol. 2006;7:359–371. doi: 10.1038/nrm1911. - DOI - PubMed