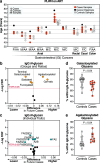
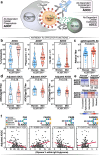
. 2024 Apr 10;15(1):3035.
doi: 10.1038/s41467-024-47279-4.

Immunoglobulin G N-glycan markers of accelerated biological aging during chronic HIV infection

Affiliations

Immunoglobulin G N-glycan markers of accelerated biological aging during chronic HIV infection

Leila B Giron et al. Nat Commun. .

Abstract

People living with HIV (PLWH) experience increased vulnerability to premature aging and inflammation-associated comorbidities, even when HIV replication is suppressed by antiretroviral therapy (ART). However, the factors associated with this vulnerability remain uncertain. In the general population, alterations in the N-glycans on IgGs trigger inflammation and precede the onset of aging-associated diseases. Here, we investigate the IgG N-glycans in cross-sectional and longitudinal samples from 1214 women and men, living with and without HIV. PLWH exhibit an accelerated accumulation of pro-aging-associated glycan alterations and heightened expression of senescence-associated glycan-degrading enzymes compared to controls. These alterations correlate with elevated markers of inflammation and the severity of comorbidities, potentially preceding the development of such comorbidities. Mechanistically, HIV-specific antibodies glycoengineered with these alterations exhibit a reduced ability to elicit anti-HIV Fc-mediated immune activities. These findings hold potential for the development of biomarkers and tools to identify and prevent premature aging and comorbidities in PLWH.


Conflict of interest statement

The authors declare no competing interests.

Figures
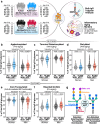
Fig. 1
Fig. 1. Long-term ART-suppressed HIV infection is associated with sex-dependent IgG N-glycan alterations.
a Overview of the main study design. bf Violin plots displaying the levels of IgG N-glycan groups in WLWH and MLWH undergoing long-term ART compared to their PLWoH controls. The median and interquartile range (IQR) are shown. Two-tailed unpaired t tests and false discovery rates (FDRs) were calculated to account for multiple tests over studied markers. Interaction P values were calculated using multivariable models, adjusting for age, ethnicity, and BMI. N = 985 biological samples. g A schematic summary illustrating the IgG N-glycan alterations associated with HIV infection and/or ART treatment. Source data are provided as a Source Data file.
Fig. 2
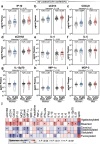
Fig. 2. HIV/ART-associated IgG N-glycan alterations correlate with higher markers of inflammation.
ai Violin plots illustrating the levels of various plasma markers of inflammation in WLWH and MLWH undergoing long-term suppressive ART compared to PLWoH controls. Median and IQR are displayed. Two-tailed unpaired t tests and FDRs were employed to address multiple comparisons. Interaction P values were computed using multivariable models, adjusting for age, ethnicity, and BMI. N = 400 biological samples. j Two-tailed Spearman’s rank correlation heatmap revealing the associations between IgG N-glycan groups (rows) and several plasma markers of inflammation (columns). N = 400 biological samples. Positive correlations are depicted in red, while negative correlations are shown in blue. *P < 0.05, **P < 0.01, and ***P < 0.001. Source data are provided as a Source Data file.
Fig. 3
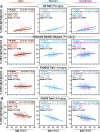
Fig. 3. The associations between IgG N-glycans and chronological age are altered in individuals with long-term ART-suppressed HIV infection.
Two-tailed Spearman’s rank correlations between chronological age (x-axis) and the levels of the following glycan traits (y-axis): (a) A2 glycan trait, (b) bisected GlcNAc glycans, (c) FA2BG2 glycan trait, and (d) FA2G2 glycan trait, were analyzed separately for men, women, and combined groups. The significance of the difference between the slopes of the correlation in PLWH and PLWoH controls was determined from the interaction term between age and HIV status in a linear regression model. N = 985 biological samples. Source data are provided as a Source Data file.
Fig. 4
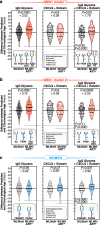
Fig. 4. Machine-learning models based on IgG N-glycans indicate accelerated biological aging during HIV infection suppressed on ART.
Four (a) or three (b) specific glycan traits were selected using the LASSO model and included in models that correlated with chronological age in MLWoH, resulting in an average predicted age that closely matched chronological age. In MLWH, the model revealed an average acceleration of 3.52 (a) or 3.72 (b) years between predicted and chronological age when compared to their PLWoH counterparts. The left panels represent the model incorporating only N-glycans. The middle panels include two inflammatory markers, CXCL9 and Eotaxin. The right panels combine the N-glycan traits and the two inflammatory markers. Violin plots with median and interquartile range (IQR) are shown. N = 496 biological samples. c Two specific glycan traits were selected using the LASSO model and included in a model that correlated with chronological age in WLWoH, resulting in an average predicted age that matched chronological age. The left panel represents the model incorporating only these two glycans. The middle panel includes the two inflammatory markers, CXCL9 and Eotaxin. The right panel combines the two glycan traits and the two inflammatory markers. In WLWH, only the model combining glycans and inflammatory markers revealed an average acceleration of 2.95 years between predicted and chronological age. Violin plots with median and interquartile range (IQR) are shown. N = 496 biological samples. For all panels, significance was determined using two-tailed t tests. The efficiency of the models was evaluated using the likelihood ratio test for nested models. Source data are provided as a Source Data file.
Fig. 5
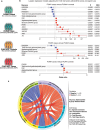
Fig. 5. IgG agalactosylation and bisecting GlcNAc correlate with the development and severity of coronary atherosclerosis during ART-treated HIV Infection.
a Schematic representation of the cases and controls included in this analysis. b Two-tailed logistic regression models illustrating the levels of glycans that exhibited significant differences between PLWH cases and any of the other three groups. The models were adjusted for CVD risk factors (ACC/AHA score) and aspirin use. N = 22 PLWoH controls; N = 22 PLWoH cases; N = 34 PLWH on ART controls; and N = 34 PLWH on ART cases. Dots represent the odds ratio, and the bars represent the 95% upper and lower limits of odds ratio. FDR values were calculated using the Benjamini-Hochberg procedure to correct for multiple comparisons. c A circos plot displaying two-tailed Spearman’s rank correlations between glycans associated with anti-inflammatory activities (green), glycans associated with associated with pro-inflammatory activities (purple), plasma inflammatory markers (yellow), and CVD scores (teal). Red connections indicate a significant positive correlation, while blue connections indicate a significant negative correlation. Only correlations that remained significant after adjusting for CVD risk factors (ACC/AHA score) and aspirin use are shown. The correlation analysis includes only samples from PLWH on ART (n = 68). Source data are provided as a Source Data file.
Fig. 6
Fig. 6. IgG agalactosylation may precede the development of GI-related cancers in PLWH on ART.
a Overview of the longitudinal plasma samples analyzed from cases and controls, including the corresponding ages at the time of collection. The labels F and M represent female and male, respectively, while AA and C indicate African American and Caucasian ethnicity. Samples from cases and controls were matched based on age, sex, and ethnicity. Volcano plots illustrating the IgG glycan groups (b) and individual IgG N-glycans (c) that exhibited a significantly higher (right) or lower (left) average over time in cases compared to controls. FDR values were calculated using the Benjamini-Hochberg procedure to correct for multiple comparisons. Comparison of the average levels of total terminal galactosylated (d) and agalactosylated (e) IgG over a 5–10 year period before cancer onset in cases, contrasting cases with controls. Median and IQR are displayed. Two-tailed unpaired t tests were employed for statistical analysis. Source data are provided as a Source Data file.
Fig. 7
Fig. 7. PLWH exhibit heightened expression of senescence-associated glycan-degrading enzymes compared to PLWoH.
a Schematic representation illustrating the glycosyltransferases responsible for catalyzing different glycans into IgG N-glycans, as well as the glycosidases that remove certain glycans from IgG glycans. Single-cell expression levels of ST3GAL1 (b; data from 1050 single cells), B4GALT1 (c; data from 1295 single cells), FUT8 (d; data from 469 single cells), and MGAT3 (e; data from 33 single cells) in B cells from PLWH on ART and PLWoH. Single cells data were derived from samples of n = 16 PLWH on ART. Two-tailed unadjusted unpaired t tests were performed for statistical analysis. Median and interquartile range (IQR; 25%–75%) are presented. Analysis of publicly available gene expression datasets (GSE18233, GSE19811, GSE23379) for genes encoding sialidases (NEU1 (f), NEU2 (g), and NEU4 (h)) and β-galactosidases (GLB1 (i)), comparing their expression levels between PLWH and PLWoH. Unpaired t tests were performed for statistical analysis. Two-tailed ANOVA or Mann–Whitney tests were performed for statistical analysis, and violin plots display the median and IQR. j Measurement of active β-galactosidase protein levels in the plasma of PLWH on ART and PLWoH. Two-tailed Mann–Whitney T-test was performed for statistical analysis, and violin plots display the median and IQR. k Two-tailed Spearman’s rank correlation heatmap reveals the associations between plasma β-galactosidase in all donors, PLWoH, or PLWH on ART, and agalactosylated or galactosylated IgG glycans from the same donors. Positive correlations are depicted in red, while negative correlations are shown in blue. *P < 0.05, and **P < 0.01. Source data are provided as a Source Data file.
Fig. 8
Fig. 8. HIV/ART-associated IgG N-glycan alterations are linked to compromised HIV-specific IgG Fc-mediated antiviral innate immune functions.
a Schematic illustration highlighting the role of IgG Fc in facilitating various anti-viral innate immune functions, including ADCC, ADCP, and ADCD. b Evaluation of ADCC, ADCP, and ADCD elicited by 20 µg of bulk IgG from WLWH and MLWH after background subtraction using samples from WLWoH and MLWoH, respectively. c Measurement of gp120-specific antibody levels in the same amounts of bulk IgG from WLWH and MLWH. d Normalized data of ADCC, ADCP, and ADCD relative to the levels of gp120-specific antibodies measured in the same amounts of bulk IgG from WLWH and MLWH. For (be), violin plots display median and IQR, and statistical significance was determined using two-tailed unpaired t tests. N = 157–187 biological samples. e Two-tailed Spearman’s rank correlation heatmaps demonstrate the associations between IgG glycans (columns) and adjusted ADCC, ADCP, and ADCD (rows). Positive correlations are represented in red, while negative correlations are depicted in blue. *P < 0.05, **P < 0.01, and ***P < 0.001. f Examples from Two-tailed Spearman’s rank correlations (n = 161 biological samples) in (e) illustrate that fucosylated glycans lacking galactose exhibit negative correlations with adjusted ADCC, while fucosylated glycans containing galactose display positive correlations with adjusted ADCC. Source data are provided as a Source Data file.
Fig. 9
Fig. 9. Glycoengineering reveals that IgG agalactosylation reduces anti-HIV ADCC, while galactosylation enhances it.
a Schematic representation of IgG glycans. b Schematic illustration: 10-1074 was engineered by introducing glycans with four distinct glycan structures. The binding of the four glycoforms to HIV-1 gp120 (c) and HIV-1 Env trimer, BG505 (d), assessed by ELISA. Mean and standard error of the mean (SEM) are displayed. Among fucosylated glycoforms, the galactosylated glycoform (FA2G2) exhibited higher ADCC (e, f), resulting in lower levels of HIV p24 in infected cells (g) compared to the agalactosylated glycoform (FA2). Among afucosylated glycoforms, the galactosylated glycoform (A2G2) exhibited higher ADCC (e, f), resulting in lower levels of HIV p24 in infected cells (g) compared to the agalactosylated glycoform (A2). N = 3–4 biological replicates. Error bars in (e) represents mean and standard SE. For (f), the box and whiskers showing all data from minimum to maximum. Analysis in (e, f) was done using one-way ANOVA corrected by the two-stage Benjamini, Krieger, & Yekutieli method. AUC = Area Under the Curve. Source data are provided as a Source Data file.

Update of

References

    1. Roomaney RA, van Wyk B, Pillay-van Wyk V. Aging with HIV: increased risk of HIV comorbidities in older adults. Int. J. Environ. Res. Public Health. 2022;19:2359. doi: 10.3390/ijerph19042359. - DOI - PMC - PubMed
    1. Franceschi C, Campisi J. Chronic inflammation (inflammaging) and its potential contribution to age-associated diseases. J. Gerontol. A Biolmed. Sci. Med. Sci. 2014;69:S4–S9. doi: 10.1093/gerona/glu057. - DOI - PubMed
    1. Nasi M, et al. Ageing and inflammation in patients with HIV infection. Clin. Exp. Immunol. 2017;187:44–52. doi: 10.1111/cei.12814. - DOI - PMC - PubMed
    1. Minciullo PL, et al. Inflammaging and anti-inflammaging: the role of cytokines in extreme longevity. Arch. Immunol. Ther. Exp. 2016;64:111–126. doi: 10.1007/s00005-015-0377-3. - DOI - PubMed
    1. Nixon DE, Landay AL. Biomarkers of immune dysfunction in HIV. Curr. Opin. HIV AIDS. 2010;5:498–503. doi: 10.1097/COH.0b013e32833ed6f4. - DOI - PMC - PubMed

Grants and funding