. 2024 Apr 10;15(1):3109.
doi: 10.1038/s41467-024-47247-y.

Allopolyploid origin and diversification of the Hawaiian endemic mints

Affiliations

Allopolyploid origin and diversification of the Hawaiian endemic mints

Crystal M Tomlin et al. Nat Commun. .

Abstract

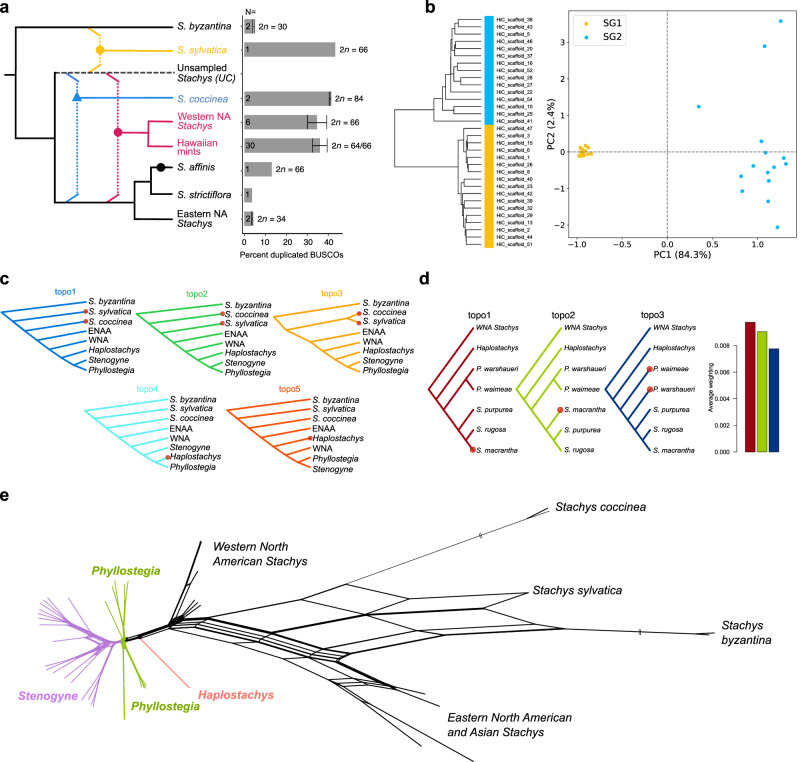
Island systems provide important contexts for studying processes underlying lineage migration, species diversification, and organismal extinction. The Hawaiian endemic mints (Lamiaceae family) are the second largest plant radiation on the isolated Hawaiian Islands. We generated a chromosome-scale reference genome for one Hawaiian species, Stenogyne calaminthoides, and resequenced 45 relatives, representing 34 species, to uncover the continental origins of this group and their subsequent diversification. We further resequenced 109 individuals of two Stenogyne species, and their purported hybrids, found high on the Mauna Kea volcano on the island of Hawai'i. The three distinct Hawaiian genera, Haplostachys, Phyllostegia, and Stenogyne, are nested inside a fourth genus, Stachys. We uncovered four independent polyploidy events within Stachys, including one allopolyploidy event underlying the Hawaiian mints and their direct western North American ancestors. While the Hawaiian taxa may have principally diversified by parapatry and drift in small and fragmented populations, localized admixture may have played an important role early in lineage diversification. Our genomic analyses provide a view into how organisms may have radiated on isolated island chains, settings that provided one of the principal natural laboratories for Darwin's thinking about the evolutionary process.


Conflict of interest statement

The authors declare no competing interests.

Figures

Fig. 1
Fig. 1. Assembly and structural evolution of the Stenogyne calaminthoides genome.
a Photo of Stenogyne calaminthoides (credit: V.A.A.). b Hi-C contact map with inferred chromosomes in blue boxes. c Gene and repeat landscape of S. calaminthoides genome with outer to inner tracks showing genes (purple), Copia (blue), Helitron (green), and Gypsy (red) repeats, respectively. Density over 1 Mb intervals is shown by black lines. Regions of synteny are shown in the center and each pair shares a color. Scaffold number is shown on the exterior. d Fractionation bias plot of S. calaminthoides mapped onto Vitis vinifera chromosome 10. Each coloured line represents a S. calaminthoides scaffold. e Schematic phylogenetic tree showing inferred polyploid events in Stenogyne, with the triangle representing the gamma paleohexaploidy found in all core eudicots, the blue circle representing a whole genome duplication (WGD) found in most core Lamiales, and the pink circle representing the WGD event exclusive to Stenogyne. Source data for Figs. 1c and 1d are provided as a Source Data file.
Fig. 2
Fig. 2. Phylogenetic relationships and admixture among Hawaiian mints and relatives.
The phylogenetic trees are based on maximum likelihood analysis of single nucleotide polymorphism (SNP) dataset DS4 (left; see also Supplementary Fig. 7) and an ASTRAL coalescence tree of BUSCO single copy nuclear genes (right; see also Supplementary Fig. 10). Clade names used in the text are indicated on the SNP tree: ENAA (eastern North American and Asian Stachys), WNA (western North American Stachys). Sta. = Stachys, Hap. = Haplostachys, Phy. = Phyllostegia, Ste. = Stenogyne; numbers after taxon names refer to project ID number for taxa that have more than one individual represented (see Supplementary Data 4). Discordance between the two trees is marked with a tanglegram and dotted, red-colored branches and crossed bars in the AMIXTURE plot. ADMIXTURE results shown between the two trees with each color representing a separate ancestral population, K (best-fitting K = 9 is shown). Source data are provided as a Source Data file.
Fig. 3
Fig. 3. Allopolyploid history and phylogenetic conflict among Hawaiian mints and relatives.
a Left panel: Schematic tree showing hypothesized allopolyploid events among sampled taxa (see text for details). Circles represent polyploid events and the triangle indicates a potential hexaploidy event. Dotted lines associated with colored symbols indicate progenitor lineages of the allopolyploidy events, while the dashed branch leading to “unsampled Stachys (UC)” represents a hypothetical, unsampled diploid relative of Stachys coccinea. Timing and order of polyploidy events are not to scale. Right panel: The mean percentages of duplicated BUSCO genes and known chromosome counts (2n) for each group are displayed in the schematic tree. Data and N are presented as mean values ±SD and number of individuals, respectively. b PCA of kmers from reference Stenogyne calaminthoides inferred from SubPhaser. SG1 represents the ENAA subgenome and SG2 represents the UC subgenome. c The top five topologies found from Twisst analyses of dataset DS4 (all taxa included). Taxa that move among trees are highlighted with red dots. See Supplementary Fig. 15a for details of the groupings used. d The top three trees found from Twisst analyses based only on Hawaiian mints and WNA Stachys relatives. Taxa that move among trees are highlighted with red dots. The bar plot shows the average weighting values for each tree. See Supplementary Fig. 15b for details of the groupings used. e Phylogenetic network (NeighborNet) of all samples (dataset DS4). See Supplementary Fig. 17 for complete network with branches labelled. Source data are provided as a Source Data file.
Fig. 4
Fig. 4. Genetic structure and diversity among Hawaiian mints and relatives.
a Principal component analysis (PCA) of dataset DS4c (Stachys byzantina excluded). The insert shows a PCA plot of Stenogyne (purple) and Phyllostegia (green) with dotted lines connecting them to the phylogenetic tree based on SNP data. b Singletons and doubletons (homozygous sites for a unique SNP) and (c) Heterozygosity based on SNP dataset DS7 (Supplementary Data 6). Individuals for each Hawaiian genus, respectively, and representatives of the same Stachys species were combined. Box plots depict the median (center line), the mean (cross), and the upper and lower quartile box limits (whiskers are the first and third quartiles). Number of individuals (N) are shown below the X-axis. Source data are provided as a Source Data file.
Fig. 5
Fig. 5. Admixture and demographic history in a putative hybrid swarm of Stenogyne microphylla and Stenogyne rugosa.
a Map of Hawai’i showing the location of the hybrid populations on Mauna Kea (red star), with the Kaaliali trail zoomed in. The dots represent the 11 sites sampled along the Kaaliali trail, each with ten Stenogyne microphylla and purported hybrid individuals collected and analyzed. b Silica-gel-preserved plant material and habitat images of Stenogyne individuals from Mauna Kea, labeled by site where relevant. Top to bottom: 0.1.4, an open flower; 0.1.9, a somewhat elongate, S. rugosa-like leaf; 0.3.1, smaller, S. microphylla-like leaves; 1.0.8, elongate to short leaves, representing an admixed individual; S. microphylla-like plant climbing on a Sophora tree; S. rugosa-like plant, entirely terrestrial in habit. c ADMIXTURE results (dataset HM1), with best-fitting K = 2, is shown to the left (numbers refer to the sampling sites shown in (a), and the average leaf area measured from each individual is displayed to the right. Open squares and triangles refer to the mostly admixed samples from sites 0.1 and 1.0, respectively, while the filled circles and triangles indicate mostly unadmixed and the S. microphylla and S. rugosa reference samples, respectively. Arrows correspond to the samples imaged in (b) (also from top to bottom). d Principal component analysis (dataset HM1), showing PC2 and PC3. Source data are provided as a Source Data file. Image sources for panel a are Google Earth, Image Landsat / Copernicus, Data LDEO-Columbia, NSF, NOAA, Data SIO, NOAA, U.S. Navy, NGA, GEBCO, Data MBARI; inset, web map service data provided by USDA.

References

    1. Gillespie RG, et al. Comparing adaptive radiations across space, time, and taxa. J. Heredity. 2020;111:1–20. doi: 10.1093/jhered/esz064. - DOI - PMC - PubMed
    1. Stearns, H. T. Geology of the Hawaiian islands. (Honolulu Advertiser, 1946).
    1. Price JP, Clague DA. How old is the Hawaiian biota? Geology and phylogeny suggest recent divergence. Proc. R. Soc. Lond. Ser. B: Biol. Sci. 2002;269:2429–2435. doi: 10.1098/rspb.2002.2175. - DOI - PMC - PubMed
    1. Stone, C. P. & Stone, D. B. Conservation biology in Hawaiʻi, (University of Hawaii Cooperative National Park Resources Studies Unit, Honolulu, Hawaiʻi, 1989).
    1. Simon C. Hawaiian evolutionary biology: an introduction. Trends Ecol. Evol. 1987;2:175–178. doi: 10.1016/0169-5347(87)90015-2. - DOI - PubMed