. 2024 Jun;27(6):1087-1102.
doi: 10.1038/s41593-024-01619-1. Epub 2024 Apr 10.

Messenger RNA transport on lysosomal vesicles maintains axonal mitochondrial homeostasis and prevents axonal degeneration

Affiliations

Messenger RNA transport on lysosomal vesicles maintains axonal mitochondrial homeostasis and prevents axonal degeneration

Raffaella De Pace et al. Nat Neurosci. 2024 Jun.

Abstract

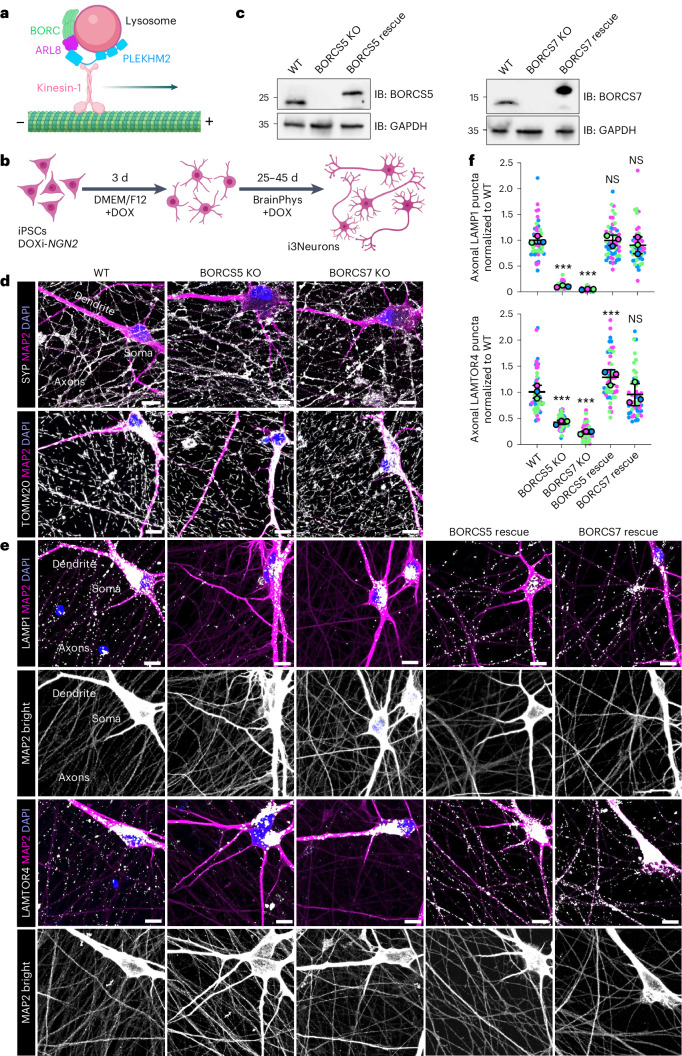
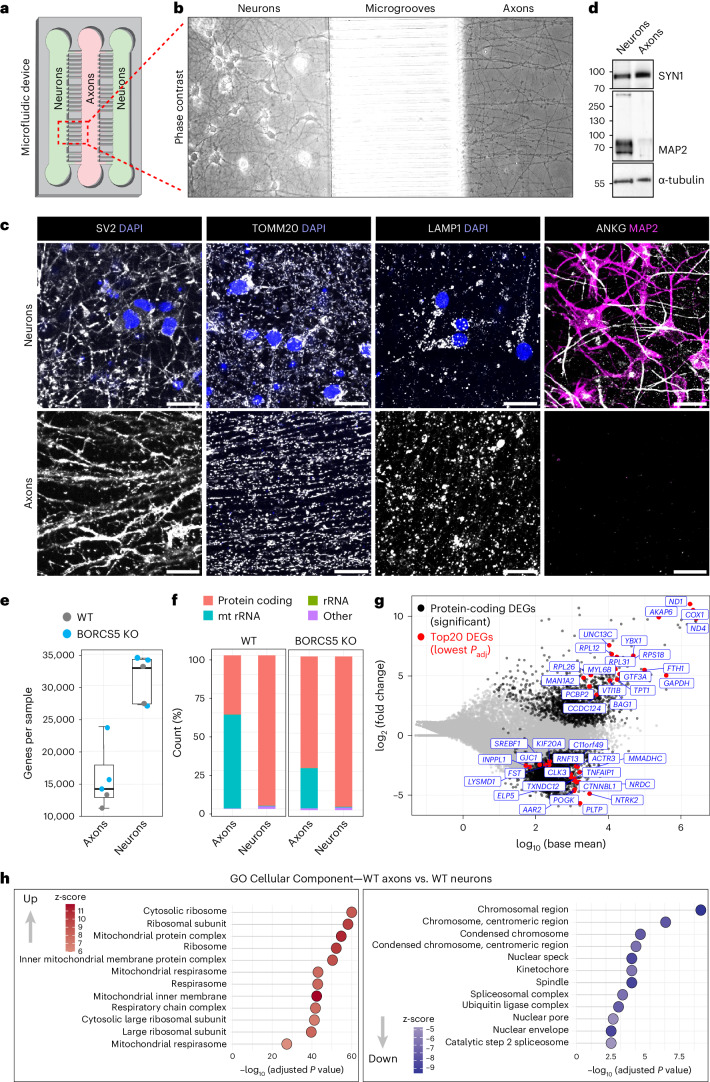
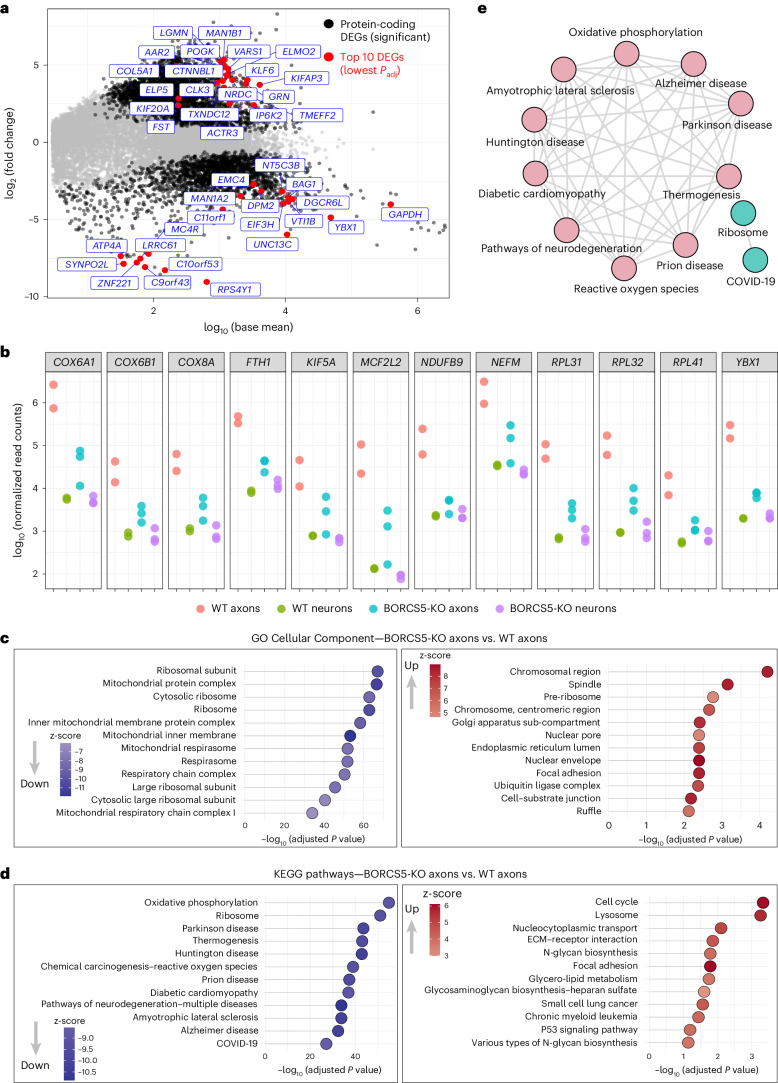
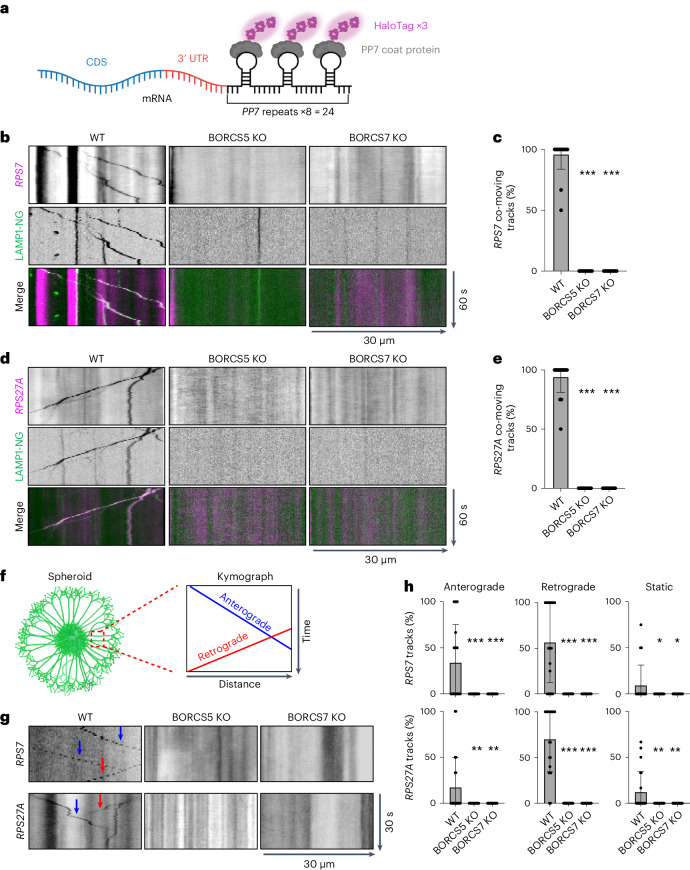
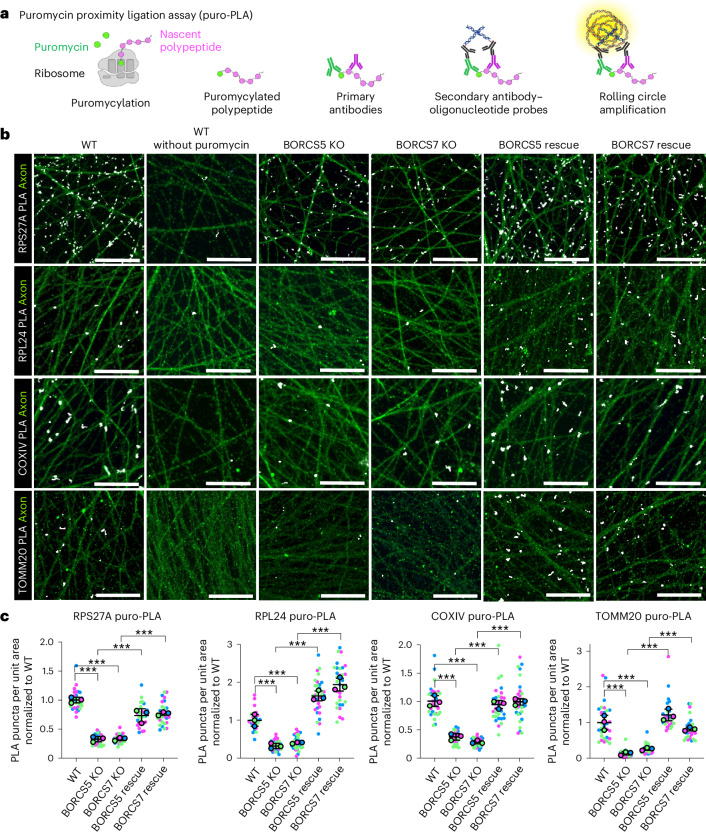
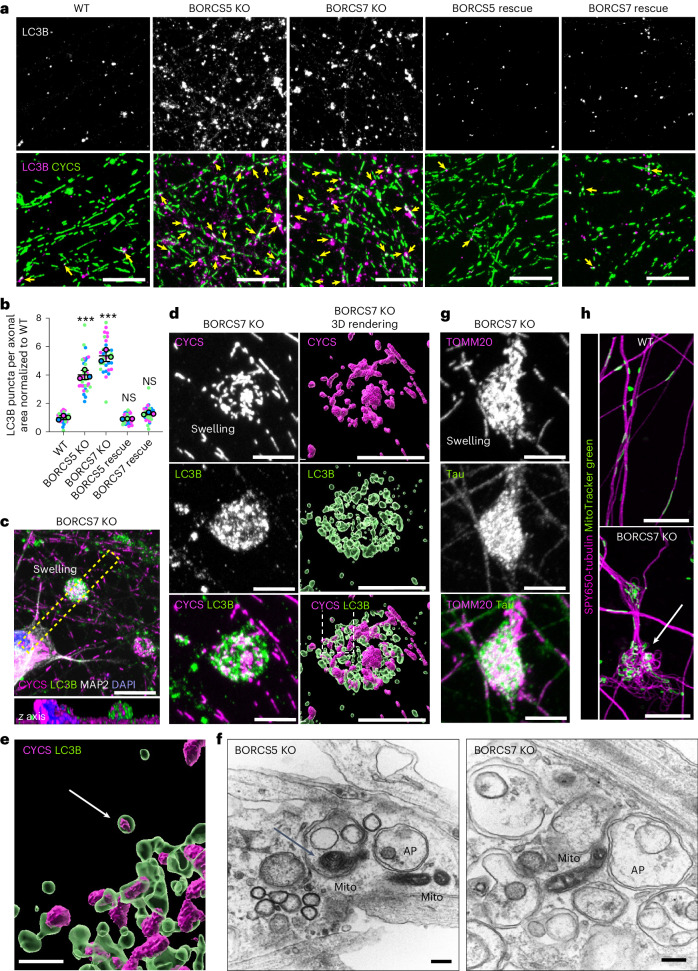
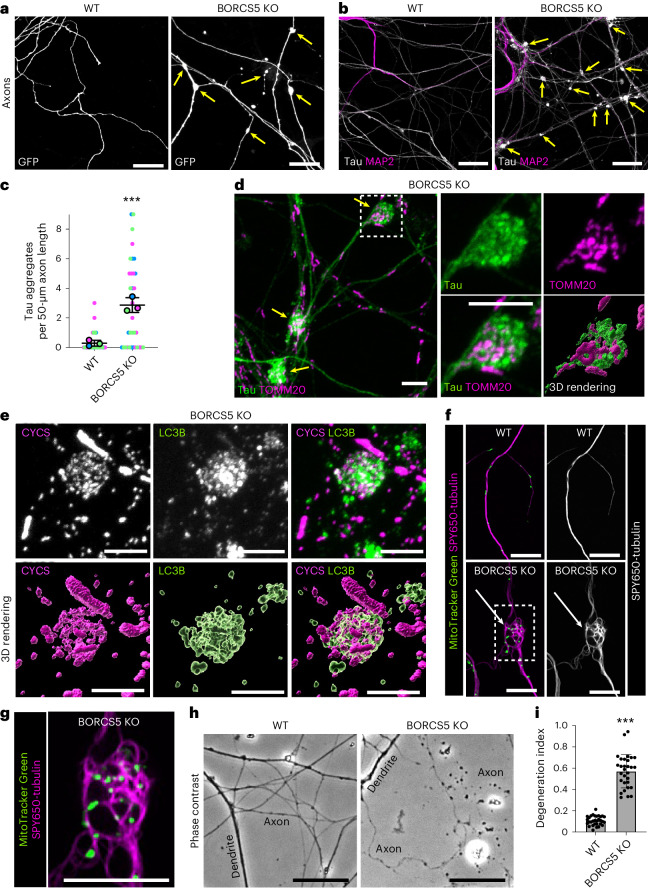
In neurons, RNA granules are transported along the axon for local translation away from the soma. Recent studies indicate that some of this transport involves hitchhiking of RNA granules on lysosome-related vesicles. In the present study, we leveraged the ability to prevent transport of these vesicles into the axon by knockout of the lysosome-kinesin adaptor BLOC-one-related complex (BORC) to identify a subset of axonal mRNAs that depend on lysosome-related vesicles for transport. We found that BORC knockout causes depletion of a large group of axonal mRNAs mainly encoding ribosomal and mitochondrial/oxidative phosphorylation proteins. This depletion results in mitochondrial defects and eventually leads to axonal degeneration in human induced pluripotent stem cell (iPSC)-derived and mouse neurons. Pathway analyses of the depleted mRNAs revealed a mechanistic connection of BORC deficiency with common neurodegenerative disorders. These results demonstrate that mRNA transport on lysosome-related vesicles is critical for the maintenance of axonal homeostasis and that its failure causes axonal degeneration.


Conflict of interest statement

The authors declare no competing interests.

Figures

Fig. 1
Fig. 1. Depletion of axonal lysosomes in BORCS5-KO and BORCS7-KO i3Neurons.
a, Schematic representation of the coupling of lysosomes to the plus-end-directed kinesin-1 motor through the BORC–ARL8–PLEKHM2 ensemble. b, iPSCs were differentiated for 3 d in DMEM/F12 medium supplemented with NEAAs, GlutaMAX and N2A and doxycycline (DOX) and further cultured for 25–45 d in BrainPhys medium containing B27, laminin, BDNF, NT-3 and DOX. c, SDS-PAGE and immunoblot (IB) analysis of WT, BORCS5-KO, BORCS7-KO, BORCS5-KO re-expressing BORCS5-P2A-GFP (rescue) and BORCS7-KO re-expressing BORCS7-HA-P2A-GFP (rescue) iPSCs using antibodies to BORCS5, BORCS7 and GAPDH (loading control). After self-cleavage, 22 amino acid residues at the N-terminus of P2A remain linked to the upstream protein, thus the higher molecular mass in the rescue cells. The positions of molecular mass markers (in kDa) are indicated on the left. d,e, i3Neurons derived from the WT, BORCS5-KO, BORCS7-KO (d) and BORCS5 rescue and BORCS7 rescue (e) iPSCs shown in c were cultured for 25 d on glass coverslips and immunostained for endogenous MAP2 (soma and dendrites) (magenta), synaptophysin (SYP) (synaptic vesicles), TOMM20 (mitochondria), LAMP1 (lysosomes) or LAMTOR4 (lysosomes) (all grayscale). Nuclei were stained with DAPI (blue). Scale bars, 10 μm. See also Extended Data Figs. 1, 2a and 8a. Panel e additionally shows higher intensity images of MAP2 staining in grayscale (MAP2 bright). f, Quantification of the number of axonal puncta staining for LAMP1 or LAMTOR4 in various i3Neuron lines relative to WT i3Neurons (defined as 1.0) from n = 3 independent experiments such as that shown in e. Results are represented as SuperPlots showing the individual data points in different colors, the mean from each experiment and the mean of the means ± s.d. Statistical significance was calculated by one-way ANOVA with Dunnett’s multiple comparisons test. Axonal LAMP1 significance versus WT: BORCS5 KO ***P < 0.001, BORCS7 KO ***P < 0.001, BORCS5 rescue P = 0.995 and BORCS7 rescue P = 0.157. Axonal LAMTOR4 significance versus WT: BORCS5 KO ***P < 0.001, BORCS7 KO ***P < 0.001, BORCS5 rescue ***P < 0.001 and BORCS7 rescue P = 0.870. NS, not significant, relative to WT. Source data
Fig. 2
Fig. 2. Axonal mRNA profile of i3Neurons cultured in a microfluidic device.
a, Schematic representation of a microfluidic device designed to isolate pure axons. The device is composed of three chambers separated by two sets of microgrooves. i3Neurons were plated on the two side chambers (green) and cultured for 45 d, during which time axons grew toward the central chamber (pink). b, Phase-contrast image of neurons and axons grown in the microfluidic device. c, i3Neurons grown in the microfluidic device were immunostained for the indicated proteins (all grayscale and/or magenta). Nuclei were stained with DAPI (blue). The experiment was repeated three times. Scale bars, 20 μm. d, Immunoblot analysis of protein extracts from neuronal and axonal compartments of the microfluidic device. The immunoblot was repeated two times. The positions of molecular mass markers (in kDa) are indicated on the left. e, RNA extracted from the axonal and neuronal compartments of n = 2 WT and n = 3 BORCS5 KO independent cultures of i3Neurons was subjected to RNA-seq. The number of genes with non-zero read counts was counted without normalization across the biological replicates. Box plots show the individual data points, median (center line indicating the 50th percentile), 75th percentile (top of the box) and 25th percentile (bottom of the box). The whiskers extend to the maximum and minimum data value that is no more than 1.5 times the interquartile range above or below the hinge. f, Proportion of the indicated RNA biotypes in axonal and neuronal preparations. g, MA plot of protein-coding genes in WT axons compared to WT neurons. Each dot represents a protein-coding gene with its mean normalized read count in log10 scale (x axis) and fold change in log2 scale (y axis). Insignificant (FDR > 0.1), significant (FDR < 0.1) and top 20 (lowest FDR) protein-coding DEGs for both up or down DEGs are colored gray, black and red, respectively. Top 20 gene names are indicated. h, Dot plots for GO Cellular Component gene sets enriched in WT axons versus WT neurons in RNA-seq. Enriched gene sets were arranged by statistical significance (FDR). The z-score captures both the direction of changes and the number of genes changing in each direction. A larger absolute z-score indicates a more biased direction toward increase or decrease. Statistical significance was calculated by one-sided Fisher’s exact test. P values were adjusted for multiple comparisons using the Benjamini–Hochberg method. Source data
Fig. 3
Fig. 3. Depletion of mRNAs encoding ribosomal and mitochondrial proteins from the axon of BORCS5-KO i3Neurons.
a, MA plot for protein-coding genes in BORCS5-KO axons versus WT axons identified by RNA-seq. Each dot represents a protein-coding gene with its mean normalized read count (x axis) and log2 fold change (y axis). Insignificant (FDR > 0.1), significant (FDR < 0.1) and top 20 (lowest FDR) protein-coding DEGs for both up or down DEGs are colored gray, black and red, respectively. Top 20 up or down genes are indicated. b, Expression profiling of selected axonal genes shown to be axon enriched in i3Neurons (the present study) and other neuronal types,–. Each dot represents a biological replicate, with log10-normalized read counts for each gene on the y axis. c,d, Dot plots for gene sets in GO Cellular Component (c) and KEGG pathways (d). Left panel (down) represents the set of genes that had a negative interaction term in the axon and no change in neurons due to BORCS5 KO; right panel (up) shows the set of genes that had a positive interaction term in the axon and no change in neurons due to BORCS5 KO. Enriched gene sets in c and d were arranged by statistical significance (FDR). The z-score captures both the direction of changes and the number of genes changing in each direction. A larger absolute z-score indicates a more biased direction toward up or down. Statistical significance was calculated by one-sided Fisher’s exact test. P values were adjusted for multiple comparisons using the Benjamini–Hochberg method. e, Enrichment map for top 12 KEGG gene sets decreased in BORCS5-KO axons versus WT axons in RNA-seq. The gene sets in the left panel of d were clustered by a community detection algorithm. The map consists of nodes for pathways and edges indicating the presence of DEGs that are concurrently found between the pathways.
Fig. 4
Fig. 4. Transport of mRNAs encoding ribosomal proteins is reduced in the axon of BORC-subunit-KO i3Neurons.
a, Constructs used for RNA visualization. A construct encoding HaloTags fused to the PP7 coat protein was stably co-expressed with the coding sequencing (CDS) of the gene of interest followed by its 3′ UTR, fused to PP7 RNA stem-loop repeats in WT, BORCS5-KO or BORCS7-KO i3Neurons. b,d, Kymographs of RPS7 (b) or RPS27A (d) i3Neurons co-expressing the constructs described in a were transduced with LAMP1-mNeonGreen (LAMP1-NG) and incubated with the fluorescent Halo substrate JF646 to image axonal lysosome-related vesicle and mRNA movement, respectively. Axons were imaged live for 60 s. Kymographs were generated from Supplementary Videos 1 and 2. Single-color images are represented in inverted grayscale. See Extended Data Fig. 6 for negative control of JF646 staining. c,e, Quantification of co-moving LAMP1-NG and RPS7 (c) or RPS27A (e) mRNA tracks. Values are the mean ± s.d. of ~22 kymographs from ~22 neurons per condition and are expressed as the percentage of the indicated marker that co-moves with LAMP1-NG. Statistical significance was calculated by one-way ANOVA with Dunnett’s multiple comparisons test. BORCS5 KO versus WT ***P < 0.001 and BORCS7 KO versus WT ***P < 0.001 for both c and e. f, Scheme of a neuronal spheroid. Axons were imaged live for 30 s, and kymographs were generated from the videos. Lines with negative or positive slopes represent anterograde or retrograde movement, respectively. g, Kymographs of axonal mRNA movement in i3Neurons co-expressing combinations of RPS7-PP7 or RPS27A-PP7 repeats and HaloTag-PP7 coat constructs were generated from spheroids. h, Quantification of anterograde, retrograde and static RPS7 or RPS27A mRNA tracks. Values are the mean ± s.d. from ~20 kymographs from ~20 neurons per condition and are expressed as the percentage of the indicated marker in anterograde, retrograde or static particles. Statistical significance was calculated by one-way ANOVA with Dunnett’s multiple comparisons test. P values relative to WT: RPS7 anterograde, BORCS5 KO ***P < 0.001, BORCS7 KO ***P < 0.001; retrograde, BORCS5 KO ***P < 0.001, BORCS7 KO ***P < 0.001; static, BORCS5 KO *P = 0.023, BORCS7 KO *P = 0.023. RPS27A anterograde, BORCS5 KO **P = 0.004, BORCS7 KO **P = 0.004; retrograde, BORCS5 KO ***P < 0.001, BORCS7 KO ***P < 0.001; static, BORCS5 KO **P = 0.003, BORCS7 KO **P = 0.003.
Fig. 5
Fig. 5. Decreased translation of mRNAs encoding ribosomal and mitochondrial proteins in axons from BORC-KO neurons.
a, Schematic representation of puro-PLA (see Methods for description). b, WT, BORCS5-KO, BORCS7-KO, BORCS5-KO rescue and BORCS7-KO rescue i3Neurons grown for 25 d on glass coverslips were double stained with puro-PLA for the ribosomal proteins RPS27A or RPL24, or the mitochondrial proteins COXIV or TOMM20 (all in grayscale), and MAP2 for faint axonal staining as described above (green channel). The axonal field was imaged by confocal fluorescence microscopy. Scale bars, 20 μm. The experiment was repeated three times. c, Quantification of the number of puro-PLA puncta per unit axon area from three independent experiments such as that shown in b. Results are represented as SuperPlots showing the individual data points in different colors, the mean from each experiment and the mean of the means ± s.d. Statistical significance was calculated by one-way ANOVA with Tukey’s multiple comparisons test. RPS27A: BORCS5 KO versus WT ***P < 0.001, BORCS7 KO versus WT ***P < 0.001, BORCS5 rescue versus BORCS5 KO ***P < 0.001, BORCS7 rescue versus BORCS7 KO ***P < 0.001. RPL24: BORCS5 KO versus WT ***P < 0.001, BORCS7 KO versus WT ***P < 0.001, BORCS5 rescue versus BORCS5 KO ***P < 0.001, BORCS7 rescue versus BORCS7 KO ***P < 0.001. COXIV: BORCS5 KO versus WT ***P < 0.001, BORCS7 KO versus WT ***P < 0.001, BORCS5 rescue versus BORCS5 KO ***P < 0.001, BORCS7 rescue versus BORCS7 KO ***P < 0.001. TOMM20: BORCS5 KO versus WT ***P < 0.001, BORCS7 KO versus WT ***P < 0.001, BORCS5 rescue versus BORCS5 KO ***P < 0.001, BORCS7 rescue versus BORCS7 KO ***P < 0.001.
Fig. 6
Fig. 6. Mitochondrial defects in axons from BORC-KO i3Neurons.
a, IB analysis of axons from WT, BORCS5-KO or BORCS7-KO i3Neurons cultured in microfluidic devices and analyzed for endogenous mitochondrial proteins and GAPDH (loading control). Molecular mass markers (in kDa) are indicated on the left. b, Quantification from three independent experiments such as that shown in a. Statistical significance was calculated by one-way ANOVA with Dunnett’s multiple comparisons test. Data are represented as mean ± s.d. P values relative to WT: NDUFS1, BORCS7 KO P = 0.078, BORCS5 KO **P = 0.006. SDHA, BORCS7 KO **P = 0.003, BORCS5 KO ***P < 0.001. CYCS, BORCS7 KO P = 0.417, BORCS5 KO **P = 0.003. COXIV, BORCS7 KO **P = 0.002, BORCS5 KO ***P < 0.001. ATP5A, BORCS7 KO *P = 0.026, BORCS5 KO ***P < 0.001. TOMM20, BORCS7 KO *P = 0.031, BORCS5 KO *P = 0.033. MIC60, BORCS7 KO P = 0.231, BORCS5 KO **P = 0.005. MIC10, BORCS7 KO P = 0.811, BORCS5 KO *P = 0.034. c, WT i3Neurons were incubated with the mitochondrial ΔΨm-reporter TMRE with or without FCCP (control), and the axonal field was imaged live. Scale bars, 20 μm. d, Quantification of TMRE intensity per unit axonal area from n = 3 independent experiments such as that shown in c. Data are represented as SuperPlots showing the individual data points, the mean from each experiment and the mean of the means ± s.d. Statistical significance was calculated by one-way ANOVA with Dunnett’s multiple comparisons test. P values relative to WT: TMRE, WT + FCCP ***P < 0.001, BORCS5 KO ***P < 0.001, BORCS7 KO ***P < 0.001. e, i3Neurons were incubated with MitoSOX with or without rotenone (control), and the axonal field was imaged live. Scale bars, 20 μm. f, Quantification of MitoSOX intensity per unit area of axonal field as described for d. Statistical significance was calculated by one-way ANOVA with Dunnett’s multiple comparisons test. P values relative to WT: MitoSOX, WT + rotenone ***P < 0.001, BORCS5 KO ***P < 0.001, BORCS7 KO ***P < 0.001. g, i3Neurons were immunostained for TOMM20, and the axonal field was imaged. Scale bars, 10 μm. h, Size and length of axonal mitochondria measured from experiments such as that shown in g. Values are the mean ± s.d. from ~12 fields. Statistical significance was calculated by one-way ANOVA with Dunnett’s multiple comparisons test. P values relative to WT: Size, BORCS5 KO **P < 0.006, BORCS7 KO ***P < 0.001. Length, BORCS5 KO *P < 0.025, BORCS7 KO ***P < 0.001. i, Axonal mitochondria were analyzed by TEM in n = 2 independent experiments. Scale bars, 400 nm. j, Quantification of the number of cristae per mitochondrial unit length from n = 26 axons in n = 2 independent experiments. Values are the mean ± s.d. from images like the ones in i. Statistical significance was calculated using unpaired two-tailed Student’s t-test. BORCS7 KO versus WT ***P < 0.001. Source data
Fig. 7
Fig. 7. Accumulation of axonal autophagosomes and swellings in BORC-KO i3Neurons.
a, i3Neurons were immunostained for LC3B (autophagosomes) and CYCS (mitochondria), and the axonal fields were imaged. Single-channel images are shown in grayscale. Arrows in the merge panels indicate LC3B puncta in association with mitochondria. Scale bars, 10 μm. b, Quantification of the number of LC3B puncta per unit of axonal area from three independent experiments, such as those shown in a. Data are represented as SuperPlots showing the individual data points, the mean from each experiment and the mean of the means ± s.d. Statistical significance was calculated by one-way ANOVA with Dunnett’s multiple comparisons test. Significance relative to WT: BORCS5 KO ***P < 0.001, BORCS7 KO ***P < 0.001, BORCS5 KO rescue P < 0.981, BORCS7 KO rescue P < 0.468. c, BORCS7-KO i3Neurons were quadruple stained for LC3B, CYCS, MAP2 and nuclear DNA (DAPI). The top image shows axonal swellings in xy view. Scale bar, 10 μm. The bottom image shows a z axis view of the dashed rectangle. d, 3D volume rendering using Imaris of a swelling from a BORCS7-KO i3Neuron immunostained for LC3B and CYCS as above. Scale bars, 5 μm. e, Zoomed-in view of the boxed area in the 3D rendering from d shows a mitochondrion inside an autophagosome (white arrow). Scale bar, 1 μm. f, TEM of axons showing swellings filled with autophagosomes (AP) and mitochondria (Mito). Arrow indicates a mitochondrion inside an autophagosome. Scale bars, 200 nm. g, Swelling from a BORCS7-KO i3Neuron immunostained for TOMM20 and the microtubule-associated protein Tau. Scale bars, 5 μm. See also Extended Data Fig. 8a. h, i3Neurons sequentially stained with SPY650-tubulin and MitoTracker Green (mitochondria) were imaged live on an Airyscan confocal microscope. Arrow points at microtubule swirls in an axonal swelling. Scale bars, 10 μm. See also Extended Data Fig. 8b. All neurons shown in ch were grown for 25 d, and the experiments were repeated three times.
Fig. 8
Fig. 8. Accumulation of axonal autophagosomes and swellings in cortical neurons from BORCS5-KO mice.
a, Cortical neurons isolated from WT and BORCS5-KO E17 mouse embryos were transfected with a plasmid expressing soluble GFP. Arrows indicate axonal swellings. Scale bars, 20 μm. The experiment was repeated three times. b, Cortical neurons from WT and BORCS5-KO mice were immunostained for Tau (axon) and MAP2 (soma and dendrites). Arrows indicate the accumulation of Tau-positive aggregates in the swellings. Scale bars, 20 μm. c, Quantification of the number of Tau-positive swellings per unit length of axon from three experiments, such as shown in b. Data are represented as SuperPlots showing the individual data points, the mean from each experiment and the mean of the means ± s.d. Statistical significance was calculated using an unpaired two-tailed Student’s t-test. BORCS5 KO versus WT ***P < 0.001. d, Axonal swellings (arrows) in BORCS5-KO mouse cortical neurons immunostained with antibodies to Tau and TOMM20 (mitochondria). The four images on the right are magnified views and a 3D rendering of the boxed area. Scale bars, 5 μm. e, Immunofluorescence microscopy and 3D rendering of axonal swellings in cortical neurons from BORCS5-KO mice stained for LC3B (autophagosomes) and CYCS (mitochondria). Scale bars, 5 μm. f, Axons from WT and BORCS5-KO mouse cortical neurons sequentially stained with SPY650-tubulin (tubulin) for 1 h and MitoTracker Green (mitochondria) for 10 min were imaged live on an Airyscan confocal microscope. Arrows point to microtubule swirls in an axonal swelling. Scale bars, 10 μm. g, Zoomed-in view of the boxed area from f shows microtubule swirls in an axonal swelling. Scale bar, 20 μm. All the experiments shown in df were repeated three times. h, Phase-contrast microscopy of axons from WT and BORCS5-KO mouse cortical neurons. Notice fragmentation in the BORCS5-KO axons. Scale bars, 5 μm. i, Quantification of axon DI from two independent experiments, such as the one shown in h. Values are the mean ± s.d. from 30 images. Statistical significance was calculated using an unpaired two-tailed Student’s t-test. BORCS5 KO versus WT ***P < 0.001. Neurons shown in this figure were cultured for 7 d (ag) or 10 d (h and i).
Extended Data Fig. 1
Extended Data Fig. 1. Distribution of endosomal and TGN markers is not affected in BORC-KO i3Neurons.
a-c, WT, BORCS5-KO and BORCS7-KO i3Neurons grown for 25 days on glass coverslips were fixed, permeabilized and co-stained with antibodies to endogenous MAP2 (soma and dendrites) (magenta) (all three panels) and cation-independent mannose 6-phosphate receptor (CI-MPR) (endosomes and TGN) (a), early endosomal antigen 1 (EEA1) (early endosomes) (b), or TGN46 (TGN) (c) (all in grayscale). Nuclear DNA was stained with DAPI (blue). Scale bars: 10 μm. Notice the presence of CI-MPR in all neuronal domains including axons (a), EEA1 only in the soma and dendrites (b) and TGN46 only in the soma (c), and how the distribution of all these markers does not change upon BORCS5 KO or BORCS7 KO. All the experiments shown in a-c were repeated three times.
Extended Data Fig. 2
Extended Data Fig. 2. Decreased RPL41 mRNA staining in axons from BORCS5-KO i3Neurons.
a, i3Neurons [WT, BORCS5 KO, BORCS5 KO rescued with WT BORCS5, and BORCS5 KO rescued with a G2A, myristoylation-defective BORCS5 (ΔMyr)] were immunostained for endogenous MAP2 (soma and dendrites) (magenta), neurofilament heavy chain (NFH) (axons, blue), LAMP1 (lysosomes) or LAMTOR4 (lysosomes) (all grayscale). Nuclei were stained with DAPI (yellow). Scale bars: 20 μm. Experiments were repeated three times. b, Quantification of the number of axonal puncta staining for LAMP1 or LAMTOR4 in the indicated i3Neuron lines relative to WT i3Neurons (defined as 1.0) from three experiments such as that shown in panel a. Results are represented as SuperPlots, showing the individual data points and mean of the means ± SD. Statistical significance was calculated by one-way ANOVA with Dunnett’s multiple comparisons test. Significance relative to WT: LAMP1, BORCS5 KO ***P < 0.001, BORCS5 rescue P = 0.586, BORCS5 ΔMyr rescue ***P < 0.001. LAMTOR4, BORCS5 KO ***P < 0.001, BORCS5 rescue P = 0.382, BORCS5 ΔMyr rescue ***P < 0.001. ns: not significant. Notice the depletion of lysosome-related vesicles from the axon of BORCS5-KO neurons and the rescue of this phenotype by WT but not ΔMyr BORCS5. c, The same i3Neuron lines shown in panel a were grown on coverslips for 20 days, fixed and processed for RNAscope in situ hybridization using a probe for RPL41 mRNA (white dots). Cells were also immunostained for NFH (axons, blue). Scale bars: 20 μm. Experiments were repeated three times. d, Quantification of the number of RPL41 dots per axon unit area in the indicated i3Neuron lines relative to WT i3Neurons (defined as 1.0) from three experiments such as that shown in panel c. Results are represented as SuperPlots, showing the individual data points and mean of the means ± SD. Statistical significance was calculated by one-way ANOVA with Dunnett’s multiple comparisons test. Significance relative to WT: RPL41, BORCS5 KO ***P < 0.001, BORCS5 rescue P = 0.780, BORCS5 ΔMyr rescue ***P < 0.001. Notice the depletion of RPL41 mRNA in the axon of BORCS5-KO neurons, and the rescue of this phenotype by WT but not ΔMyr BORCS5, paralleling the results for lysosome-related vesicles.
Extended Data Fig. 3
Extended Data Fig. 3. Design of a microfluidic device for isolation of axons from i3Neurons.
a, Schematic representation of the method used to prepare a microfluidic device. PDMS: polydimethylsiloxane. b, The device is composed of three open chambers approximately 2-mm wide by 40-mm long, separated by two sets of ~2,400 microgrooves with dimensions shown. A slightly wider gap (115 mm) between microgrooves is used every 1.7 mm to improve stability of the mounted device (see Supplementary Data 2 and 3 for CAD files of mask design). The PDMS component is represented in gray. Pre-differentiated i3Neurons are plated on the lateral chambers and axons grow into the middle chamber. This device provides a substantially larger culture area for neuronal seeding (400 mm2 in the two outer chambers combined) and for axonal growth (200 mm2 in the central chamber) compared to available commercial options. The open-chamber design provides an improved culture environment for the cells because it facilitates gas exchange with the medium and offers easier access for initial seeding, reagent addition, and sample collection. The high density of the microgrooves (60 microgrooves/mm), the ability to seed neurons close to the microgrooves, and the proximity of the entire area of the axon chamber to the microgrooves all help to increase the isolation throughput. c, WT i3Neurons grown for 45 days in a microfluidic device were immunostained for endogenous Tau (axons) and MAP2 (soma and dendrites). Nuclei were stained with DAPI. Images were obtained by confocal fluorescence microscopy. Representative images from the neuronal (left) or axonal (right) compartments are shown. Experiments were repeated three times. Notice the absence of somatodendritic and nuclear markers in the axonal compartment, indicating the purity of the axonal preparation. Scale bars: 20 μm.
Extended Data Fig. 4
Extended Data Fig. 4. Relationship of mRNA sets depleted in BORCS5-KO axons to neurodegenerative disorders and COVID-19, and GO Cellular Component and KEGG pathway analysis of changed mRNA sets.
a, Venn diagram for functional enrichment related to neurodegenerative disorders. DEGs that were down in BORCS5-KO axons compared to WT axons matched to gene sets related to neurodegenerative disorders, as defined by KEGG. b, Venn diagram for functional enrichment related to ribosomes and COVID-19. DEGs that were down in BORCS5-KO axons compared to WT axons matched to gene sets related to ribosome and COVID-19, as defined by KEGG. c, GO Cellular Component analysis of gene sets that are increased or decreased in BORCS5-KO neurons vs WT neurons and BORCS5-KO axons vs BORCS5-KO neurons. d, KEGG pathway analysis of gene sets that are increased or decreased in BORCS5-KO neurons vs WT neurons and BORCS5-KO axons vs BORCS5-KO neurons. Both c and d show dot plots for DEG sets that are increased (up) or decreased (down) in RNA-Seq. Enriched terms are arranged by statistical significance (FDR), showing the top 12 terms. The z-score captures both the direction of changes and the number of genes changing in each direction. A larger absolute z-score indicates a more biased direction towards increase or decrease. Statistical significance was calculated by one-sided Fisher’s exact test. P-values were adjusted for multiple comparisons using the Benjamini-Hochberg method.
Extended Data Fig. 5
Extended Data Fig. 5. Control experiment demonstrating the specificity of HaloTag staining in mRNA transport experiments.
WT i3Neurons co-expressing 3 HaloTags fused to PP7 coat protein and RPS7 fused to 24 PP7 RNA stem-loop repeats (top row) (see scheme in Fig. 4a), or untransfected WT i3Neurons (negative control) (bottom row), were grown on coverslips for 25 days and transduced with LAMP1-mNeonGreen (LAMP1-NG) for 36 h. Neurons were then incubated overnight with 200 pM of the fluorescent HaloTag substrate JF646 and imaged by spinning-disk confocal microscopy. Scale bars: 20 μm. Notice the absence of JF646 signal in the control i3Neurons, demonstrating that the JF646 signal represents RPS7 staining and not non-specific staining of lysosome-related vesicles or other vesicles. Experiments were repeated three times.
Extended Data Fig. 6
Extended Data Fig. 6. BORC-independent rescue of axonal RPS7 mRNA by expression of LAMP1-3xKBS in BORCS5-KO and BORCS7-KO i3Neurons.
a, WT, BORCS5-KO and BORCS7-KO i3Neurons co-expressing the PP7 coat protein fused with three HaloTags and RPS7 CDS fused with 24 PP7 RNA stem-loop repeats were grown on coverslips for 15 days. Cells were then transduced with a construct encoding three repeats of a kinesin-binding sequence (KBS) fused to NeonGreen-tagged LAMP1 (LAMP1-3xKBS-NG) for 36 h and incubated with 200 pM of the fluorescent Halo substrate JF646 overnight to image lysosome-related vesicles and RPS7 mRNA localization at axon terminals. Scale bars for left, LAMP1-3xKBS-NG and merged columns: 10 μm. Scale bars for RPS7 zoomed-in boxed areas: 5 μm. b, Quantification of the number of RPS7 puncta per axon terminal from n = 3 independent experiments. Values are represented as SuperPlots, showing the individual data points and the mean of the means ± SD. Statistical significance was calculated by one-way ANOVA with Dunnett’s multiple comparisons test. BORCS5 KO vs WT ***P < 0.001, BORCS7 KO vs WT ***P < 0.001, BORCS5 KO + LAMP1-3xKBS vs BORCS5 KO ***P < 0.001, BORCS7 KO + LAMP1-3xKBS vs BORCS7 KO ***P < 0.001, BORCS5 KO + LAMP1-3xKBS vs WT + LAMP1-3xKBS P = 0.998, BORCS7 KO + LAMP1-3xKBS vs WT + LAMP1-3xKBS P = 0.949. ns: not significant relative to WT. Notice the increased number of RPS7 mRNA and lysosomal puncta in BORCS5-KO and BORCS7-KO i3Neurons transduced with LAMP1-3xKBS-NG.
Extended Data Fig. 7
Extended Data Fig. 7. BORC-independent rescue of axonal RPS27A mRNA by expression of LAMP1-3xKBS in BORCS5-KO and BORCS7-KO i3Neurons.
a, WT, BORCS5-KO and BORCS7-KO i3Neurons co-expressing the PP7 coat protein fused with three HaloTags and RPS27A CDS fused with 24 PP7 RNA stem-loop repeats were grown on coverslips for 15 days. Cells were then transduced with a construct encoding LAMP1-3xKBS-NG for 36 h and incubated with 200 pM of the fluorescent Halo substrate JF646 overnight to image lysosome-related vesicles and RPS27A mRNA localization at axon terminals. Scale bars for left, LAMP1-3xKBS-NG and merged columns: 10 μm. Scale bars for RPS27A zoomed-in boxed areas: 5 μm. b, Quantification of the number of RPS27A puncta per axon terminal from n = 3 independent experiments. Values are represented as SuperPlots, showing the individual data points and the mean of the means ± SD. Statistical significance was calculated by one-way ANOVA with Dunnett’s multiple comparisons test. BORCS5 KO vs WT ***P < 0.001, BORCS7 KO vs WT ***P < 0.001, BORCS5 KO + LAMP1-3xKBS vs BORCS5 KO ***P < 0.001, BORCS7 KO + LAMP1-3xKBS vs BORCS7 KO ***P < 0.001, BORCS5 KO + LAMP1-3xKBS vs WT + LAMP1-3xKBS P = 0.721, BORCS7 KO + LAMP1-3xKBS vs WT + LAMP1-3xKBS P = 0.136. ns: not significant relative to WT. Notice the increased number of RPS27A mRNA and lysosomal puncta in BORCS5-KO and BORCS7-KO i3Neurons transduced with LAMP1-3xKBS-NG.
Extended Data Fig. 8
Extended Data Fig. 8. Tau aggregates and microtubule swirls in axonal swellings from BORCS7-KO i3Neurons.
a, WT and BORCS7-KO i3Neurons were cultured for 25 days on glass coverslips and stained with Tau-1 antibody (marker for axons and axonal degeneration when aggregated), TOMM20 (mitochondria), and MAP2 (soma and dendrites). Nuclei were stained with DAPI (blue). Neurons were imaged by confocal fluorescence microscopy. Notice that swellings in BORCS7-KO axons (yellow arrows) contain Tau-1-positive aggregates and mitochondria. Scale bars: 10 μm. Experiments were repeated three times. b, BORCS7-KO i3Neurons grown for 25 days on glass coverslips were analyzed by TEM. Left column: detailed view of two axonal swellings in BORCS7-KO axons. Right column: magnified views of the boxed areas on the left. Curved microtubules (MT) indicative of a swirl-like organization are visible in the swellings (arrows). Scale bars: 400 nm. This experiment was repeated twice.
Extended Data Fig. 9
Extended Data Fig. 9. Axonal swellings containing neurofilament protein, Tau, and autophagosomes in sciatic nerves from BORCS5-KO mice.
a, b, Sciatic nerves were isolated from WT and BORCS5-KO E17 mouse embryos. Nerves were fixed and immunostained for endogenous Tau (magenta) and LAMP1 (lysosomes, green) (panel a) or LC3B (autophagosomes, grayscale) (panel b). Nerves were also co-stained for NFH (axons, grayscale in panel a and magenta in panel b), and DAPI (nuclei, blue), and imaged by confocal fluorescence microscopy. Enlarged views of the boxed areas are shown on the right. Areas encircled by dashed lines indicate swellings devoid of LAMP1 staining. Scale bars: 20 μm. c, Quantification of the number of axonal swellings (NFH-positive) per unit of sciatic nerve area from n = 9 images captured from n = 3 animals. Values are the mean ± SD from representative images like those shown in panels a and b. Statistical significance was calculated using an unpaired two-tailed Student’s t test. BORCS5 KO vs WT ***P < 0.001.
Extended Data Fig. 10
Extended Data Fig. 10. Accumulation of autophagosomes in the axons of BORCS5 -KO mouse brain.
a, Brains were harvested from WT and BORCS5-KO E17 mouse embryos and the corpus callosum was analyzed by TEM as described in the Methods. The figure shows low magnification (left column) and high magnification images of the boxed areas (right column). Notice the presence of numerous autophagosomes (AP) in the axons of BORCS5-KO neurons, morphologically identified by their size and presence of synaptic vesicles, microtubules, and neurofilaments. Scale bars: 600 nm. b, Quantification of the number of autophagosomes per field unit area from n = 25 images captured from n = 2 animals. Values are the mean ± SD from representative images like those shown in panel a. Statistical significance was calculated using an unpaired two-tailed Student’s t test. BORCS5 KO vs WT ***P < 0.001.

References

    1. Ballabio A, Bonifacino JS. Lysosomes as dynamic regulators of cell and organismal homeostasis. Nat. Rev. Mol. Cell Biol. 2020;21:101–118. - PubMed
    1. Shin HR, Zoncu R. The lysosome at the intersection of cellular growth and destruction. Dev. Cell. 2020;54:226–238. - PMC - PubMed
    1. Ferguson SM. Neuronal lysosomes. Neurosci. Lett. 2019;697:1–9. - PMC - PubMed
    1. Roney JC, Cheng XT, Sheng ZH. Neuronal endolysosomal transport and lysosomal functionality in maintaining axonostasis. J. Cell Biol. 2022;221:e202111077. - PMC - PubMed
    1. Lee S, Sato Y, Nixon RA. Lysosomal proteolysis inhibition selectively disrupts axonal transport of degradative organelles and causes an Alzheimer’s-like axonal dystrophy. J. Neurosci. 2011;31:7817–7830. - PMC - PubMed