. 2024 May;26(5):784-796.
doi: 10.1038/s41556-024-01401-2. Epub 2024 Apr 10.

Endogenous aldehyde-induced DNA-protein crosslinks are resolved by transcription-coupled repair

Affiliations

Endogenous aldehyde-induced DNA-protein crosslinks are resolved by transcription-coupled repair

Yasuyoshi Oka et al. Nat Cell Biol. 2024 May.

Abstract

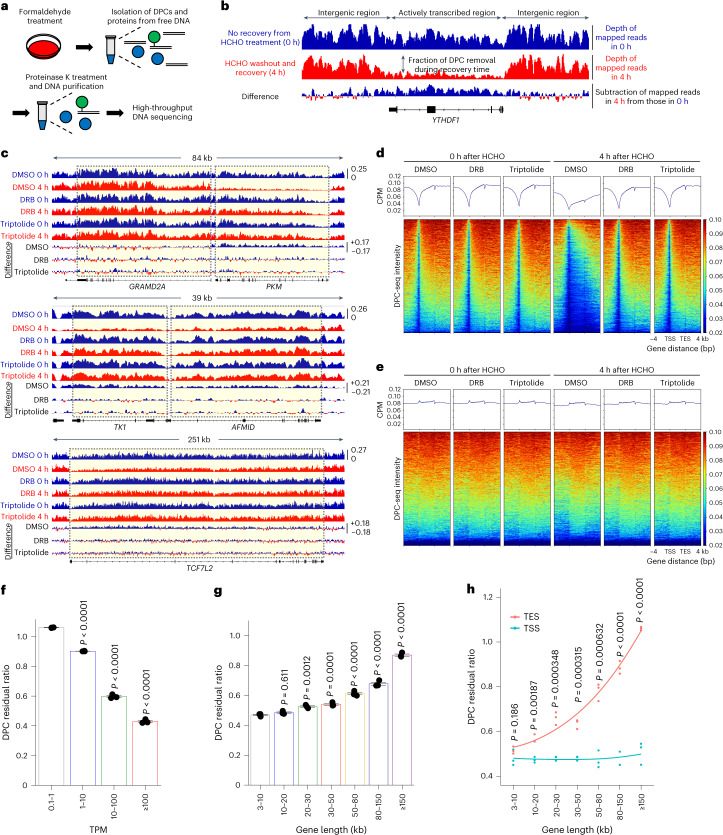
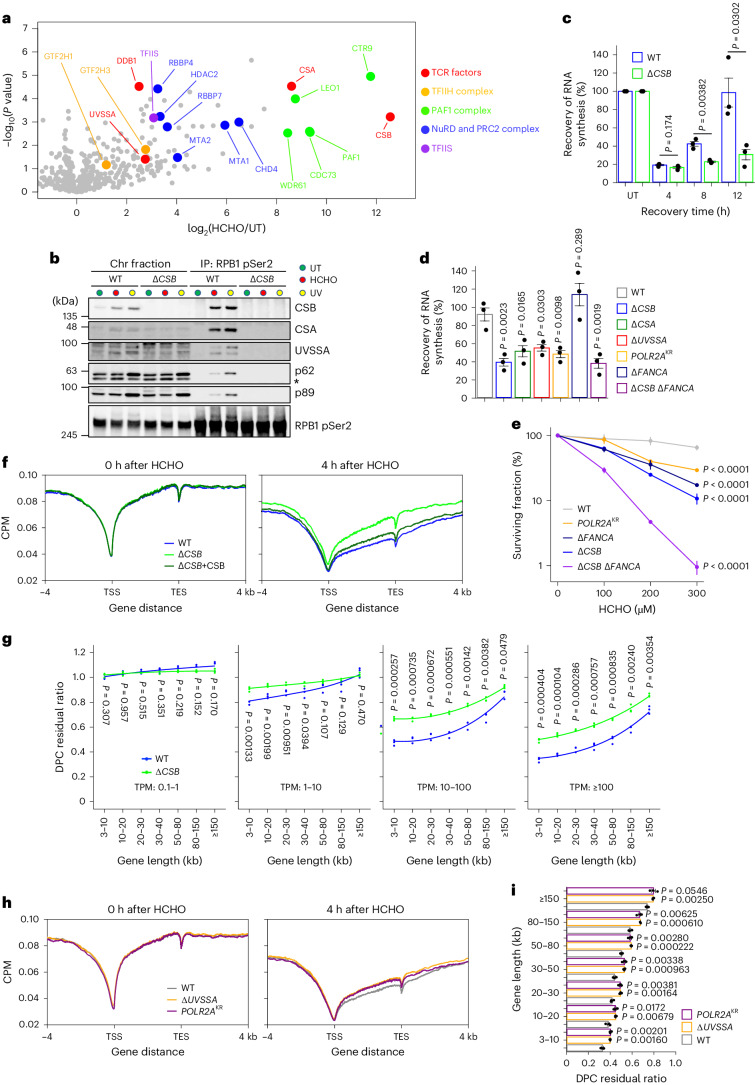
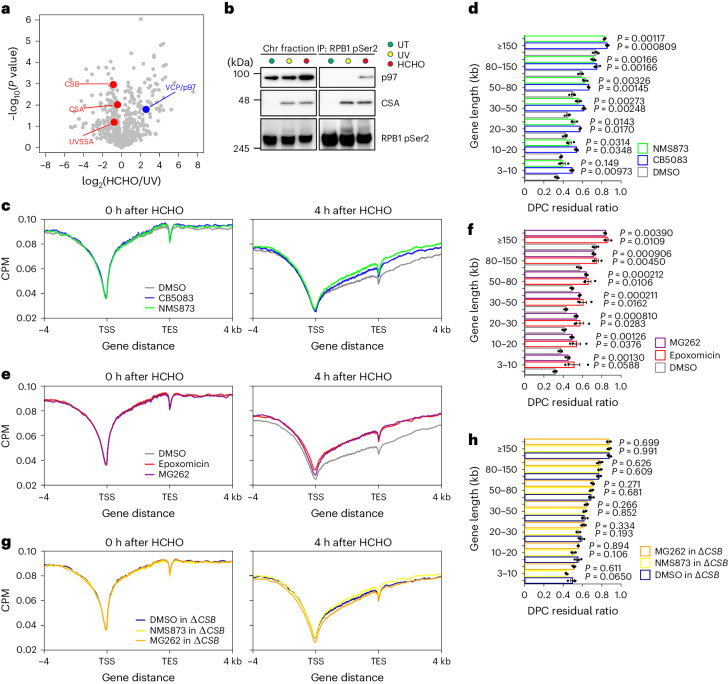
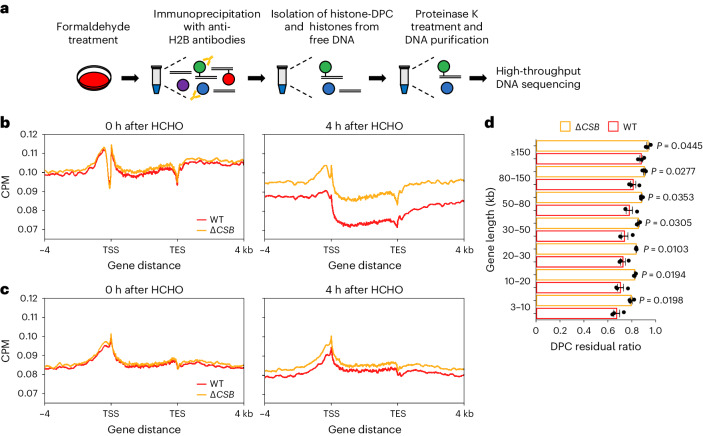
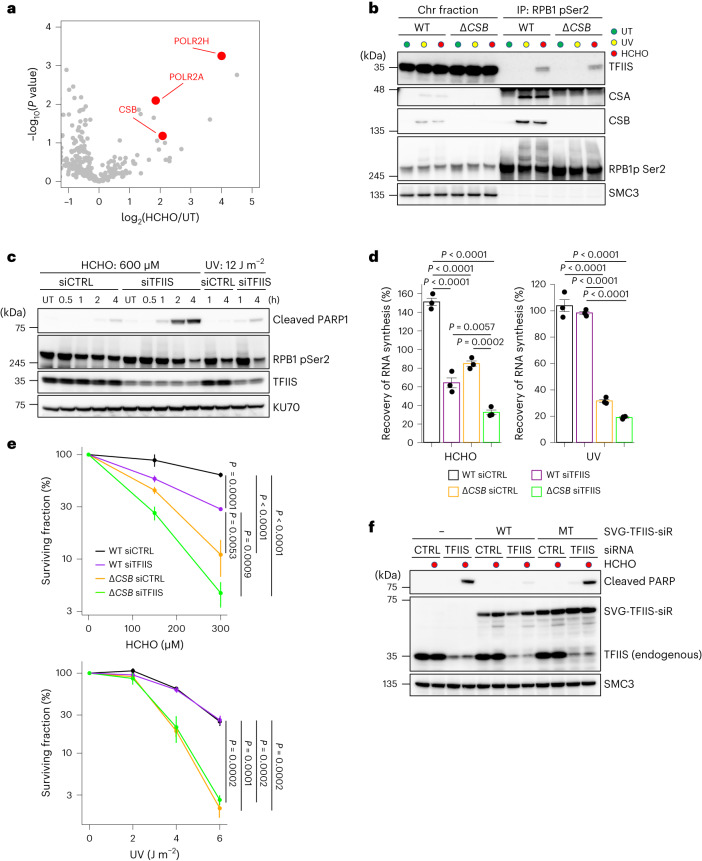
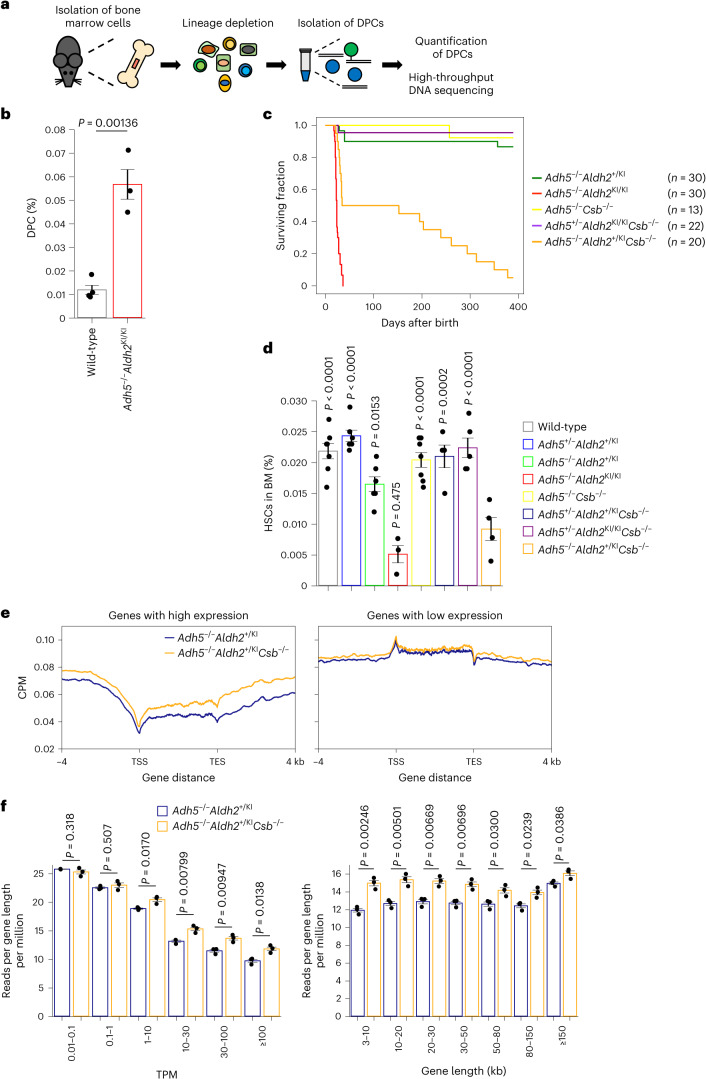
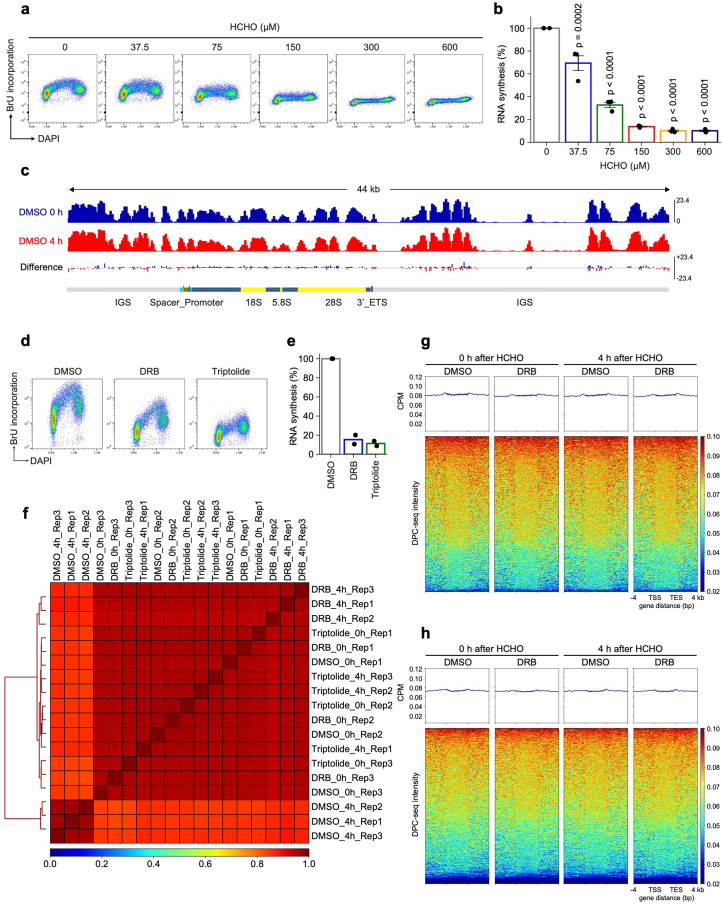
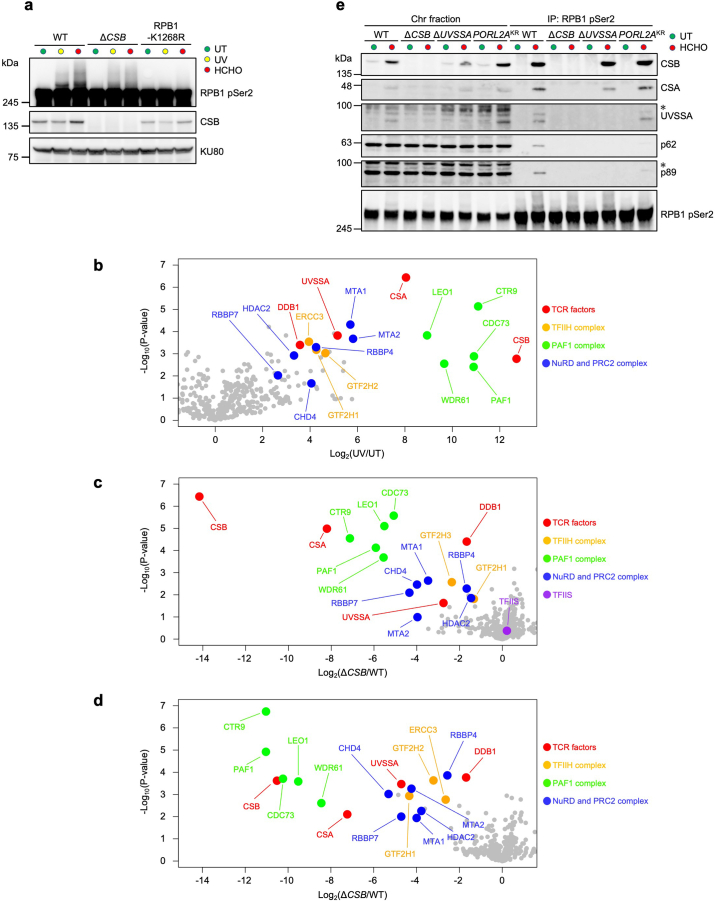
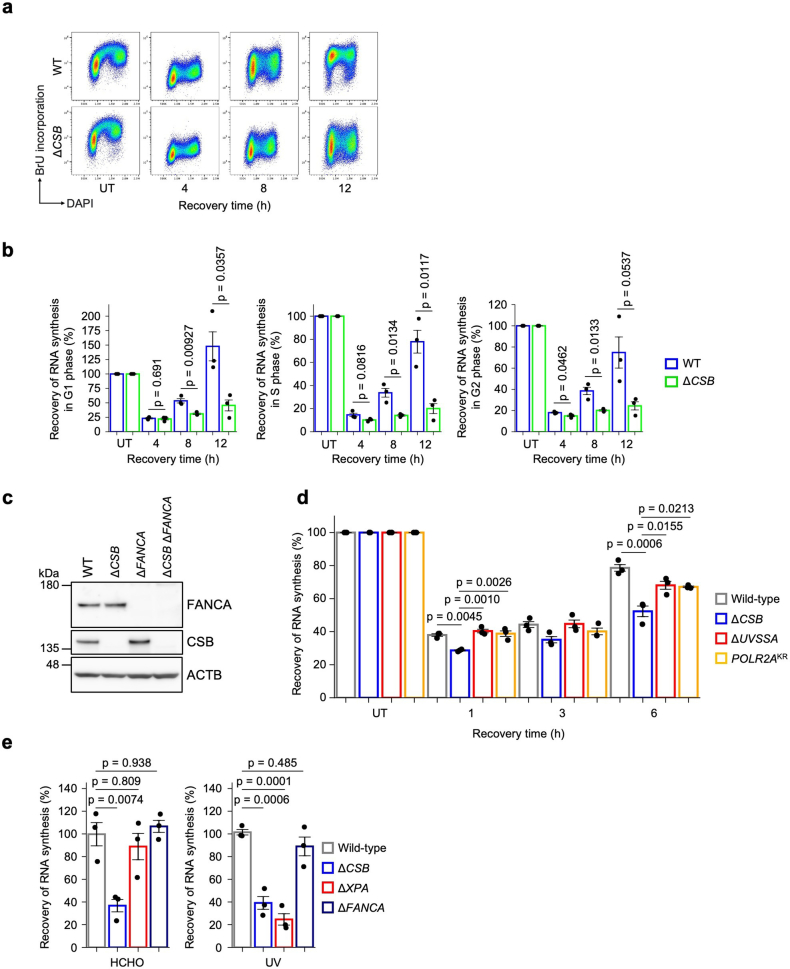
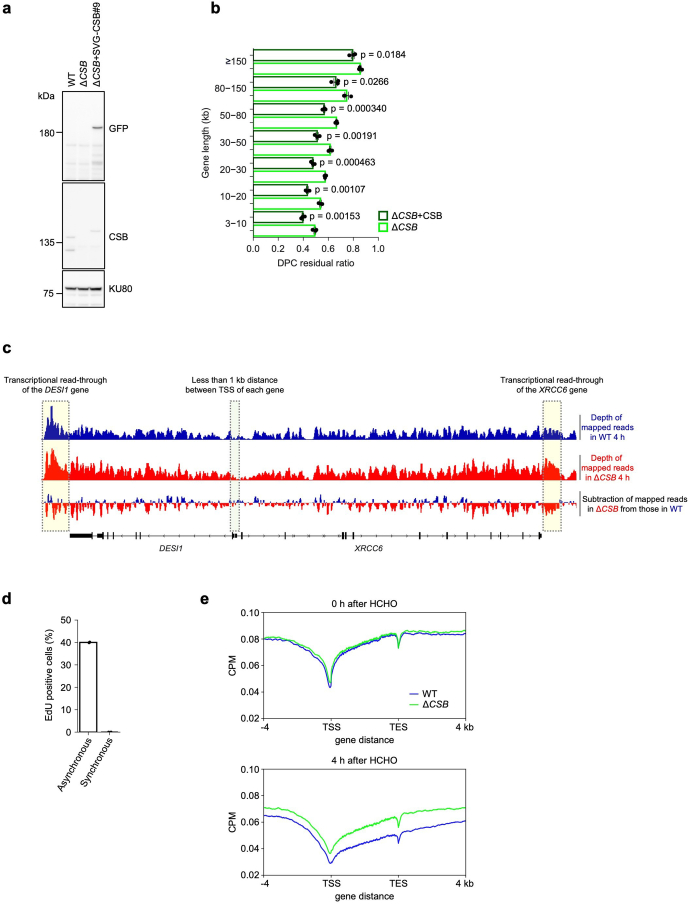
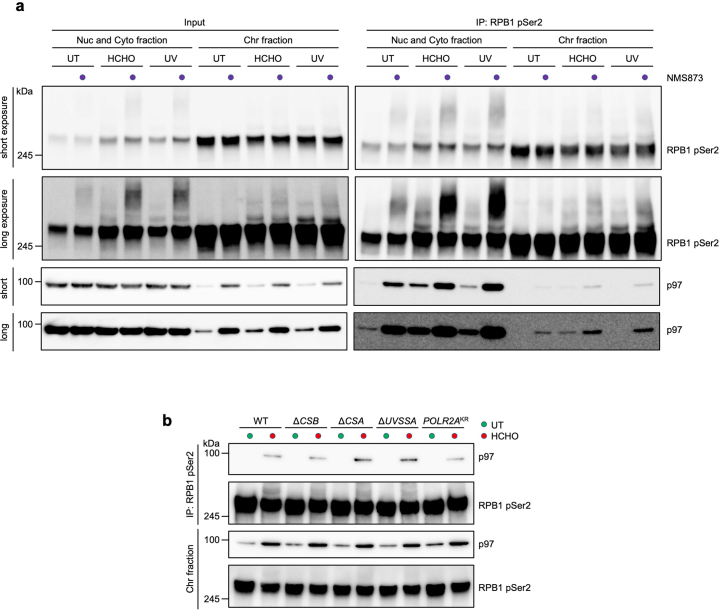
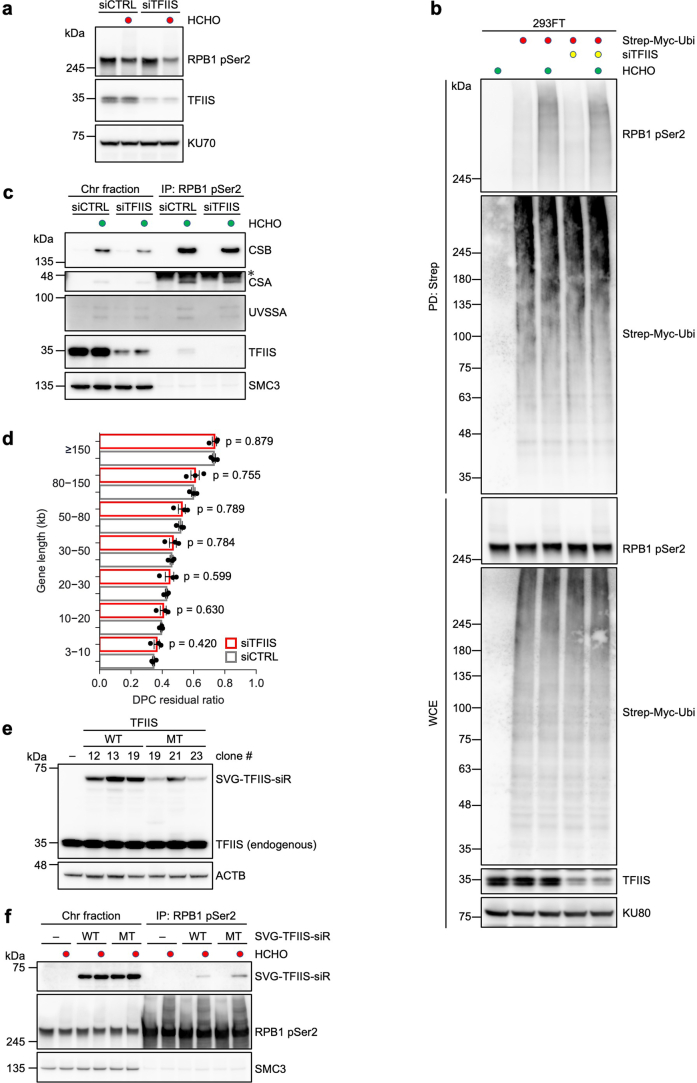
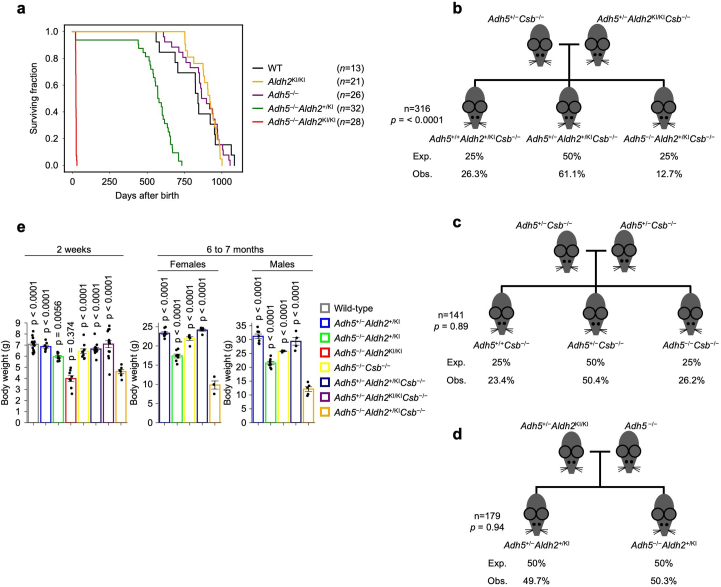
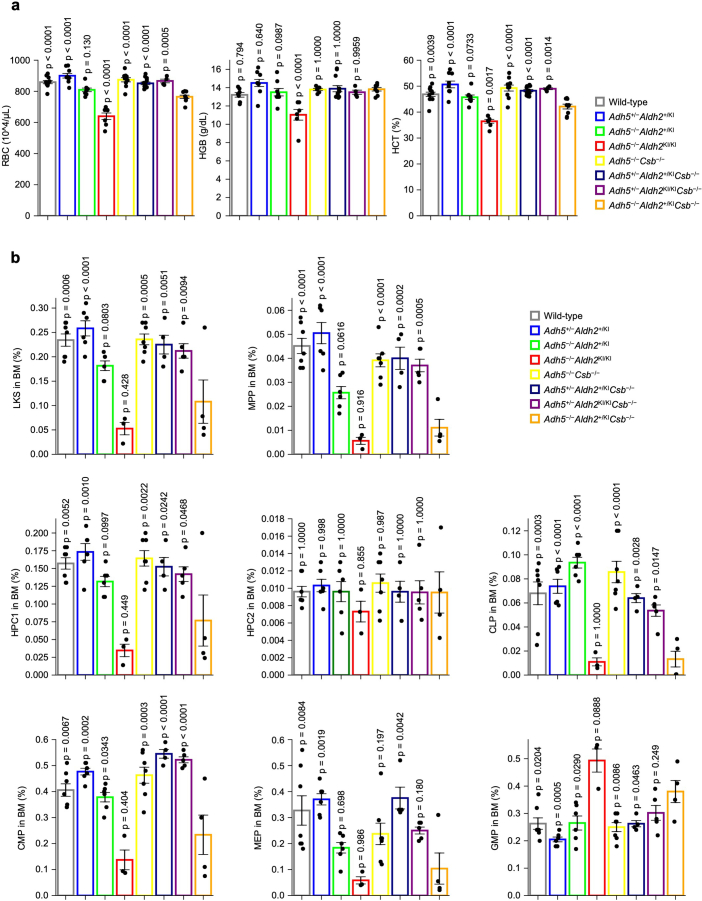
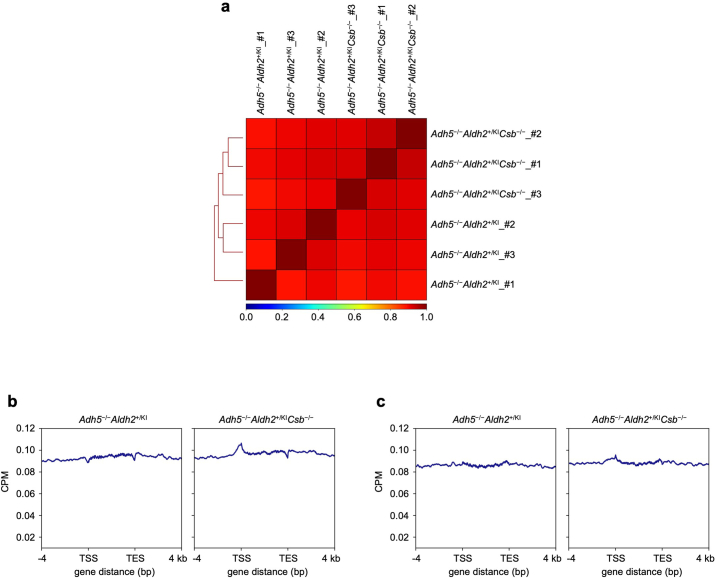
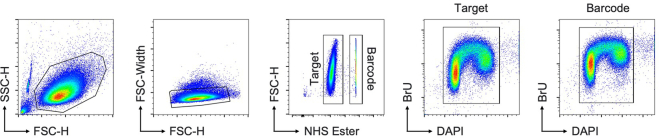
DNA-protein crosslinks (DPCs) induced by aldehydes interfere with replication and transcription. Hereditary deficiencies in DPC repair and aldehyde clearance processes cause progeria, including Ruijs-Aalfs syndrome (RJALS) and AMeD syndrome (AMeDS) in humans. Although the elimination of DPC during replication has been well established, how cells overcome DPC lesions in transcription remains elusive. Here we show that endogenous aldehyde-induced DPC roadblocks are efficiently resolved by transcription-coupled repair (TCR). We develop a high-throughput sequencing technique to measure the genome-wide distribution of DPCs (DPC-seq). Using proteomics and DPC-seq, we demonstrate that the conventional TCR complex as well as VCP/p97 and the proteasome are required for the removal of formaldehyde-induced DPCs. TFIIS-dependent cleavage of RNAPII transcripts protects against transcription obstacles. Finally, a mouse model lacking both aldehyde clearance and TCR confirms endogenous DPC accumulation in actively transcribed regions. Collectively, our data provide evidence that transcription-coupled DPC repair (TC-DPCR) as well as aldehyde clearance are crucial for protecting against metabolic genotoxin, thus explaining the molecular pathogenesis of AMeDS and other disorders associated with defects in TCR, such as Cockayne syndrome.


Conflict of interest statement

The authors declare no competing interests.

Figures

Fig. 1
Fig. 1. Formaldehyde-induced DPCs are removed from active genes.
a, Schematic representation of the experimental procedure for DPC-seq in cultured cells. b,c, Genome browser snapshot showing DPC-seq signals for HeLa cells treated with formaldehyde (HCHO) (b), and in the presence of DMSO, DRB or triptolide (c). d,e, Metagene profile and heatmap from DPC-seq within or near transcribed regions of genes with TPM ≥ 30 (d) and 0.1 ≤ TPM < 1 (e). CPM, counts per million mapped reads; TSS, transcription start site; TES, transcription end site. Data represent the average of three replicates. f, DPC residual ratios represent the proportions of sequence coverage of each gene in cells recovered for 4 h divided by that of cells not recovered after formaldehyde treatment, shown in four TPM bins. g, DPC residual ratios, shown in seven gene-length bins. Means (±s.e.m.) from three independent experiments are shown. Statistical significance was evaluated with Dunnett’s multiple comparison test. h, DPC residual ratios on regions including 1 kb downstream of the TSS and regions including 1 kb upstream of the TES, shown in seven gene-length bins. Means (±s.e.m.) from three independent experiments are shown. Two-sided unpaired t-test. Source numerical data are available as source data.
Fig. 2
Fig. 2. DPC repair by the TCR pathway.
a, Volcano plot of MS analyses illustrating the formaldehyde-induced protein interactions with elongating RNAPII. The plot displays the log2-fold change and significance (−log10(P value)) assessed by an unpaired two-sided t-test: permutation-based FDR < 0.05 (n = 3). Supplementary Table 1 provides the full results. b, Chromatin fractions of HeLa cells after formaldehyde treatment or UV irradiation were subjected to immunoprecipitation with anti-RPB1 CTD phospho-Ser2 antibodies, followed by immunoblotting with the indicated antibodies. The asterisk indicates non-specific bands. Experiments were independently replicated twice with consistent results. c, RRS after formaldehyde treatment in WT and ΔCSB HeLa cells. Cells were treated with 1,200 μM HCHO for 1 h, followed by 12-h incubation for recovery. Quantification of BrU incorporation is shown (means ± s.e.m.; n = 3 independent experiments). Two-sided unpaired t-test. d, RRS after formaldehyde treatment in the TCR- or FA- pathway-deficient HeLa cell lines. Cells were treated with 1,750 μM HCHO for 1 h, followed by 18-h incubation for recovery. The quantification of ethynyluridine (EU) incorporation is shown (means ± s.e.m.; n = 3 independent experiments). Dunnett’s multiple comparison test. e, Clonogenic survival of HeLa cell lines exposed to various doses of formaldehyde. Results from three independent experiments (mean ± s.e.m.) are shown. Dunnett’s multiple comparison test. f, Metagene profile from DPC-seq within or near transcribed regions of genes with TPM ≥ 30 at 0 and 4 h after formaldehyde washout in WT, ΔCSB and ΔCSB stably expressing CSB-WT HeLa cells. Data represent the average of three replicates. g, DPC residual ratios in WT or ΔCSB HeLa cells, shown in seven gene-length bins with TPM ≥ 100. Means (±s.e.m.) from three independent experiments are shown. Two-sided unpaired t-test. h, Metagene profile from DPC-seq within or near transcribed regions of genes with TPM ≥ 30 at 0 and 4 h after formaldehyde washout in WT, ΔUVSSA and POLR2AKR cells. Data represent the average of three replicates. i, DPC residual ratios in WT, ΔUVSSA and POLR2AKR cells are shown in seven gene-length bins with TPM ≥ 100. Means (±s.e.m.) from three independent experiments are shown. Two-sided unpaired t-test. Source numerical data and unprocessed blots are available in source data. Source data
Fig. 3
Fig. 3. DPC removal by VCP/p97 and the proteasome in active genes.
a, Volcano plot of MS analyses illustrating the interacting proteins with elongating RNAPII following formaldehyde treatment compared to UV irradiation. The plot displays the log2(fold change) and significance (−log10(P value)). Unpaired two-sided t-test. Permutation-based FDR < 0.05 (n = 3). Supplementary Table 2 provides the full results. b, Chromatin fractions of HeLa cells after formaldehyde treatment or UV irradiation were subjected to immunoprecipitation with anti-RPB1 CTD phospho-Ser2 antibodies, followed by immunoblotting with the indicated antibodies. Experiments were independently replicated twice with consistent results. c, Metagene profile from DPC-seq within or near transcribed regions of genes with TPM ≥ 30 at 0 and 4 h after formaldehyde washout in cells treated with VCP/p97 inhibitors. Data represent the average of two replicates. d, DPC residual ratios in cells treated with VCP/p97 inhibitors, shown in seven gene-length bins with TPM ≥ 100. Means (±s.e.m.) from three independent experiments are shown. Two-sided unpaired t-test. e, Metagene profile from DPC-seq within or near transcribed regions of genes with TPM ≥ 30 at 0 and 4 h after formaldehyde washout in HeLa cells treated with proteasome inhibitors. Data represent the average of three replicates. f, DPC residual ratios in cells treated with proteasome inhibitors are shown in seven gene-length bins with TPM ≥ 100. Means (±s.e.m.) from three independent experiments are shown. Two-sided unpaired t-test. g, Metagene profile from DPC-seq within or near transcribed regions of genes with TPM ≥ 30 at 0 and 4 h after formaldehyde washout in ΔCSB HeLa cells treated with the indicated inhibitors. Data represent the average of three replicates. h, DPC residual ratios in ΔCSB HeLa cells treated with the indicated inhibitors, shown in seven gene-length bins with TPM ≥ 100. Means (±s.e.m.) from three independent experiments are shown. Two-sided unpaired t-test. Source numerical data and unprocessed blots are available in the source data. Source data
Fig. 4
Fig. 4. Transcription-coupled removal of histone-DPC.
a, Schematic representation of the experimental procedure for histone-DPC-seq in cultured cells. b,c, Metagene profile from histone-DPC-seq within or near transcribed regions of genes with TPM ≥ 30 (b) and 0.1 ≤ TPM < 1 (c) at 0 and 4 h after formaldehyde washout in WT and ΔCSB HeLa cells. Data represent the average of three replicates. d, Histone-DPC residual ratios in WT or ΔCSB HeLa cells, shown in seven gene-length bins with TPM ≥ 100. Means (±s.e.m.) from three independent experiments are shown. Two-sided unpaired t-test. Source numerical data are available in the source data.
Fig. 5
Fig. 5. TFIIS protects against aldehyde-induced transcription stress.
a, Volcano plot of MS analyses illustrating the formaldehyde-induced protein interactions with TFIIS. The plot displays log2(fold change) and significance (−log10(P value)) assessed by unpaired two-sided t-test. Permutation-based FDR < 0.05 (n = 3). Supplementary Table 3 provides the full results. b, Chromatin fractions of WT and ΔCSB HeLa cells after formaldehyde treatment or UV irradiation were subjected to immunoprecipitation with anti-RPB1 CTD phospho-Ser2 antibodies, followed by immunoblotting with the indicated antibodies. Experiments were independently replicated twice with consistent results. c, HeLa cells transfected with non-targeting control (siCTRL) or TFIIS siRNAs (siTFIIS) were treated with formaldehyde or UV irradiation. Cell extracts were analysed by immunoblotting with the indicated antibodies. Experiments were independently replicated twice with consistent results. d, RRS after formaldehyde treatment or UV irradiation in WT and ΔCSB HeLa cells transfected with siCTRL or siTFIIS. Cells were treated with 1,000 μM HCHO for 1 h or irradiated with 8 J m−2 UV, followed by 13 h of incubation for recovery. Quantification of EU incorporation is shown (means ± s.e.m.; n = 3 independent experiments). Statistical significance was evaluated with a Tukey–Kramer multiple comparison test. e, Clonogenic survival of WT and ΔCSB HeLa cells transfected with siCTRL or siTFIIS exposed to various doses of formaldehyde or UV light. Results from three independent experiments (mean ± s.e.m.) are shown. Statistical significance was evaluated with a Tukey–Kramer multiple comparison test. f, HeLa cells stably expressing TFIIS-WT or TFIIS-MT transfected with the indicated siRNAs were treated or not with formaldehyde. Cell extracts were analysed by immunoblotting with the indicated antibodies. Experiments were independently replicated twice with consistent results. Source numerical data and unprocessed blots are available in the source data. Source data
Fig. 6
Fig. 6. TCR is required for the removal of DPCs in mice.
a, In vivo DPC-seq: schematic representation of the experimental procedure for the measurement of endogenous aldehyde-induced DPCs in mice. b, Quantification of DPCs in lineage-depleted bone marrow cells from WT and AMeDS model mice (means ± s.e.m.; n = 4 for wild-type, n = 3 for Adh5−/−Aldh2KI/KI). Two-sided unpaired t-test. c, Kaplan–Meier curves with log-rank test show a significant decrease in the survival of Adh5−/−Aldh2+/KICsb−/− animals compared to Adh5−/−Aldh2+/KI or Adh5−/−Csb−/− animals (P < 0.0001). d, Quantification of HSCs (Linc-Kit+Sca-1+CD150+CD48) in the indicated genotype animals (means ± s.e.m.; n = 7 for wild-type, n = 6 for Adh5+/−Aldh2+/KI, n = 6 for Adh5−/−Aldh2+/KI, n = 3 for Adh5−/−Aldh2KI/KI, n = 7 for Adh5−/−Csb−/−, n = 4 for Adh5+/−Aldh2+/KICsb−/−, n = 5 for Adh5+/−Aldh2KI/KICsb−/−, n = 4 for Adh5−/−Aldh2+/KICsb−/−). Statistical significance was evaluated with Dunnett’s multiple comparison test. P compared to Adh5−/−Aldh2+/KICsb−/− mice. BM, bone marrow. e, Metagene profile from DPC-seq within or near transcribed regions of genes with TPM ≥ 30 (left) and 0.01 ≤ TPM < 0.1 (right). Data represent the average of three mice. f, DPC-seq read counts (reads per gene length per million) are shown in six TPM bins (left) and in seven gene-length bins (right). Means (±s.e.m.) from three mice are shown. Two-sided unpaired t-test. Source numerical data are available in the source data.
Extended Data Fig. 1
Extended Data Fig. 1. Formaldehyde treatment blocks transcription.
(a) 5′-bromo-uridine (BrU) incorporation in HeLa cells treated with various concentration of formaldehyde (HCHO) was measured by FACS analysis. Data represent the three independent experiments. (b) Quantification of data in (a). Means (±s.e.m.) from three independent experiments are shown. Statistical significance was evaluated with Dunnett’s multiple comparison test. (c) Genome browser snapshot showing DPC-seq signals for HeLa cells treated with formaldehyde within a ribosomal DNA unit. IGS: intergenic spacer; ETS: external transcribed spacer. (d) BrU incorporation in HeLa cells treated with DMSO, DRB or triptolide was measured by FACS analysis. Data represent the two independent experiments. (e) Quantification of data in (d). Means from two independent experiments are shown. (f) A hierarchically clustered heatmap showing Spearman’ rank correlation coefficients of DPC-seq signal intensities (CPM) between three replicates in HeLa cells treated with DMSO, DRB or triptolide. (g and h) Metagene profile and heatmap from input samples within and near transcribed regions of genes with TPM ≥ 30 (g) and 0.1 ≤ TPM < 1 (h). TSS: transcription start site; TES: transcription end site. n = 1. Source numerical data are available in source data.
Extended Data Fig. 2
Extended Data Fig. 2. CSB-dependent ubiquitination signaling is activated in response to formaldehyde treatment.
(a) Whole cell extracts of WT, ΔCSB and POLR2AKR HeLa cells after formaldehyde treatment or UV irradiation were analysed by immunoblotting with indicated antibodies. Experiments were independently replicated twice with consistent results. (b) Volcano plot of mass spectrometry analyses illustrating the UV-induced interaction of elongating RNAPII. Chromatin fractions of HeLa WT cells after UV irradiation (UV) or untreated (UT) were subjected to immunoprecipitation with anti-RPB1 CTD phospho-Ser2 antibodies followed by mass spectrometric analysis. The plot displays the log2 fold change and the significance (-log10(P-value)) assessed by unpaired two-sided t test: permutation-based FDR < 0.05 (n = 3). Selected prospective elongating RNAPII interactors are highlighted. See Supplementary Table 4 for full results. (c) Volcano plot of mass spectrometry analyses illustrating the CSB-dependent formaldehyde-induced interaction of elongating RNAPII. Chromatin fractions of HeLa WT and ΔCSB cells after formaldehyde treatment were subjected to immunoprecipitation with anti-RPB1 CTD phospho-Ser2 antibodies followed by mass spectrometric analysis. The plot displays the log2 fold change and the significance (-log10(P-value)) assessed by unpaired two-sided t test: permutation-based FDR < 0.05 (n = 3). Selected prospective elongating RNAPII interactors are highlighted. See Supplementary Table 5 for full results. (d) Volcano plot of mass spectrometry analyses illustrating the CSB-dependent UV-induced interaction of elongating RNAPII. Chromatin fractions of HeLa WT and ΔCSB cells after UV irradiation were subjected to immunoprecipitation with anti-RPB1 CTD phospho-Ser2 antibodies followed by mass spectrometric analysis. The plot displays the log2 fold change and the significance (-log10(P-value)) assessed by a permutation-based t-test (n = 3). Selected prospective elongating RNAPII interactors are highlighted. See Supplementary Table 6 for full results. (e) Chromatin fractions of WT, ΔCSB, ΔUVSSA and POLR2AKR HeLa cells after formaldehyde treatment were subjected to immunoprecipitation with anti-RPB1 phospho-Ser2 antibodies followed by immunoblotting with indicated antibodies. * indicates non-specific bands. Experiments were independently replicated twice with consistent results. Unprocessed blots are available in source data. Source data
Extended Data Fig. 3
Extended Data Fig. 3. CSB-dependent TCR initiation signaling is required for RRS.
(a) RRS after formaldehyde treatment in WT and ΔCSB cells. BrU incorporation in HeLa WT and ΔCSB cells treated with formaldehyde was measured by FACS analysis. Data represent the three independent experiments. (b) Quantification of BrU incorporation in G1, S and G2 phase is shown (means ± s.e.m.; n = 3 independent experiments). Two-sided unpaired t-test. (c) Cell extracts from HeLa WT, ΔCSB, ΔFANCA and ΔCSB ΔFANCA cells were analysed by immunoblotting with indicated antibodies. Experiments were independently replicated twice with consistent results. (d) RRS after formaldehyde treatment in HeLa WT, ΔCSB, ΔUVSSA, POLR2AKR cells. Cells were treated with 500 μM HCHO for 1 h followed by recovered at the indicated time points. Quantification of 5-ethynyluridine (EU) incorporation is shown (means ± s.e.m.; n = 3 independent experiments). Statistical significance was evaluated with Tukey–Kramer multiple comparison test. (e) RRS after formaldehyde treatment or UV irradiation in HeLa WT, ΔCSB, ΔXPA and ΔFANCA cells. Cells were treated with 1750 μM HCHO for 1 h followed by 18 h incubation, or irradiated with 6 J/m2 UV followed by 12 h incubation for RNA synthesis recovery. Quantification of EU incorporation is shown (means ± s.e.m.; n = 3 independent experiments). Statistical significance was evaluated with Dunnett’s multiple comparison test. Source numerical data and unprocessed blots are available in source data. Source data
Extended Data Fig. 4
Extended Data Fig. 4. CSB-dependent DPC repair.
(a) Extracts of HeLa WT, ΔCSB and ΔCSB stably expressing Strep-V5-EGFP (SVG)-CSB-WT were analysed by immunoblotting with indicated antibodies. Experiments were independently replicated twice with consistent results. (b) DPC residual ratios in HeLa ΔCSB and ΔCSB stably expressing CSB-WT cells are shown in seven gene length bins with TPM ≥ 100. Means (±s.e.m.) from three independent experiments are shown. Two-sided unpaired t-test. (c) Genome browser snapshot showing DPC-seq signals for HeLa WT and ΔCSB cells treated with formaldehyde. (d) EdU incorporation in HeLa cells synchronised by a double thymidine followed by nocodazole block and release protocol. Data represent the two independent experiments. (e) Metagene profile from DPC-seq within or near transcribed regions of genes with TPM ≥ 30 at 0 and 4 h after formaldehyde washout in WT and ΔCSB HeLa cells synchronised by a double thymidine followed by nocodazole block and release protocol. Data represent the average of three replicates. Source numerical data and unprocessed blots are available in source data. Source data
Extended Data Fig. 5
Extended Data Fig. 5. The role of VCP/p97 in response to formaldehyde-induced DNA damage.
(a) HeLa cell extracts fractionated into nuclear/cytoplasm (Nuc/Cyto) and chromatin after formaldehyde treatment or UV irradiation were subjected to immunoprecipitation with anti-RPB1 CTD phospho-Ser2 antibodies followed by immunoblotting with indicated antibodies (n = 1). (b) Chromatin fractions of HeLa WT, ΔCSB, ΔCSA, ΔUVSSA and POLR2AKR cells after formaldehyde treatment or UV irradiation were subjected to immunoprecipitation with anti-RPB1 CTD phospho-Ser2 antibodies followed by immunoblotting with indicated antibodies. Experiments were independently replicated twice with consistent results. Unprocessed blots are available in source data. Source data
Extended Data Fig. 6
Extended Data Fig. 6. TFIIS is required for safeguard against formaldehyde-induced transcription stress.
(a) Whole cell extracts of HeLa WT cells transfected with non-targeting control (siCTRL) or TFIIS siRNAs (siTFIIS) were treated with formaldehyde. Cell extracts were analysed by immunoblotting with indicated antibodies. Experiments were independently replicated twice with consistent results. (b) 293FT cells transfected with siCTRL or siTFIIS were transfected with Strep-Myc-Ubiquitin (Ubi). Whole cell extracts were subjected to Strep-Tactin pull-down followed by immunoblotting with indicated antibodies. Experiments were independently replicated twice with consistent results. (c) Chromatin fractions of HeLa cells transfected with siCTRL or siTFIIS were subjected to immunoprecipitation with anti-RPB1 CTD phospho-Ser2 antibodies followed by immunoblotting with indicated antibodies (n = 1). * indicates non-specific bands. (d) DPC residual ratios in HeLa WT cells transfected with siCTRL or siTFIIS are shown in seven gene length bins with TPM ≥ 100. Means (±s.e.m.) from three independent experiments are shown. Two-sided unpaired t-test. (e) Whole cell extracts of HeLa cells stably expressing TFIIS-WT or TFIIS-MT (D282A and E283A) were analysed by immunoblotting with indicated antibodies (n = 1). (f) Chromatin fractions of HeLa cells stably expressing TFIIS-WT or TFIIS-MT treated or not with formaldehyde were subjected to immunoprecipitation with anti-RPB1 CTD phospho-Ser2 antibodies followed by immunoblotting with indicated antibodies. Experiments were independently replicated twice with consistent results. Source numerical data and unprocessed blots are available in source data. Source data
Extended Data Fig. 7
Extended Data Fig. 7. Loss of Csb exacerbates the phenotypes of aldehyde metabolism-deficient AMeDS mice.
(a) Kaplan-Meier curves with log-rank test (partially adapted from Oka et al.) show a significant decrease in survival of Adh5−/−Aldh2+/KI or Adh5−/−Aldh2KI/KI AMeDS animal compared to WT mice (p < 0.0001 or p < 0.0001, respectively). (b) Observed and expected frequencies of mice at 2 weeks of age from intercrossed Adh5+/−Csb−/− mice with Adh5+/−Aldh2KI/KICsb−/− mice. One-sided chi-square test shows significant difference between observed and expected (p < 0.0001). (c) Observed and expected frequencies of mice at 2 weeks of age from intercrossed between Adh5+/−Csb−/− mice. One-sided chi-square test shows no significant difference between observed and expected (p = 0.89). (d) Observed and expected frequencies of mice at 2 weeks of age from intercrossed of Adh5−/− mice with Adh5+/−Aldh2KI/KI mice. Chi-square test shows no significant difference between observed and expected (p = 0.94). (e) Body weights of individual mice at 2 weeks of age (means ± s.e.m.; n = 18 for wild-type, n = 7 for Adh5+/−Aldh2+/KI, n = 8 for Adh5−/−Aldh2+/KI, n = 8 for Adh5−/−Aldh2KI/KI, n = 9 for Adh5−/−Csb−/−, n = 12 for Adh5+/−Aldh2+/KICsb−/−, n = 14 for Adh5+/−Aldh2KI/KICsb−/−, n = 6 for Adh5−/−Aldh2+/KICsb−/−), female mice at 6 to 7 months of age (means ± s.e.m.; n = 8 for Adh5+/−Aldh2+/KI, n = 7 for Adh5−/−Aldh2+/KI, n = 5 for Adh5−/−Csb−/−, n = 5 for Adh5+/−Aldh2+/KICsb−/−, n = 3 for Adh5−/−Aldh2+/KICsb−/−), and male mice at 6 to 7 months of age (means ± s.e.m.; n = 7 for Adh5+/−Aldh2+/KI, n = 8 for Adh5−/−Aldh2+/KI, n = 4 for Adh5−/−Csb−/−, n = 4 for Adh5+/−Aldh2+/KICsb−/−, n = 5 for Adh5−/−Aldh2+/KICsb−/−). Statistical significance was evaluated with Dunnett’s multiple comparison test. P compared to Adh5−/−Aldh2+/KICsb−/− mice. Source numerical data are available in source data.
Extended Data Fig. 8
Extended Data Fig. 8. Loss of Csb exacerbates abnormal hematopoiesis in aldehyde metabolism-deficient AMeDS mice.
(a) Red blood cell (RBC), hemoglobin concentration (HGB), hematocrit (HCT), in peripheral blood at 3 to 4 weeks of age were analysed. (mean ± s.e.m., RBC and HCT: n = 11 for wild-type, n = 9 for Adh5+/−Aldh2+/KI, n = 8 for Adh5−/−Aldh2+/KI, n = 7 for Adh5−/−Aldh2KI/KI, n = 10 for Adh5−/−Csb−/−, n = 13 for Adh5+/−Aldh2+/KICsb−/−, n = 4 for Adh5+/−Aldh2KI/KICsb−/−, n = 9 for Adh5−/−Aldh2+/KICsb−/−, HGB: n = 7 for wild-type, n = 9 for Adh5+/−Aldh2+/KI, n = 8 for Adh5−/−Aldh2+/KI, n = 6 for Adh5−/−Aldh2KI/KI, n = 6 for Adh5−/−Csb−/−, n = 12 for Adh5+/−Aldh2+/KICsb−/−, n = 4 for Adh5+/−Aldh2KI/KICsb−/−, n = 8 for Adh5−/−Aldh2+/KICsb−/−). Statistical significance was evaluated with Dunnett’s multiple comparison test. P compared to Adh5−/−Aldh2+/KICsb−/− mice. (b) Quantification of hematopoietic subset: LKS (Linc-Kit+Sca-1+), MPP (Linc-Kit+Sca-1+CD150CD48), HPC1 (Linc-Kit+Sca-1+CD150CD48+), HPC2 (Linc-Kit+Sca-1+CD150+CD48+), CLP (Linc-KitlowSca-1lowCD127+CD135+), CMP (Linc-Kit+Sca-1CD34+CD16/32), MEP (Linc-Kit+Sca-1CD34CD16/32), and GMP (Linc-Kit+Sca-1CD34+CD16/32+) in mice at 3 to 4 weeks of age is shown (means ± s.e.m.; n = 7 for wild-type, n = 6 for Adh5+/−Aldh2+/KI, n = 6 for Adh5−/−Aldh2+/KI, n = 3 for Adh5−/−Aldh2KI/KI, n = 7 for Adh5−/−Csb−/−, n = 4 for Adh5+/−Aldh2+/KICsb−/−, n = 5 for Adh5+/−Aldh2KI/KICsb−/−, n = 4 for Adh5−/−Aldh2+/KICsb−/−). Statistical significance was evaluated with Dunnett’s multiple comparison test. P compared to Adh5−/−Aldh2+/KICsb−/− mice. Source numerical data are available in source data.
Extended Data Fig. 9
Extended Data Fig. 9. DPC-seq in mice.
(a) A hierarchically clustered heatmap showing Spearman’s rank-correlation coefficients of DPC-seq signal intensities (CPM) between Adh5–/–Aldh2+/KI and Adh5–/–Aldh2+/KICsb–/– mice. (b and c) Metagene profile from input samples around the transcribed regions of genes with TPM ≥ 30 (b) and 0.01 ≤ TPM < 0.1 (c). TSS: transcription start site; TES: transcription end site. Data represent the average of two mice.
Extended Data Fig. 10
Extended Data Fig. 10. A FACS gating strategy.
A flow cytometry gating strategy is described in the Methods section.

References

    1. Lans H, Hoeijmakers JHJ, Vermeulen W, Marteijn JA. The DNA damage response to transcription stress. Nat. Rev. Mol. Cell Biol. 2019;20:766–784. doi: 10.1038/s41580-019-0169-4. - DOI - PubMed
    1. van den Heuvel D, et al. Repair: from mechanism to human disorder. Trends Cell Biol. 2021;31:359–371. doi: 10.1016/j.tcb.2021.02.007. - DOI - PubMed
    1. Jia N, et al. Dealing with transcription-blocking DNA damage: repair mechanisms, RNA polymerase II processing and human disorders. DNA Repair. 2021;106:103192. doi: 10.1016/j.dnarep.2021.103192. - DOI - PubMed
    1. Zhang L, et al. Formaldehyde and leukemia: epidemiology, potential mechanisms and implications for risk assessment. Environ. Mol. Mutagen. 2010;51:181–191. doi: 10.1002/em.20534. - DOI - PMC - PubMed
    1. Heck HD, et al. Formaldehyde (CH2O) concentrations in the blood of humans and Fischer-344 rats exposed to CH2O under controlled conditions. Am. Ind. Hyg. Assoc. J. 1985;46:1–3. doi: 10.1080/15298668591394275. - DOI - PubMed

Publication types

MeSH terms