. 2024 May;26(5):797-810.
doi: 10.1038/s41556-024-01391-1. Epub 2024 Apr 10.

Transcription-coupled repair of DNA-protein cross-links depends on CSA and CSB

Affiliations

Transcription-coupled repair of DNA-protein cross-links depends on CSA and CSB

Christopher J Carnie et al. Nat Cell Biol. 2024 May.

Abstract

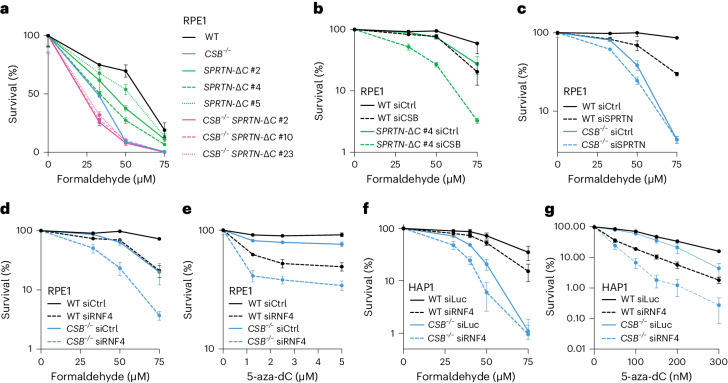
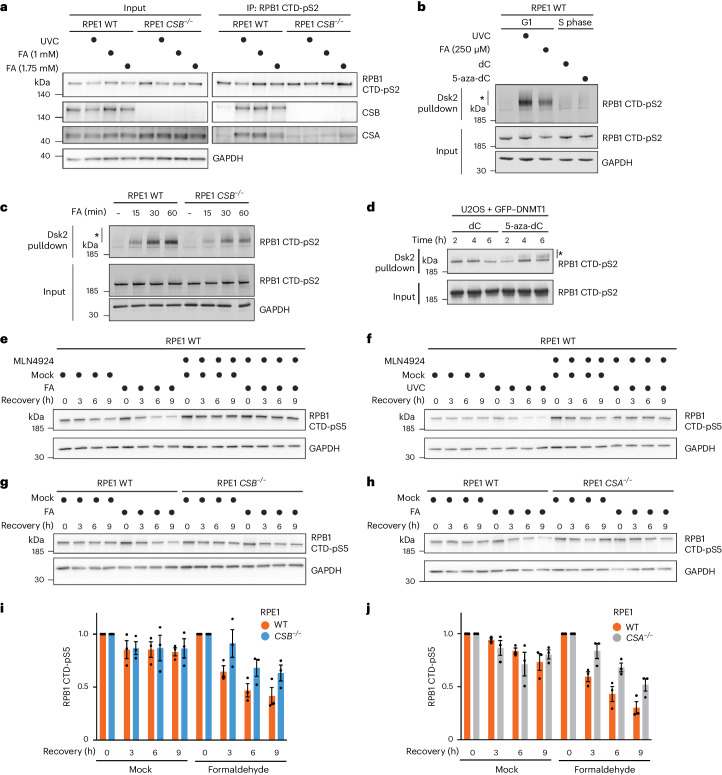
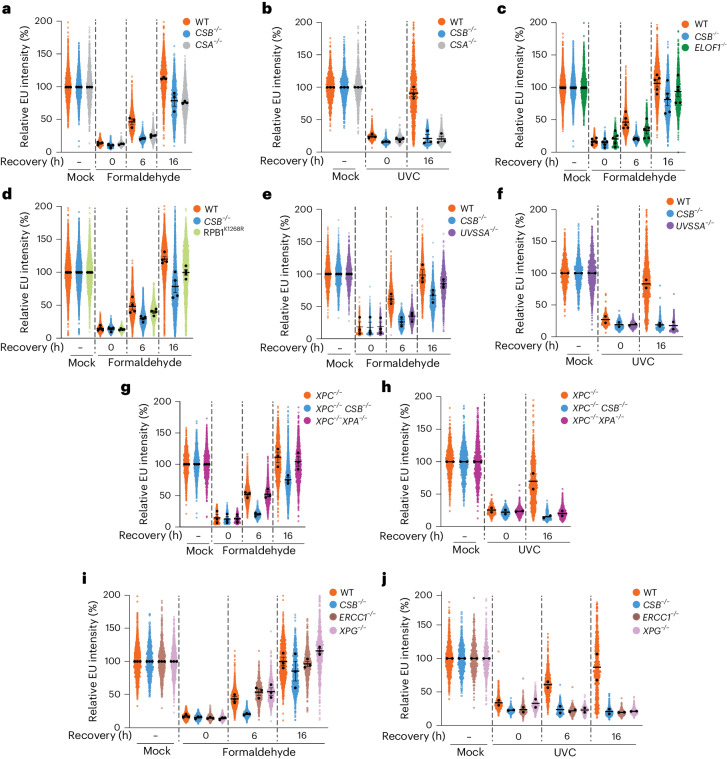
Covalent DNA-protein cross-links (DPCs) are toxic DNA lesions that block replication and require repair by multiple pathways. Whether transcription blockage contributes to the toxicity of DPCs and how cells respond when RNA polymerases stall at DPCs is unknown. Here we find that DPC formation arrests transcription and induces ubiquitylation and degradation of RNA polymerase II. Using genetic screens and a method for the genome-wide mapping of DNA-protein adducts, DPC sequencing, we discover that Cockayne syndrome (CS) proteins CSB and CSA provide resistance to DPC-inducing agents by promoting DPC repair in actively transcribed genes. Consequently, CSB- or CSA-deficient cells fail to efficiently restart transcription after induction of DPCs. In contrast, nucleotide excision repair factors that act downstream of CSB and CSA at ultraviolet light-induced DNA lesions are dispensable. Our study describes a transcription-coupled DPC repair pathway and suggests that defects in this pathway may contribute to the unique neurological features of CS.


Conflict of interest statement

S.B. is a founder and shareholder of Biomodal Ltd., Inflex Ltd. and RNAvate Ltd. L.M. is a consultant for Inflex Ltd. S.P.J works part time as Chief Research Officer at Insmed Innovation UK Ltd. S.P.J is a founding partner of Ahren Innovation Capital LLP and is co-founder, a board member and Chair of the Scientific Advisory Board of Mission Therapeutics Ltd. S.P.J. is a consultant and shareholder of Inflex Ltd. The authors declare no other competing interests.

Figures

Fig. 1
Fig. 1. ERCC6/CSB mediates cellular tolerance of DPCs.
a, Schematic of formaldehyde (FA) and 5-aza-dC CRISPRi screens compared to non-treated conditions (NT) in K562 cells. b, Rank plot showing normalized Z-scores (NormZ) scores from DrugZ analysis and selected hits from the formaldehyde CRISPRi screen in a. c, The same as for b but for the 5-aza-dC CRISPRi screen. d,e, Clonogenic survival assays in WT, CSB−/− and XPA−/− HAP1 cells treated with formaldehyde (d) or 5-aza-dC (e). Error bars ± s.e.m., n = 4 replicates. f, Doxycycline (dox)-inducible expression of CSB or CSBK538R in CSB−/− TET3G HAP1 cells; representative of three independent experiments. gi, Clonogenic survival assays in WT or CSB−/− TET3G cells with doxycycline-induced expression of CSB, CSBK538R or the empty vector (EV) treated with formaldehyde (g), 5-aza-dC (h) or illudin S (i). Symbols and error bars denote mean ± s.e.m., n = 3 replicates. jl, Alamar blue cell viability assays in the indicated RPE1 cell lines treated with formaldehyde (j), 5-aza-dC (k) or illudin S (l). Symbols and error bars denote mean ± s.d., n = 3 replicates. Source numerical data and unprocessed blots are available in Source data. Source data
Fig. 2
Fig. 2. CSB acts in parallel to known DPC repair pathways in promoting DPC tolerance.
a, Alamar blue cell viability assays with the indicated CSB- and SPRTN-deficient RPE1 cell line clones treated with formaldehyde. b,c, Alamar blue assays with the indicated cell lines treated with formaldehyde after siCSB or a non-targeting siRNA control (siCtrl) in WT versus SPRTN-ΔC cells (b) or siSPRTN in WT versus CSB−/− RPE1 cells (c). d,e, Alamar blue assays in the WT versus CSB−/− RPE1 cells upon RNF4 depletion, treated with formaldehyde (d) or 5-aza-dC (e). In ae, symbols and error bars denote mean ± s.d., n = 3 replicates. f,g, Clonogenic survival assays in WT or CSB−/− HAP1 cells upon siRNA-mediated depletion of RNF4, treated with formaldehyde (f) or 5-aza-dC (g). Symbols and error bars denote mean ± s.e.m., n = 3 replicates. Source numerical data are available in Source data.
Fig. 3
Fig. 3. CSB initiates a pathway that supports transcription recovery following DPC induction.
a, Immunoprecipitation (IP) of chromatin-bound elongating RNAPII (RPB1 CTD-pS2) following treatment with UVC or formaldehyde (FA) at the indicated doses, representative of three independent experiments. b, Dsk2 pulldown of ubiquitylated proteins from RPE1 cells synchronized in G1 by serum starvation and treated with UVC or FA, or from cells released from a thymidine block into S-phase in the presence of deoxycytidine (dC) or 5-aza-dC, representative of three independent experiments. c, Dsk2 pulldown in WT and CSB−/− RPE1 cells synchronized in G1 by serum starvation and treated with 250 µM FA for the indicated times, representative of four independent experiments. d, Dsk2 pulldown in U2OS GFP–DNMT1 cells released from a single thymidine block into dC or 5-aza-dC for the indicated times, representative of three independent experiments. e,f, RPB1 degradation in cycloheximide-treated RPE1 cells following formaldehyde (e) or UVC (f) treatment in the presence or absence of MLN4924, an inhibitor of Cullin-dependent ubiquitylation, representative of three independent experiments. g,h, RPB1 degradation in cycloheximide-treated WT and CSB−/− (g) or CSA−/− (h) RPE1 cells at the indicated timepoints after a pulsed FA treatment. For g and h, GAPDH blot images are also shown alongside blots in Extended Data Fig. 3j,k, respectively, due to detection of RPB1 CTD-pS2 and RPB1 CTD-pS5 from the same experiment. i,j, Quantification of g and h, respectively; error bars ± s.e.m., n = 3 replicates. In bd, *denotes polyubiquitylated RPB1 CTD-pS2. Source numerical data and unprocessed blots are available in Source data. Source data
Fig. 4
Fig. 4. CSB supports transcription recovery following DPC induction.
ac, Quantification of recovery of RNA synthesis (RRS) assays paired with NPM1 staining to enable stratified quantification of relative EU intensity in nuclear (a), nucleolar (b) and nucleoplasmic (c) regions in WT or CSB/ cells treated with formaldehyde and released into fresh medium for the indicated times. Error bars ± s.e.m., n = 3 replicates. d, Representative images from RRS assays in ac. Scale bars, 10 µm. e, RT–qPCR for the indicated targets normalized to a chicken spike-in mRNA in WT or CSB/ cells treated with formaldehyde and released into fresh medium for 6 h. Values were normalized to transcript levels in untreated conditions. Error bars ± s.e.m., n = 3 replicates. *P < 0.05 based on multiple two-sided Mann–Whitney tests; P = 0.029 (SIRT1), P = 0.029 (TBP), P = 0.029 (EXO1) and P = 0.029 (ERCC4). f, Western blot analysis of hyperphosphorylated (elongating) and hypophosphorylated (initiating) RPB1, denoted by asterisk and hash symbol, respectively, upon formaldehyde treatment for the indicated timepoints, representative of three independent experiments. g, Western blot analysis of ATF3 induction and degradation in WT or CSB/ RPE1 cells upon treatment with formaldehyde for the indicated times, or with UVC and allowed to recover for 24 h, representative of three independent experiments. h, Nascent RNA-seq heat maps of 3–100 kb genes in WT and CSB/ cells treated with formaldehyde and released for 9 h. i, An example genome browser plot from h of the MAP3K14 locus. j, Metagene profiles of normalized (Norm.) read counts from h of genes 25–50 kb, 50–100 kb and >100 kb in length, shown in full (left), ±5 kb around the TSS (centre) or beginning from 5 kb into the gene body (right). Source numerical data and unprocessed blots are available in Source data. Source data
Fig. 5
Fig. 5. Upstream TC-NER factors support transcription recovery after DPC induction.
a,b, RRS assays in WT, CSB−/− or CSA−/− RPE1 cells treated with formaldehyde (a) or UVC (b) and released for the indicated times. c, The same as for a but with WT, CSB/ and ELOF1/ RPE1 cells. d, The same as for a but with WT, CSB/ and RPB1K1268R HeLa cells. e,f, The same as for a and b but with WT, CSB−/− and UVSSA−/− RPE1 cells. g,h, The same as for a and b but with XPC−/−, XPC−/−/CSB−/− and XPC−/−/XPA−/− RPE1 cells. i,j, The same as for a and b but with WT, CSB−/−, ERCC1−/− and XPG−/− RPE1 cells. Mean intensities of replicates (n = 3 for a, b, e, g and i; n = 5 for c; and n = 4 for d) are displayed as black dots with a mean of those averages shown, error bars ± s.e.m. For f, h and j, n = 2 and mean intensities of individual replicates are shown as black dots and the mean of those values is shown as a black line. Note that for c, data from WT and CSB−/− cells are shared with some replicates from other images shown in this figure. Source numerical data are available in Source data.
Fig. 6
Fig. 6. DPC-seq enables genome-wide mapping of DPC induction and resolution.
a, An overview of the DPC-seq methodology. Cultured cells are treated with 1.75 mM formaldehyde for 1 h then either collected or released for 6 h to recover. Cells are lysed with SDS buffer and sonicated. DPC DNA is then precipitated with high KCl and purified. b, Metagene profile of DPC-seq in formaldehyde-treated RPE1 cells with or without 6 h recovery, coverage calculated as reads per million (RPM) with the TSS and TES (transcription end site) indicated. c, A genome browser plot showing DPC-seq coverage at a specific region of chromosome 6 with RPB1 ChIP-seq coverage added for comparison (GEO: GSE141798). d, DPC-seq coverage per gene, with or without 6 h recovery after treatment, in genes with low, medium or high DNA accessibility as determined by ATAC-seq (GEO: GSE209659). Statistics via paired two-sided Wilcoxon test. ***P < 0.001; P values are P < 2.2 × 10−16, P < 2.2 × 10−16 and P < 2.2 × 10−16 for 0 h versus 6 h recovery in low-, medium- or high-accessibility, respectively. The box plot shows upper (Q3) and lower (Q1) quartile boundaries and line at the median. Lower whisker (minimum) is Q1 – 1.5 × interquartile range (IQR) and upper whisker (maximum) is Q3 + 1.5 × IQR. e, DPC-seq coverage per gene in samples recovered for 6 h after formaldehyde treatment versus non-recovered samples, coloured by RNAPII occupancy. f, Log2 fold change of DPC-seq coverage per gene 6 h/0 h after FA treatment, with or without flavopiridol treatment, in genes grouped by RNAPII occupancy. Statistics via paired two-sided Wilcoxon test. *P < 0.05, **P < 0.01 and ***P < 0.001; P values are 0.9809, 0.03714, <2.2 × 10−16 and <2.2 × 10−16 for comparisons in low, mid-low, mid-high and high transcriptional activity gene sets, respectively. The box plot shows upper (Q3) and lower (Q1) quartile boundaries and the line at the median. The lower whisker (minimum) is Q1 – 1.5 × IQR) and the upper whisker (maximum) is Q3 + 1.5 × IQR. g, DPC-seq coverage per gene 6 h after formaldehyde treatment in WT RPE1 cells that are either not treated (NT) or treated with flavopiridol. Green highlights genes with significantly higher DPC coverage in flavopiridol-treated cells, indicating they undergo transcription-dependent DPC repair. h, Per gene RNAPII occupancy versus DNA accessibility, as determined via ATAC-seq in RPE1 cells (GEO: GSE209659). i, The same as g but only showing genes that show transcription-dependent DPC repair (as defined in g) and a group of matched size that do not show transcription-dependent repair, including the percentage of each group that are present in the shown quadrants. For all DPC-seq analyses, n = 3 biological replicates.
Fig. 7
Fig. 7. CSB is required for the repair of DPCs at transcriptionally active loci.
a, DPC-seq coverage per gene in WT RPE1 cells versus CSB−/− cells 6 h after formaldehyde treatment. Blue highlights genes with significantly higher DPC coverage in CSB−/− cells, indicating they undergo CSB-dependent DPC repair. b, Metagene profile of DPC-seq coverage in WT versus CSB−/− RPE1 cells treated with formaldehyde and with or without 6 h recovery. Metagene specifically shows CSB-dependent genes from a. c, The same as b but showing log2-fold change coverage for CSB−/−/WT RPE1 cells with or without 6 h recovery after formaldehyde treatment. d, The level of different genomic features in CSB-dependent genes from a and transcription-dependent genes relative to the non-changing group. rRNA, ribosomal RNA; tRNA, transfer RNA. e, Per gene RNAPII occupancy versus DNA accessibility, as determined via ATAC-seq in RPE1 cells (GEO: GSE209659) showing CSB-dependent genes from a and non-changing genes, including the percentage of each group that are present in the shown quadrants. f, Log2-fold change of DPC-seq coverage per gene 6 h/0 h after FA treatment in WT RPE1 cells versus CSB−/− cells, in genes grouped according to whether they show transcription-dependent DPC repair. Statistics via paired two-sided Wilcoxon test. ***P < 0.001; P values are 0.109 and <2.2 × 10−16 for comparisons in no change and transcription-dependent gene sets, respectively. The box plot shows the upper (Q3) and lower (Q1) quartile boundaries and line at the median. Lower whisker (minimum) is Q1 – 1.5 × IQR and upper whisker (maximum) is Q3 + 1.5 × IQR. For all DPC-seq analyses, n = 3 biological replicates. Source numerical data are available in Source data.
Extended Data Fig. 1
Extended Data Fig. 1. ERCC6/CSB mediates cellular tolerance of DPCs.
(a) Venn diagram and STRING analysis at medium confidence (cutoff = 0.400) showing common hits (resistance or sensitivity) from formaldehyde and 5-aza-dC CRISPRi screens in K562 cells. (b) Schematic depiction of formaldehyde detoxification by ADH5 and ESD. (c) Schematic showing 5-aza-dC uptake into cells and subsequent phosphorylation events, mediated by DCK and CMPK1, that are necessary for 5-aza-dC incorporation into nascent DNA. (d-f) Clonogenic survival assays in WT or CSB−/− TET3G cells in the absence of doxycycline, treated with formaldehyde (d), 5-aza-dC (e) or Illudin S (f); data are presented as mean ± SEM, n = 3 replicates. (g-h) Clonogenic survival assays in MRC5 lung fibroblasts and CSB-deficient fibroblasts (CS1AN) treated with formaldehyde (g) or 5-aza-dC (h); data are presented as mean ± SEM, n = 3 replicates. (i-k) Alamar blue viability assays in WT, CSB−/−, XPC−/− or CSB−/−/XPC−/− RPE1 cells treated with formaldehyde (i), 5-aza-dC (j) or Illudin S (k); data are presented as mean ± SD, n = 3 replicates. (l) Colony formation assay in the cell lines from (i-k) treated with UVC at the indicated doses. (m) Representative oligonucleotide excision assay in WT and XPC−/− RPE1 cells treated with formaldehyde (FA) or UVC and released from treatment as indicated. A 50nt oligonucleotide was spiked in as an internal control. (n) Quantification of (m); data are presented as mean ± SD, n = 3 replicates. Source numerical data are available in source data.
Extended Data Fig. 2
Extended Data Fig. 2. CSB acts in parallel to known DPC repair pathways in promoting DPC tolerance.
(a) Western blot for CSB and SPRTN in WT, CSB−/−, SPRTN-ΔC and SPRTN-ΔC/CSB−/− RPE1 cell line clones; data are representative of 2 independent experiments. (b) Colony formation assay in untreated cell lines from (a). (c) siRNA-mediated depletion of CSB in WT and SPRTN-ΔC RPE1 cells. (d) siRNA-mediated depletion of SPRTN in WT and CSB−/− RPE1 cells. (e-f) Depletion of RNF4 by siRNA transfection in WT and CSB−/− RPE1 (e) or HAP1 (f) cells. (c-f) data are representative of 3 independent experiments. (a) and (c): the monoubiquitylated form of SPRTN is denoted by an asterisk (*) and the truncated SPRTN-ΔC protein product is denoted by two asterisks (**). Unprocessed blots are available in source data. Source data
Extended Data Fig. 3
Extended Data Fig. 3. CSB initiates a pathway that supports transcription recovery following DPC induction.
(a) Constitutive expression of GFP-DNMT1 compared to GFP in U2OS cells; full length GFP-DNMT1 is denoted by an asterisk (*). (b) Representative images from Proximity ligation assays (PLA) between GFP and RPB1 CTD-pS2 in U2OS cells constitutively expressing GFP-DNMT1 following release from thymidine block into 10 µM dC or 5-aza-dC for 1 h; scale bars = 10 µm. (c) Quantification of (b); data presented as mean ± SD, n = 3 replicates. (d-e) Quantification of Fig. 3e, f; degradation of RPB1 in RPE1 cells treated with FA (d) or UVC (e) in the presence or absence of MLN4924; data presented as mean ± SEM, n = 3 replicates. (f-g) RPB1 degradation in cycloheximide-treated WT and CSB−/− (f) or CSA−/− (g) RPE1 cells at the indicated time points after a UVC treatment. (h-i) Quantification of (f-g), respectively; data presented as mean ± SEM, n = 3 replicates. (j-k) RPB1 degradation in cycloheximide-treated WT and CSB/ (j) or CSA/ (k) cells treated with formaldehyde for the indicated time points. For (j) and (k), GAPDH blot images are also shown alongside blots in Fig. 3g, h, respectively, due to detection of RPB1 CTD-pS2 and RPB1 CTD-pS5 from the same experiment. (l-m) Quantification of (j) and (k), respectively; data presented as mean ± SEM, n = 3 replicates. Source numerical data and unprocessed blots are available in source data. Source data
Extended Data Fig. 4
Extended Data Fig. 4. Formaldehyde induces global transcription arrest.
(a) Representative images showing formaldehyde-induced inhibition of transcription (EU incorporation) and DNA replication (EdU incorporation) in WT RPE1 cells; scale bars = 10 µm. (b-c) Quantification of (a) for EU (b) and EdU (c). (d-e) RRS assays in RPE1 (d) or HAP1 (e) cells treated with 5-aza-dC for the indicated times. (f-g) Quantification (f) and representative images (g) of RRS assays in RPE1 cells treated with formaldehyde and allowed to recover for the indicated times; scale bars = 10 µm. (h) RRS assay in RPE1 cells treated with UVC and allowed to recover for the indicated times. For (b-f) and (h), data are shown from one biological replicate, representative of 2 (e) or 3 (b-d, f, h) independent experiments with the mean value shown in black. Source numerical data are available in source data.
Extended Data Fig. 5
Extended Data Fig. 5. Upstream TC-NER factors support transcription recovery after DPC induction.
(a-b) Representative images (a) and quantification (b) from RRS assays in WT and CSB−/− HAP1 cells treated with formaldehyde and released for the indicated times; scale bars = 10 µm. Mean intensities of replicates are displayed as black dots with a mean of those averages shown; n = 2 replicates. (c) Western blot analysis of CSB and GFP-CSB expression in the indicated RPE1 cell lines. (d) RRS assays in cell lines from (c) treated with formaldehyde and released for the indicated times. Mean intensities of replicates are displayed as black dots with a mean of those averages shown as line; n = 3 replicates, error bars ± SEM. (e) Representative images from RRS assays in WT, CSB−/− and CSA−/− RPE1 cells treated with formaldehyde and released for the indicated times; scale bars = 10 µm. (f-h) Alamar blue cell viability assays in WT, CSB/ or ELOF1/ RPE1 cells treated with Illudin S (f), formaldehyde (g) or 5-aza-dC (h) at the indicated doses; data presented as mean ± SD, n = 3 replicates. (i-k) Alamar blue viabilities as in (f-h) but with WT, CSB/ and RPB1-K1268R HeLa cells; data presented as mean ± SD, n = 3 replicates. (l-m) Alamar blue assays in WT, CSB−/−, CSA−/− and UVSSA−/− RPE1 cells treated with formaldehyde (FA) (c) or 5-aza-dC (d); data presented as mean ± SD, n = 3 replicates. Uncropped western blot images are provided in the source data. Source numerical data and unprocessed blots are available in source data. Source data
Extended Data Fig. 6
Extended Data Fig. 6. Downstream NER factors are dispensable for transcription recovery after DPC induction.
(a) Representative images from RRS assays in WT, CSB−/− and UVSSA−/− RPE1 cells treated with formaldehyde; scale bars = 10 µm, images representative of 3 independent experiments. (b) Dsk2 pulldown in G1-synchronised WT, CSB−/− and UVSSA−/− RPE1 cells treated with formaldehyde for the indicated times; data representative of 3 independent experiments. (c) Formaldehyde-induced RPB1 degradation in cycloheximide-treated WT and UVSSA−/− cells released from FA treatment for the indicated times. (d) Quantification of (c); error bars ± SEM, n = 3 replicates. (e) Representative images from RRS assays in XPC/, XPC−/−/CSB−/− and XPC−/−/XPA−/− RPE1 cells treated with formaldehyde; scale bars = 10 µm. (f) Western blot analysis of candidate XPG knockout RPE1 clones. (g) Sanger sequencing result from genotyping of RPE1 XPG/ clone 21 used following PCR amplification of the targeted gDNA sequence. (h-i) Alamar blue assays in WT, CSB−/−, ERCC1−/− and XPG−/− RPE1 cells treated with formaldehyde (e) or 5-aza-dC (f); data presented as mean ± SD, n = 3 replicates. Source numerical data and unprocessed blots are available in source data. Source data
Extended Data Fig. 7
Extended Data Fig. 7. Global DPC induction and repair is not affected by CSB loss.
(a) Representative images from RRS assays in WT, CSB−/−, ERCC1/ and XPG−/− RPE1 cells treated with formaldehyde, representative of 3 independent experiments. (b) RRS assays in WT SPRTN-ΔC, CSB/ and SPRTN-ΔC/CSB/ RPE1 cells treated with formaldehyde and released for the indicated times. Mean intensities of replicates are displayed as black dots with a mean of those averages shown as line; n = 3 replicates error bars ± SEM. (c) Volcano plot from PxP-MS in WT RPE1 cells treated with formaldehyde compared with cells treated with formaldehyde and released for 6 h. (d) Heat map displaying Z-scored intensities for DNA-crosslinked proteins identified by PxP-MS after formaldehyde treatment and release for the indicated times in WT and CSB/ RPE1 cells. Intensities are displayed for three replicates per condition. Source numerical data are available in source data.
Extended Data Fig. 8
Extended Data Fig. 8. Formaldehyde induces RNAPII-DPCs at transcription start sites.
(a) Enriched DPC-DNA quantification by Qubit as a % of total DNA per sample in either untreated RPE1 cells, treated with 1.75 mM formaldehyde for 1 h or treated and then recovered for 6 h, data presented as mean ± SD, n = 3 replicates. (b-c) Metagene profiles from stringent CUT&Tag with antibodies against RPB CTD-pS5 (b) and -pS2 (c) in WT or CSB/ RPE1 cells treated with formaldehyde, or treated and then released for 6 hours; n = 3 biological replicates. (d) PxP-WB with the indicated antibodies in WT and CSB/ RPE1 cells treated with formaldehyde and released for the indicated times; data representative of 3 independent experiments. (e-f) Overlaid metagene profiles from formaldehyde-treated WT RPE1 cells subjected to DPC-seq or stringent CUT&Tag against RPB1 CTD-pS5 (e) or -pS2 (f); n = 3 biological replicates for each approach. (g) Representative gel image of low (left lane) and high (right lane) shearing in DPC-seq sample preparation. (h) Metagene profiles of DPC-seq after formaldehyde treatment in RPE1 cells from samples in (g); n = 3 biological replicates. (i) Log2 fold change of DPC-seq coverage per gene 6 h/0 h after FA treatment, with or without MG132 treatment, in genes with low, medium or high DNA accessibility as determined by ATAC-seq (GEO: GSE209659), n = 3 biological replicates, statistics via two-sided paired Wilcoxon test *** p < 0.001; p-values are <2.2 × 10−16, <2.2 × 10−16 and <2.2 × 10−16 for comparisons in low, medium and high DNA accessibility, respectively. Box-plot shows upper (Q3) and lower (Q1) quartile boundaries and line at the median. Lower whisker (minimum) = Q1 – 1.5 x interquartile range (IQR), upper whisker (maximum) = Q3 + 1.5 x IQR. For all DPC-seq analyses, n = 3 biological replicates. Source numerical data and unprocessed blots are available in source data. Source data
Extended Data Fig. 9
Extended Data Fig. 9. CSB is required for the repair of DPCs at transcriptionally active loci.
(a) DPC-seq coverage per gene, with or without 6 h recovery after treatment, in genes grouped by transcriptional activity, as determined by RNAPII ChIP-seq (GEO: GSE141798), statistics via two-sided paired Wilcoxon test ** p < 0.01 *** p < 0.001; p-values are 0.1458, 0.008734, <2.2 × 10−16 and <2.2 × 10−16 for comparisons in low, mid-low, mid-high and high transcriptional activity gene sets, respectively. (b) DPC-seq coverage per gene in WT RPE1 cells vs CSB−/− cells immediately (0 h) after formaldehyde treatment, blue genes show significantly enriched DPC coverage in CSB−/− cells. (c) Percentage of different gene types in genes that are dependent on CSB for DPC repair or where repair is not significantly changing based on CSB status. (d) RNAPII occupancy of genes that are dependent or independent on CSB for DPC repair, statistics via two-sided unpaired Wilcoxon test *** p < 0.001; p < 2.2 × 10−16. (e) Same as (d) but for DNA accessibility; p < 2.2 × 10−16. (f) Same as (d) but for gene length; p = 7.457 × 10−11. (g) Box-plot of DPC-seq coverage per gene in WT and CSB−/− cells with 1 h 1.75 mM formaldehyde treatment with or without 6 h recovery split into quartiles of transcriptional activity, statistics via two-sided Dunn test (paired) * p < 0.05 *** p < 0.001; p-values are 0.2265 and 0.05998 (low transcriptional activity, 0 h and 6 h respectively), 0.0007959 and 0.03377 (mid-low transcriptional activity, 0 h and 6 h respectively), 0.5608 and 2.466 × 10−10 (mid-high transcriptional activity, 0 h and 6 h respectively), 0.2227 and <2.2 × 10−16 (high transcriptional activity, 0 h and 6 h respectively). (a, d-g) Box-plot shows upper (Q3) and lower (Q1) quartile boundaries and line at the median. Lower whisker (minimum) = Q1 – 1.5 x interquartile range (IQR), upper whisker (maximum) = Q3 + 1.5 x IQR. For all DPC-seq analyses, n = 3 biological replicates. Source numerical data are available in source data.

References

    1. Kuo HK, Griffith JD, Kreuzer KN. 5-Azacytidine-induced methyltransferase-DNA adducts block DNA replication in vivo. Cancer Res. 2007;67:8248–8254. doi: 10.1158/0008-5472.CAN-07-1038. - DOI - PubMed
    1. Nakano T, et al. Translocation and stability of replicative DNA helicases upon encountering DNA–protein cross-links. J. Biol. Chem. 2013;288:4649–4658. doi: 10.1074/jbc.M112.419358. - DOI - PMC - PubMed
    1. Duxin JP, Dewar JM, Yardimci H, Walter JC. Repair of a DNA–protein crosslink by replication-coupled proteolysis. Cell. 2014;159:346–357. doi: 10.1016/j.cell.2014.09.024. - DOI - PMC - PubMed
    1. Weickert P, Stingele J. DNA–protein crosslinks and their resolution. Annu. Rev. Biochem. 2022;91:157–181. doi: 10.1146/annurev-biochem-032620-105820. - DOI - PubMed
    1. Pommier Y, Marchand C. Interfacial inhibitors: targeting macromolecular complexes. Nat. Rev. Drug Discov. 2012;11:25–36. doi: 10.1038/nrd3404. - DOI - PMC - PubMed

Publication types

MeSH terms

Grants and funding