. 2024 May;26(5):770-783.
doi: 10.1038/s41556-024-01394-y. Epub 2024 Apr 10.

Transcription-coupled DNA-protein crosslink repair by CSB and CRL4CSA-mediated degradation

Affiliations

Transcription-coupled DNA-protein crosslink repair by CSB and CRL4CSA-mediated degradation

Marjolein van Sluis et al. Nat Cell Biol. 2024 May.

Abstract

DNA-protein crosslinks (DPCs) arise from enzymatic intermediates, metabolism or chemicals like chemotherapeutics. DPCs are highly cytotoxic as they impede DNA-based processes such as replication, which is counteracted through proteolysis-mediated DPC removal by spartan (SPRTN) or the proteasome. However, whether DPCs affect transcription and how transcription-blocking DPCs are repaired remains largely unknown. Here we show that DPCs severely impede RNA polymerase II-mediated transcription and are preferentially repaired in active genes by transcription-coupled DPC (TC-DPC) repair. TC-DPC repair is initiated by recruiting the transcription-coupled nucleotide excision repair (TC-NER) factors CSB and CSA to DPC-stalled RNA polymerase II. CSA and CSB are indispensable for TC-DPC repair; however, the downstream TC-NER factors UVSSA and XPA are not, a result indicative of a non-canonical TC-NER mechanism. TC-DPC repair functions independently of SPRTN but is mediated by the ubiquitin ligase CRL4CSA and the proteasome. Thus, DPCs in genes are preferentially repaired in a transcription-coupled manner to facilitate unperturbed transcription.


Conflict of interest statement

S.C.D. is President/CEO of DeaTech Research, an engineering and biotechnology consulting firm, but has no financial or intellectual property interests in this study. The other authors declare no competing interests.

Figures

Fig. 1
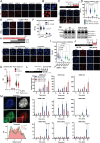
Fig. 1. FA-induced DPCs inhibit transcription.
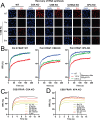
a, Top: schematic of experiment. Bottom: representative images of nascent transcription levels as determined by EU pulse labelling in MRC-5 cells treated with FA, 1 μM THZ1 or UV (8 J m–2). Scale bar, 50 μm. b, Quantification of transcription levels of RNA synthesis as shown in a. Relative fluorescence intensities (RFI) of EU were normalized to untreated levels and set to 100%. Black lines indicate the average integrated density ± s.e.m. n (left to right) = 635, 754, 708, 714, 669, 594, 519, 644, 617, 545, 722, 670 and 530 cells from 3 independent experiments. Unpaired two-tailed t-test. c, FRAP analysis of GFP–Pol II using MRC-5 GFP–RPB1 KI cells untreated or 1–2 h after a 30 min FA pulse. The RFI was measured over time, background-corrected and normalized to the pre-bleach fluorescence intensity. Graphs present mean values. n (top to bottom) = 49, 24, 23, 33 and 23 cells from n = 4 (FA) or n = 3 (UV) independent experiments. d, Relative immobile fractions of GFP–Pol II calculated from data indicated in the dashed box in c. Values represent the mean ± s.e.m. Unpaired two-tailed t-test. e, Left: representative images of GFP–DNMT1-expressing RPE1 cells treated with a 30 min 5-Aza-dC (50 μM) pulse and fixed after 120 min. Scale bars, 10 μm and 2 μm (magnification). Right: histogram of RFI for DNMT1, PCNA and EU at the indicated line 120 min after 5-Aza-dC treatment. f, Quantification of EU signals at DNMT1 foci and the surrounding nucleoplasm (global) as shown in e. RFI values were background-corrected and normalized to untreated samples, which was set at 1. Lines show the mean ± s.e.m. n (left to right) = 36, 43, 36, 36, 46, 43 and 43 cells from 3 independent experiments. Unpaired two-tailed t-test. g, Quantification of recovery of transcription after FA treatment shown in Extended Data Fig. 2a. RFI values of EU were normalized to untreated levels and set to 100%. Black lines indicate the average integrated density ± s.e.m. n (left to right) = 626, 573, 877, 612, 601, 566, 592 and 549 cells from 3 independent experiments. Unpaired two-tailed t-test. h, GFP–Pol II FRAP as in c at the indicated time intervals after a 30 min FA (300 μM) pulse. Graphs represent the mean. n (top to bottom) = 45, 23, 24, 37 and 32 cells from 3 independent experiments. i, Relative immobile fractions of GFP–Pol II as in h. Values represent the mean ± s.e.m. Unpaired two-tailed t-test. Source numerical data are available in the source data. Source data
Fig. 2
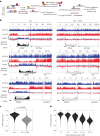
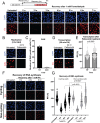
Fig. 2. TC-DPC repair.
a, Cartoon outlining the DPC isolation procedure. Cells were lysed in SDS, and DPCs with associated DNA were precipitated with KCl. DPC repair was determined by RT–qPCR or sequencing 0 h or 4 h after FA treatment. b, Left: DPC-seq reads from MRC-5 cells in representative genes directly (0 h) and 4 h after a 1 mM FA pulse of 30 min. Right: charts represent cells pre-treated with 1 μM THZ1 for 90 min before a pulse of 1 mM FA. Expressed genes were identified with nascent RNA-seq in untreated MRC-5 WT cells. Repair was calculated by subtracting 4 h from 0 h reads. c, For genome-wide DPC repair analysis, the genome was segmented into bins of 1 kb. DPC-seq reads were normalized per sample to non-expressed bins. Violin plots showing DPC repair in per cent (0 h – 4 h DPC-seq reads)/(0 h DPC-seq reads) in expressed bins >3 TPM. The violin plots are normalized to non-expressed bins. Median and Q1 and Q3 quartiles are plotted in the violin plots, and values represent data from two independent DPC-seq experiments. Unpaired two-tailed t-test. d, Violin plot as described in c, whereby DPC repair per cent in WT MRC-5 cells is binned on the indicated expression levels. Schematic in a was created using BioRender (https://www.biorender.com).
Fig. 3
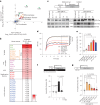
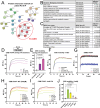
Fig. 3. TC-NER factors are recruited to DPC-stalled Pol II.
a, Scatter plot of log2 stable isotope labelling by amino acids in cell culture (SILAC) ratios of SILAC-based quantitative interaction proteomics of pSer2-modified RPB1 across two independent experiments, including a label swap. Pol II-interacting proteins were compared between mock-treated cells and cells treated with 300 μM FA for 45 min. TC-NER proteins are depicted in green and Pol II subunits in blue. IP, immunoprecipitation; NT, untreated; H, heavy; L, light. b, Heatmap of interacting proteins of DPC-stalled elongating Pol II based on the average SILAC ratios (log2) as shown in a. c, Top: scheme of experiment. Bottom: IP of pSer2-modified Pol II followed by immunoblotting for the indicated proteins over time after a 30 min pulse of 300 μM FA and collected either directly after the pulse (0 h) or allowed to recover for the indicated times. Pol II interactions were compared with cells collected 1 h after UV (8 J m–2) irradiation. This experiment was performed twice with similar results. d, CSB–mScarlet-I FRAP with indicated doses of FA compared with 8 J m–2 UV irradiation. Cells were imaged 30 min after FA exposure without washout. The lines represent the mean. n (top to bottom) = 43, 41, 30, 52, 49 and 34 cells from 3 independent experiments. e, Relative immobile fractions of mScarlet-I–CSB FRAP as in c. Values represent the mean ± s.e.m. Unpaired two-tailed t-test. f, Top: scheme of experiment. Bottom: relative immobile fractions of CSB FRAP in cells pre-treated with 1 μM THZ1 before exposure to 300 μM FA. Values represent the mean ± s.e.m. n (left to right) = 52, 64, 52 and 54 cells from 3 independent experiments. Unpaired two-tailed t-test. g, Top: scheme of experiment. Bottom: relative immobile fractions of mScarlet-I–CSB FRAP in cells treated with 30 min of a 300 μM FA pulse and followed in time. Values represent the mean ± s.e.m. n (left to right) = 122, 82, 52, 56, 53 and 87 cells from 3 independent experiments. Unpaired two-tailed t-test. Source numerical data (dg) and unprocessed blots (c) are available in the source data. Source data
Fig. 4
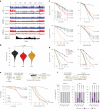
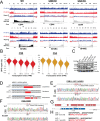
Fig. 4. Transcription-coupled repair of DPCs by CSA and CSB.
a, DPC-seq reads from MRC-5 WT, CSA and CSB KO cells in the CRIM1 gene directly (0 h) and 4 h after a 30 min pulse of 1 mM FA as described in Fig. 2b. b, Violin plots of per cent of DPC repair in expressed bins (>3 TPM) in MRC-5 WT, CSA and CSB KO cells as described in Fig. 2c. Unpaired two-tailed t-test. c, Relative colony survival of MRC-5 WT and indicated TC-NER KO cells treated with the indicated doses of FA (1 h pulse), UV, 5-Aza-dC (continuous) or cisplatin (1 day pulse). Graphs represent the mean ± s.e.m. from n = 7 (FA) or n = 3 (UV, 5-Aza-dC and cisplatin) independent experiments. Graphs were normalized to the untreated colony number, which was set at 100%. Unpaired two-tailed t-test with values from 2.5 mM FA, 6 J m–2 UV, 400 nM 5-Aza-dC and 3 μM cisplatin. d, Relative colony survival assay of HCT116 WT, CSB mutants and TC-NER KO cell lines treated with 1 h of FA pulse (left) or UV (right). The endogenous KI of CSB(K538R) disrupts ATPase activity, whereas the CSB-GG mutant (L1427G and L1428G) has a deficient UBD. Graphs were normalized to the untreated colony number, which was set at 100%. Graphs represent the mean ± s.e.m. n = 3 independent experiments. Unpaired two-tailed t-test using values from 1 mM FA and 3 J m–2 UV. e, Top: scheme of procedure. Bottom: FA (left) and ultraviolet-B irradiation (right) survival assays of WT, csa-1, csb-1, uvs-1 and xpa-1 mutant C.elegans. Shown is the mean ± s.e.m. of three independent experiments. Unpaired two-tailed t-test using values from 12 mM FA and 80 J m–2 UV. f, Top: scheme of procedure. Bottom: developmental growth of WT, csa-1, csb-1, uvs-1 and xpa-1 mutant C.elegans after control RNA interference (RNAi) or depletion of alh-1 or adh-5. For each condition, the developmental stage was counted as ‘adult, L4’, ‘L3, L2, L1’ or ‘egg’. Shown is the average ± s.e.m. of three independent experiments. Unpaired two-tailed t-test using values from ‘adult, L4’. Source numerical data are available in the source data. Schemes in e and f were created using BioRender (https://biorender.com). Source data
Fig. 5
Fig. 5. DPCs are repaired by non-canonical TC-NER.
a, Top: scheme of experiment. Bottom: quantification of recovery of transcription after a 30 min pulse of 1 mM FA. RFI of EU were normalized to untreated levels and set to 100%. Black lines indicate the average integrated density ± s.e.m. n (left to right) = 779, 683, 759, 758, 801, 647, 676, 786, 692, 524, 697, 615, 696, 625, 609, 673, 368, 277, 364 and 334 cells from 3 independent experiments. Unpaired two-tailed t-test at the 6 h time point. b, Relative immobile fractions of GFP–Pol II in MRC-5 GFP–RPB1 KI WT, XPA KO or CSB KO cells at the indicated time intervals after a 30 min pulse with 300 μM FA. Values represent the mean ± s.e.m. n (left to right) = 23, 23, 26, 24, 22, 22, 25, 22 and 24 cells from 3 independent experiments. Unpaired two-tailed t-test. c, Relative immobile fractions of CSB FRAP after a 30 min pulse with 300 μM FA followed over time in KO cells. Values represent the mean ± s.e.m. n (left to right) = 122, 129, 82, 82, 96, 61, 52, 67, 47, 56, 68, 44, 53, 57 and 48 cells from 3 (WT and XPA KO) or 4 (CSA KO) independent experiments. Unpaired two-tailed t-test. d, TCR-UDS in non-replicating RPE1 XPC KO by 1 μM palbociclib treatment for 24 h before treatment with the indicated doses of FA or with 8 J m–2 UV. Cells were pre-treated with 2 μM THZ1 where indicated. Values represent the mean ± s.e.m. n (left to right) = 648, 997, 502, 754 and 610 cells from 3 independent experiments. Unpaired two-tailed t-test. Source numerical data are available in the source data. Source data
Fig. 6
Fig. 6. SPRTN-independent TC-DPC repair.
a, Quantification of recovery of transcription in RPE1 WT and CSB KO cells transfected with short interfering RNA (siRNA) targeting SPRTN (siSPRTN) or a control siRNA (siCtrl) after a 30 min pulse of 1 mM FA. After FA washout, cells were left to recover for the indicated times, including a 30 min pulse labelling with EU before fixation. RFI of EU were normalized to untreated levels and set to 100%. Black lines indicate the average integrated density ± s.e.m. from three independent experiments. n (left to right) = 777, 634, 742, 757, 509, 481, 491, 458, 494, 480, 448, 616, 333, 371, 356 and 349 cells. Unpaired two-tailed t-test. b, Relative immobile fraction of CSB FRAP in non-replicating RPE1 CSB–mScarlet-I cells transfected with the indicated siRNAs and treated with 1 μM palbociclib 24 h before FRAP. Cells were treated with 300 μM FA for 30 min and followed for the indicated times. Values represent the mean ± s.e.m. from three independent experiments. n (left to right) = 49, 51, 55, 46, 37, 41, 34, 39, 45, 55, 56, 55, 46, 60 and 34 cells. Unpaired two-tailed t-test. c, Relative survival of non-replicating RPE1 cells as determined by Alamar Blue staining. RPE1 cells, arrested in G1 by treatment with 1 μM palbociclib, were treated with the indicated doses of FA for 1 h and allowed to recover for 4 days. Metabolic activity was assayed as a measure of cell viability. Values represent the mean ± s.e.m. from four independent experiments and were normalized to untreated cells. Unpaired two-tailed t-test at 5 mM FA. d, GFP–Pol II FRAP in WT and CSB KO neurons. GFP–RPB1 KI iPS cells were differentiated into post-mitotic neurons through neurogenin-2 induction. FRAP in two different clones (A and B) was performed after treatment with 300 μM FA for 90 min. Graph represents values from eight cells. Source numerical data are available in the source data. Source data
Fig. 7
Fig. 7. DPC repair is independent of Pol II degradation.
a, Top: scheme of experiment. Bottom: relative GFP–RPB1 protein levels measured by flow cytometry in the presence of 100 µM cycloheximide after a pulse of 1 mM FA for 30 min. RFI of GFP were normalized to mock-treated levels and set to 1. Bars represent the mean fluorescence ± s.e.m. from three independent experiments. Unpaired two-tailed t-test. b, Chromatin-bound elongating Pol II as determined by immunoblotting with the indicated antibodies. MRC-5 cells were treated with 1 mM FA for 30 min and collected at the indicated times. SSRP1 was used as the loading control. This experiment was performed three times with similar results. c, Quantification of pSer2-modified RPB1 levels as shown in b. Values indicate the average integrated density ± s.e.m. from three independent experiments. Unpaired two-tailed t-test. d, Relative survival of WT, CSB KO or K1268R mutated RPB1 HeLa cells treated with the indicated doses of FA for 1 h. Values represent the mean ± s.e.m. from three independent experiments. Unpaired two-tailed t-test at 1.5 mM FA. e, Quantification of recovery of transcription in WT, CSB KO or K1268R mutated RPB1 HeLa cells after a 30 min pulse of 1 mM FA. After FA washout, cells were left to recover for the indicated times, including a 30 min pulse labelling with EU. RFI of EU were normalized to mock-treated levels and set to 100%. Black lines indicate the average integrated density ± s.e.m. n (left to right) = 1,311, 1,169, 1,162, 1,224, 1,439, 1,360, 1,236, 1,386, 973, 1,286, 1,310 and 1,107 cells from 3 independent experiments. Source numerical data (a,ce) and unprocessed blots (b) are available in the source data. Source data
Fig. 8
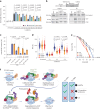
Fig. 8. CRL4CSA and proteasome-mediated removal of DPCs.
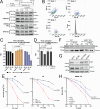
a, Relative immobile fractions of non-replicating mScarlet-I–CSB FRAP in cells arrested following treatment with 1 µM palbociclib for 24 h. Cells were mock treated or treated with 50 µM proteasome inhibitor (MG132), 10 µM VCP inhibitor (VCPi; NMS873) or 20 µM neddylation inhibitor (NAEi; MLN4924) before treatment with 1 mM FA for 30 min. Values represent the mean ± s.e.m. n (left to right) = 25, 24, 34, 26, 24, 30, 40, 31, 27, 30, 39, 34, 27, 30, 39, 34, 27, 30, 40 and 33 cells from 3 (NAEi) or 4 (VCPi) independent experiments. Unpaired two-tailed t-test. b, Top: scheme of experiment. Bottom: IP of pSer2-modified elongating Pol II followed by immunoblotting with the indicated antibodies either directly after a 30 min FA pulse (1 mM) or after recovery for the indicated time. This experiment was performed twice with similar results. Untr., untreated. c, Relative immobile fractions of non-replicating mScarlet-I–CSB FRAP in siRNA-transfected cells, which were arrested in G1 with 1 μM palbociclib for 24 h before treatment with 1 mM FA for 30 min. Graphs represent the mean ± s.e.m. n (left to right) = 36, 28, 38, 24, 35, 28, 36, 28, 29 and 28 cells from 3 independent experiments. Unpaired two-tailed t-test. d, Quantification of recovery of transcription in RPE1 cells transfected with the indicated siRNA. Cells were treated with a 30 min FA (1 mM) pulse and left to recover for the indicated times, including a 30 min pulse labelling with EU. RFI of EU were normalized to untreated levels and set to 100%. Black lines indicate the average integrated density ± s.e.m. n (left to right) = 688, 652, 331, 633, 611, 466, 726, 391, 265, 721, 418 and 313 cells from 2 (siCSB) or 3 (siCtrl and siDDB1) independent experiments. Unpaired two-tailed t-test. e, Relative clonogenic survival assay in WT (MRC-5 sv40), CS-A (CS3BE sv40), CS-B (CS1AN sv40) and UVSS-A (TA-24 sv40) cells with the indicated doses of FA for a 1 h pulse. Graphs were normalized to the untreated colony number, which was set at 100%. Graphs represent the mean ± s.e.m. from five independent experiments. Unpaired two-tailed t-test. f, TC-DPC repair model. TC-DPC repair is initiated when DPC-stalled Pol II is recognized by CSB, which recruits CRL4CSA E3 ligase. UVSSA stabilizes CSB through USP7. Ubiquitin (Ub)-DPC ubiquitylation by CRL4CSA drives VCP-dependent and proteasome-dependent DPC degradation followed by transcription restart. Functional TC-DPC repair may explain the phenotypic differences in the TC-NER syndromes CS and UV-sensitive syndrome. Source numerical data (a,ce) and unprocessed blots (b) are available in the source data. Scheme in f was created using BioRender (https://biorender.com). Source data
Extended Data Fig. 1
Extended Data Fig. 1. DPC-induced transcriptional inhibition requires elongating RNA Pol II.
a: Representative images of transcription levels in MRC-5 cells treated for 30 min with the indicated concentrations of formaldehyde (FA), Quantification is shown in Fig. 1b. Scale bar = 50 μm. b: Close up of cells exposed to mock- or formaldehyde treatment with 300 μM FA. Scale bar = 10 μm. c: MRC-5 cells treated with Actinomycin D (ActD, 50 ng/ml) or Flavopiridol (Flavo, 1 μM) for 1 hr. Scale bar = 20 μm and 10 μm (magnification). d: MRC-5 cells, treated with the inhibitors as in (c), were subsequently treated with 1 mM FA for 30 min. Relative fluorescence intensities (RFI) of EU was normalized to levels without FA and set to 100%. Black lines indicate average integrated density ±S.E.M. n = 849, 1025, 745, 792, 686, 600 cells (left to right) from 3 independent experiments. Unpaired two-tailed t-test. e: Representative pictures of transcription levels in WT and RPB1 K1268R cells after a 1 mM FA pulse (30 min). Scale bar = 50 μm. f: Quantification of transcription as shown in (b). RFI of EU was normalized to untreated levels and set to 100%. Black lines indicate average integrated density ±S.E.M. n = 1311, 1169, 1224, 1439 cells (left to right) from 3 independent experiments. Unpaired two-tailed t-test. g: Immunoblot of chromatin fractions from HeLa WT and RPB1-K1268R mutant stained for pSer2 Pol II and SSRP as a loading control. This experiment was performed twice with similar results. h: Representative pictures of transcription levels in MRC-5 cells treated with either 1 mM FA or 1 μM Flavopiridol during a 30 min EU pulse for the indicated times. Scale bar = 50 μm. i: Quantification of transcription levels as shown in (e). RFI of EU was normalized to untreated levels and set to 100%. Black lines indicate average integrated density ±S.E.M. n = 807, 964, 852, 859, 852, 757, 829 cells (left to right) from 3 independent experiments. Unpaired two-tailed t-test. j: Representative pictures of transcription levels in MRC-5 cells, treated with 1 μM Flavopiridol for 2 hr prior to treatment with 1 mM FA for 30 min when indicated. Scale bar = 50 μm. k: Quantification of transcription levels as shown in (j). RFI of EU were normalized Flavopiridol-treated levels and set at 1. Black lines indicate average integrated density ±S.E.M. n = 967, 902, 937, 873, 856, 824 cells (left to right) from 3 independent experiments. Unpaired two-tailed t-test. l: Quantification of nascent RNA transcription after the Flavopiridol wash-out. After a 2 hr, 1 μM Flavopiridol pretreatment, MRC-5 cells were treated 1 mM FA for 30 min. After FA wash-out, RNA was collected at the indicated timepoints and the expression was assayed by RT-qPCR. Values represent the mean ±S.E.M. from 3 independent experiments. m: Representative images of mock-treated GFP-DNMT1 expressing RPE1 cells, which were fixed after 120 min. Right: Histogram of fluorescence signal for DNMT, PCNA and EU at the indicated line. This experiment was performed 3 times independently with similar results. Scale bar = 10 μm and 2 μm in the magnification. Source numerical data and unprocessed blots are available in source data. Source data
Extended Data Fig. 2
Extended Data Fig. 2. DPC-induced transcriptional inhibition is reversible independent of replication.
a: Representative images of recovery of transcription for the indicated recovery times after a 30 min pulse of 1mM FA as determined by a 30 min pulse labelling with EU. This is quantified in Fig. 1g. Scale bar = 50 μm. b: Representative images of replication levels in RPE1 cells treated with 1 µM CDK4/6 inhibitor Palbociclib for 24 hr prior to pulse-labeling with EdU for 3 hr. Scale bar = 50 μm. c: Quantification of the number of EdU positive cells shown in (b). Black bars indicate average from 2 independent experiments. d: Representative images of transcription levels in RPE1 cells treated with 1 µM CDK4/6 inhibitor Palbociclib for 24 hr prior to EU pulse-labelling for 30 min. Scale bar = 50 μm. e: Quantification of the transcription levels as shown in (d). Relative fluorescence intensities (RFI) of EU were normalized to untreated levels and set to 100%. Black bars indicate average integrated density ±S.E.M. n = 314 or 231 cells from 2 independent experiments. Unpaired two-tailed t-test. f: Representative images of transcription levels in cycling and non-cycling cells. Cells were arrested with 1 µM CDK4/6 inhibitor Palbociclib for 24 hr prior to exposure to 1 mM FA for 30 min. Transcription levels were assayed by EU incorporation and visualized with click-chemistry. Scale bar = 50 μm. g: Quantification of the recovery of transcription in cycling cells or non-cycling RPE1 cells as shown in (f). RFI of EU at the indicated time points after 1 mM FA pulse treatments was normalized to untreated levels and set to 100%. Black lines indicate average integrated density ±S.E.M. n = 985, 928, 967, 974, 900, 691, 691, 752 cells (left to right) from 3 independent experiments. Unpaired two-tailed t-test. Source numerical data are available in source data. Source data
Extended Data Fig. 3
Extended Data Fig. 3. DPC repair is more efficient across actively transcribed genes.
a: DPC repair % in expressed bins was plotted against their expression level. Spearman correlation between DPC repair and transcription levels was 0.61997. b: A graphic representation of the RT-qPCR primers used in the DPC removal assay along the CRIM1 gene. c: Relative DPC recovery in untreated (NT) or after the indicated times after a 30 min 1 mM FA pulse using K-SDS precipitation followed by qPCR of genomic DNA in the CRIM1 gene and CRIM1 intergenic region as well a silent genomic region on chromosome Y. Values were normalized to 0 hr conditions for each primer set at 1 and represent mean with S.E.M. from 4 independent experiments. d: Relative DPC recovery at 4 hr after a 30 min 1 mM FA pulse using K-SDS precipitation followed by qPCR of genomic DNA in the CRIM1 gene and CRIM1 intergenic region. Values were normalized to 0 hr conditions (not shown) for each primer set at 1 and represent mean with S.E.M. from 4 independent experiments. Source numerical data are available in source data. Source data
Extended Data Fig. 4
Extended Data Fig. 4. DPC-stalled Pol II is bound by TC-NER factors.
a: STRING analysis of the top hits shown in Fig. 3b. The cluster of TC-NER is highlighted by a red cycle. b: Top 10 enriched GO terms (biological process) identified using g:Profiler of FA- enriched proteins that bind to elongating Pol II genes. c: Top 10 enriched GO terms (reactions) identified using g:Profiler of FA- enriched proteins that bind to elongating Pol II genes. d: CSB-mScarlet-I FRAP during the 30 min FA pulse of 300 μM. The graph represents an average ±S.E.M. n = 45, 27, 31 cells (up to down) from 3 independent experiments. e: Relative immobile fraction is shown in (d). Values represent mean ±S.E.M. Unpaired two-tailed t-test. f: CSB-mScarlet-I FRAP pretreated with 1 μM THZ1 and subsequently with 300 μM of FA for 30 min. The graph represents an average ±S.E.M. n = 52, 64, 52, 54 cells (up to down) from 3 independent experiments. Relative immobile fraction is shown in Fig. 3f. g: GFP-DDB2 FRAP with 300 μM of FA for 30 min or 8 J m-2 UV-C irradiation. The graph represents an average ± S.E.M. n = 64, 64, 67 cells (up to down) from 3 independent experiments. h: CSB-mScarlet-I FRAP with 300 μM of FA for 30 min. The graph represents an average ±S.E.M. n = 122, 82, 52, 56, 53, 87 cells (up to down) from 3 independent experiments. Relative immobile fraction is shown in Fig. 3g. i: CSB-mScarlet-I FRAP with 1 mM of FA for 30 min. The graph represents an average ±S.E.M. n = 32, 31, 35, 30, 33 cells (up to down) from 2 independent experiments. j: Relative immobile fractions of mScarlet-I-CSB FRAP as in (I). Values represent mean ±S.E.M. Unpaired two-tailed t-test. Source numerical data are available in source data. Source data
Extended Data Fig. 5
Extended Data Fig. 5. CSA and CSB are required for transcription-coupled DPC repair.
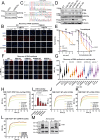
a: Representative images of DPC-Seq at 0 hr (blue) and 4 hr (red) after a 1 mM FA pulse of 30 min in MRC-5 WT, CSA and CSB KO cells. Repair is calculated by subtracting 4 hr from 0 hr. Expressed genes were identified by nascent RNA-Seq. b: Violin plots showing DPC repair in MRC-5 WT, CSA and CSB KO cells in expressed genes, sorted into indicated bin based on their expression levels. In the violin plots are normalized to non-expressed genes. In the plots, the median and Q1 and Q3 quartiles are plotted. c: Immunoblot for the indicated proteins in various MRC-5 GFP-RPB1 KI cells with KO of NER factors. This experiment was performed twice with similar results. d: Schematic representation of MRC-5 GFP-RPB1 KI UVSSA KO cells. e: Sequencing of HCT116 CSB-LL1427-28GG knock-in clone, which disrupts the ubiquitin binding domain (UBD). f: Sequencing of HCT116 CSB-K538R knock-in clone, which disrupts the ATPase activity of CSB. g: Schematic depiction of the csb-1 locus (top) and uvs-1 locus (bottom) under which the knockout alleles emc79 and emc80 showing full removal of both genes are indicated. h: Predicted peptide sequences encoded by alleles emc79 (top) and emc80 (bottom) are shown as compared to the N- and C-terminal protein sequences of the wild type CSB-1 and UVS-1 proteins. Red color indicated nonsense sequence. Unprocessed blots are available in source data. Source data
Extended Data Fig. 6
Extended Data Fig. 6. TC-DPC repair requires TC-NER factors CSB, but not downstream XPA.
a: Representative images of transcription levels in MRC-5 KO cells treated for 30 min with 1 mM FA as determined by EU pulse-labelling for 30 min. Quantification is shown in Fig. 5a. Scale bar = 50 μm. b: GFP-Pol II FRAP in MRC-5 GFP-RPB1 KI WT of XPA and CSB KO cells at the indicated time-intervals after a pulse treatment with 300 μM FA for 30 min. Line represent mean of n = 23, 24, 25 cells (WT), n = 23, 22, 22 cells (CSB), n = 26, 22, 24 cells (XPA) (up to down) from 3 independent experiments. Relative immobile fraction as shown in Fig. 5b. c: CSB-mScarlet-I FRAP with in HCT116 CSA KO cells treated with 300 μM FA for 30 min. Graph is an average of n = 129, 96, 67, 68, 57, 87 cells (up to down) from 4 independent experiments. Relative immobile fraction as shown in Fig. 5c. d: CSB-mScarlet-I FRAP with in HCT116 XPA KO cells treated with 300 μM FA for 30 min. Graph is an average of n = 82, 61, 47, 44, 48, 98 cells (up to down) from 4 independent experiments. Relative immobile fraction as shown in Fig. 5c. Source numerical data are available in source data. Source data
Extended Data Fig. 7
Extended Data Fig. 7. UVSSA and USP7 are required to prevent CSB degradation.
a: CSB immunoblot of indicated HCT116 KO cells treated with 1 mM FA for 30 min and harvested at the indicated times. Tubulin was used as a loading control. This experiment was performed twice with similar results. b: Representative image of flow cytometry gating of CSB-mScarlet to determine CSB protein levels. Gating was used to exclude dead cells based on SCC-A/FSC-A plots and single cells were gated based on FSC-H/FSC-W and subsequently SSC-H/SSC-W. SSC- Side Scatter Channel, FSC- Forward Scatter Channel, A-Area, H-Height, W-Wight. c: Flow cytometry of CSB-mScarlet after a pulse of 1 mM FA for 30 min in the indicated cell lines. Cells were harvested at the indicated times and the fluorescent levels were determined by flow cytometry. Values were normalized to untreated levels and represent the average ±S.E.M. from 3 independent experiments. Unpaired two-tailed t-test. d: Flow cytometry of CSB-mScarlet after a pulse of 1 mM FA for 30 min in the presence of proteasome inhibitor MG132. Cells were harvested at the indicated times and the fluorescent levels were determined by flow cytometry. Values were normalized to untreated levels and represent the average ±S.E.M. from 3 independent experiments. Unpaired two-tailed t-test. e: Relative colony survival of U2OS KO cells treated with the indicated doses of FA for 1 hr and UV. Graph represents the mean with ±S.E.M. from 3 independent experiments. Unpaired two-tailed t-test at 6 J m-2 UV and 2 mM FA. f: Immunoblotting of cells after FA, stained for CSB and Tubulin. U2OS WT and USP7 KO cells were treated with 1 mM FA prior to harvesting at the indicated times. This experiment was performed twice with similar results. g: Immunoblot of siRNA transfected lysates of HeLa cells, stained with antibodies against CSB, USP7 and Tubulin. This experiment was performed twice with similar results. h: Relative colony survival of siRNA transfected HeLa cells treated with the indicated doses of FA for 1 hr. Graph represents the mean with ±S.E.M. from 3 independent experiments. Unpaired two-tailed t-test at 2.5 mM FA between UVSSA- and USP7-depleted cells. Source numerical data and unprocessed blots are available in source data. Source data
Extended Data Fig. 8
Extended Data Fig. 8. TC-DPC repair is independent of SPRTN.
a: Immunoblot of RPE1 cells, transfected with siRNA against SPRTN, stained with antibodies against SPRTN and Tubulin. This experiment was performed twice with similar results. b: Representative pictures of transcription levels in RPE1 WT and CSB KO cells transfected with siRNAs against SPRTN. Quantification is shown in Fig. 6a. Scale bar, 50 = μm. c: Sequencing of UVSSA and SPRTN mutations in RPE1 cells. d: Immunoblot for the indicated proteins in various RPE1 KO cell lines. This experiment was performed twice with similar results. e: Clonogenic survival assay in RPE1 cells after varying doses of UV and FA. Graph represents the average ±S.E.M. from 3 independent experiments. Unpaired two-tailed t-test at 3 J m-2 UV and 2 mM FA. f: Representative pictures of transcription levels in WT, CSA KO, CSB KO, UVSSA KO and SPRTN −/+ RPE1 cells. Scale bar = 50 μm. g: Quantification of the transcription levels as shown in (f). Relative fluorescence intensities (RFI) of EU were normalized to mock-treated levels and set to 100%. Black lines indicate average integrated density ±S.E.M. n = 424, 407, 408, 654, 352, 308, 345, 345, 420, 385, 493, 413, 508, 482, 576, 626, 302, 283, 294, 304 cells (left to right) from 2 independent experiments. h: CSB-mScarlet-I FRAP with in cells non-replicating cells which were treated with 1 μM Palbociclib (CDKi) for 24 hr prior to FRAP after 1 mM FA for 30 min. Graph is an average of n = 35, 37, 40, 40, 40 cells (up to down) from 4 independent experiments. i: Relative immobile fractions of mScarlet-I-CSB FRAP as in (h). Values represent mean ± S.E.M. Unpaired two-tailed t-test. j: CSB-mScarlet-I FRAP with in cells transfected with control (Ctrl) siRNA. Cells were treated with 1 μM Palbociclib (CDKi) for 24 hr prior to FRAP after 1 mM FA for 30 min. Relative immobile fraction as shown in Fig. 6b. Graph is an average of n = 49, 46, 34, 55, 46 cells (up to down) from 3 independent experiments. k: CSB-mScarlet-I FRAP with in cells transfected with siCSA RNA. Cells were treated with 1 μM Palbociclib (CDKi) for 24 hr prior to FRAP after 1 mM FA for 30 min. Relative immobile fraction as shown in Fig. 6b. Graph is an average of n = 51, 37, 39, 56, 60 cells (up to down) from 4 independent experiments. l: CSB-mScarlet-I FRAP with in cells transfected with siSPRTN RNA. Cells were treated with 1 μM Palbociclib (CDKi) for 24 hr prior to FRAP after 1 mM FA for 30 min. Relative immobile fraction as shown in Fig. 6b. Graph is an average of n = 55, 41, 45, 55, 34 cells (up to down) from 3 independent experiments. m: Characterization of the CSB mutation in iPS GFP-RPB1 cells. This experiment was performed twice with similar results. Source numerical data and unprocessed blots are available in source data. Source data
Extended Data Fig. 9
Extended Data Fig. 9. Pol II degradation is not required for DPC repair.
a: Flow cytometry of GFP-RPB1 after a pulse of 1 mM FA for 30 min in the presence of proteasome inhibitor MG132. Cells were harvested at the indicated times and the fluorescent levels were determined by flow cytometry. Values were normalized to untreated levels and represent the average ±S.E.M. from 3 independent experiments. Unpaired two-tailed t-test. b: Representative pictures of transcription levels in WT, CSB KO and RPB1 K1268R cells, which are quantified in Fig. 7e. Scale bar = 50 μm. Source numerical data are available in source data. Source data
Extended Data Fig. 10
Extended Data Fig. 10. DPC repair required ubiquitination by CRL4CSA and degradation by VCP-mediated proteasomal degradation.
a: CSB-mScarlet-I FRAP with in non-replicating cells treated 1 μM Palbociclib (CDKi) for 24 hr prior to treatment with 50 µM proteasome inhibitor (MG132) and subsequently with 1 mM FA for 30 min. Relative immobile fraction as shown in Fig. 8a. Graph is an average of n = 24, 30, 30, 30, 30 cells (up to down) from 3 independent experiments. b: CSB-mScarlet-I FRAP with in non-replicating cells treated 1 μM Palbociclib (CDKi) for 24 hr prior to treatment with 10 µM VCP inhibitor (VCPi: NMS873) and subsequently with 1 mM FA for 30min. Relative immobile fraction as shown in Fig. 8a. Graph is an average of n = 34, 40, 39, 39, 40 cells (up to down) from 3 independent experiments. c: CSB-mScarlet-I FRAP with in non-replicating cells treated 1 μM Palbociclib (CDKi) for 24 hr prior to treatment with 20 µM neddylation inhibitor (NAEi: MLN4924) and subsequently with 1 mM FA for 30 min. Relative immobile fraction as shown in Fig. 8a. Graph is an average of n = 26, 31, 34, 34, 33 cells (up to down) from 3 independent experiments. d: Relative immobile fractions of mScarlet-I-CSB FRAP in HCT116 cells mock-treated, or treated with 50 µM MG132 and 10 µM VCP inhibitor (VCPi: NMS873) prior to treatment with 300 μM FA for 30 min. Values represent mean ± S.E.M., whereby 122, 50, 46, 82, 45, 48, 52, 48, 49, 56, 45, 52, 53, 51, 54 cells respectively (left to right) from 3 independent experiments were analyzed. Unpaired two-tailed t-test. e: CSB-mScarlet-I FRAP in HCT116 cells treated with 50 µM proteasome inhibitor MG132 prior to treatment with 300 μM FA for 30 min. Relative immobile fraction as shown in (d). Graph is an average of n = 46, 46, 48, 49, 52, 54 cells (up to down) from 3 independent experiments. f: CSB-mScarlet-I FRAP in HCT116 cells treated with 10 µM VCP inhibitor NMS873 (VCPi) prior to treatment with 300 μM FA for 30 min. Relative immobile fraction as shown in (d). Graph is an average of n = 38, 50, 45, 48, 45, 51 cells (up to down) from 3 independent experiments. g: CSB-mScarlet-I FRAP in non-replicating RPE1 cells treated 1 μM Palbociclib (CDKi) for 24 hr prior to treatment with 2 μM SUMO inhibitor (SUMOi: ML792) and subsequently with 1 mM FA for 30 min. Graph is an average of n = 29, 28, 27, 28, 28, 27 cells (up to down) from 3 independent experiments. h: Relative immobile fractions of mScarlet-I-CSB FRAP in non-cycling RPE1 cells mock treated, or treated with 2 μM SUMO inhibitor (SUMOi: ML792) prior to treatment with 1 mM FA for 30 min quantified from (h). Values represent mean ± S.E.M. Unpaired two-tailed t-test. i: Immunostaining with the indicated antibodies of chromatin fraction after formaldehyde treatment. Cells were pre-treated for 2 hr pretreatment with 2 μM sumoylation inhibitor (SUMOi) before treatment with 1 mM FA for 30 min. Cells were harvested immediately after FA treatment for chromatin fractionation. This experiment was performed twice with similar results. j: Relative immobile fractions of mScarlet-I-CSB FRAP in WT and CSA KO HCT116 cells and WT cells treated with 20 µM neddylation inhibitor (NAEi: MLN4924) or 2 μM SUMO inhibitor (SUMOi: ML792) prior to treatment with 300 μM FA for 30 min. Values represent mean ± S.E.M., whereby 122, 129, 61, 25, 82, 96, 57, 37, 52, 67, 49, 26, 56, 68, 74, 30, 53, 57, 65, 27 cells respectively (left to right) from a 3 (NAEi and Sumoi) or 4 (CSA KO) independent experiments were analyzed. Unpaired two-tailed t-test. k: CSB-mScarlet-I FRAP in HCT116 cells treated with 20 µM neddylation inhibitor (NAEi: MLN4924) prior to treatment with 300 μM FA for 30 min. Relative immobile fraction as shown in (j). Graph is an average of n = 66, 56, 61, 57, 49, 74, 65 cells (up to down) from 3 independent experiments. l: CSB-mScarlet-I FRAP in HCT116 cells treated with 2 μM SUMO inhibitor (SUMOi: ML792) prior to treatment with 300 μM FA for 30 min. Relative immobile fraction as shown in (j). Graph is an average of n = 25, 37, 26, 30, 27 cells (up to down) from 3 independent experiments. m: Immunoblot of cells transfected with siRNA against DDB1, stained with antibodies against DDB1 and Tubulin. This experiment was performed twice with similar results. n: CSB-mScarlet-I FRAP in cells transfected with siRNAs against DDB1. Cells were treated with 1 μM Palbociclib (CDKi) for 24 hr prior to FRAP after 1 mM FA for 30 min. Relative immobile fraction as shown in Fig. 8c. Graph is an average of n = 28, 24, 28, 28, 28 cells (up to down) from 3 independent experiments. o: Representative pictures of the recovery of transcription in siRNA transfected RPE1 cells. Quantification is shown in Fig. 8d. Scale bar = 50 μm. Source numerical data and unprocessed blots are available in source data. Source data

References

    1. Stingele J, Bellelli R, Boulton SJ. Mechanisms of DNA–protein crosslink repair. Nat. Rev. Mol. Cell Biol. 2017;18:563–573. doi: 10.1038/nrm.2017.56. - DOI - PubMed
    1. Ruggiano A, Ramadan K. DNA–protein crosslink proteases in genome stability. Commun. Biol. 2021;4:11. doi: 10.1038/s42003-020-01539-3. - DOI - PMC - PubMed
    1. Weickert P, Stingele J. DNA–protein crosslinks and their resolution. Annu. Rev. Biochem. 2022;91:157–181. doi: 10.1146/annurev-biochem-032620-105820. - DOI - PubMed
    1. Pommier Y. DNA topoisomerase I inhibitors: chemistry, biology, and interfacial inhibition. Chem. Rev. 2009;109:2894–2902. doi: 10.1021/cr900097c. - DOI - PMC - PubMed
    1. Nitiss JL. Targeting DNA topoisomerase II in cancer chemotherapy. Nat. Rev. Cancer. 2009;9:338–350. doi: 10.1038/nrc2607. - DOI - PMC - PubMed

Publication types

MeSH terms