. 2024 Aug;31(8):1176-1188.
doi: 10.1038/s41594-024-01268-9. Epub 2024 Apr 10.

Visualizing chaperone-mediated multistep assembly of the human 20S proteasome

Affiliations

Visualizing chaperone-mediated multistep assembly of the human 20S proteasome

Frank Adolf et al. Nat Struct Mol Biol. 2024 Aug.

Abstract

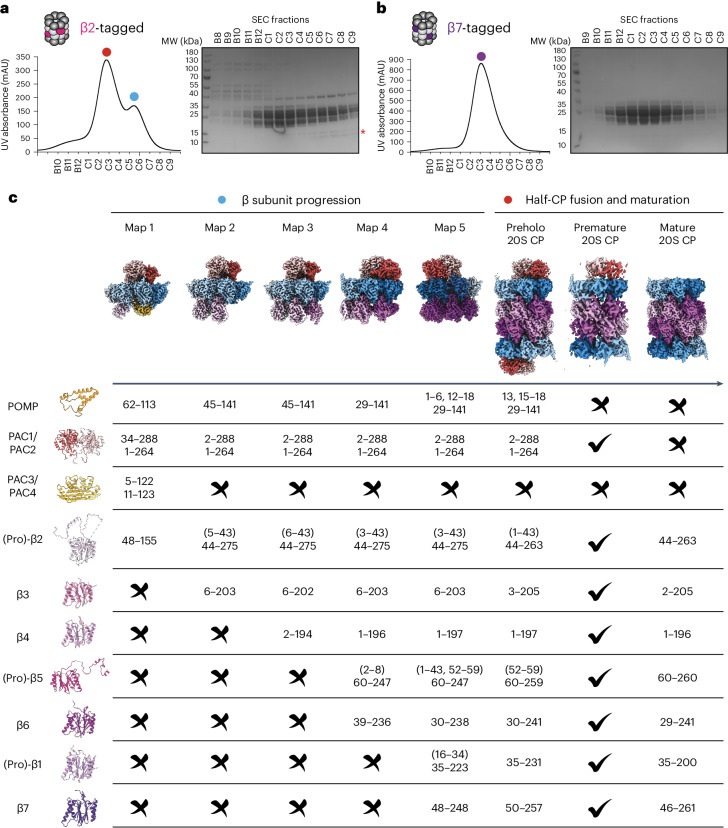
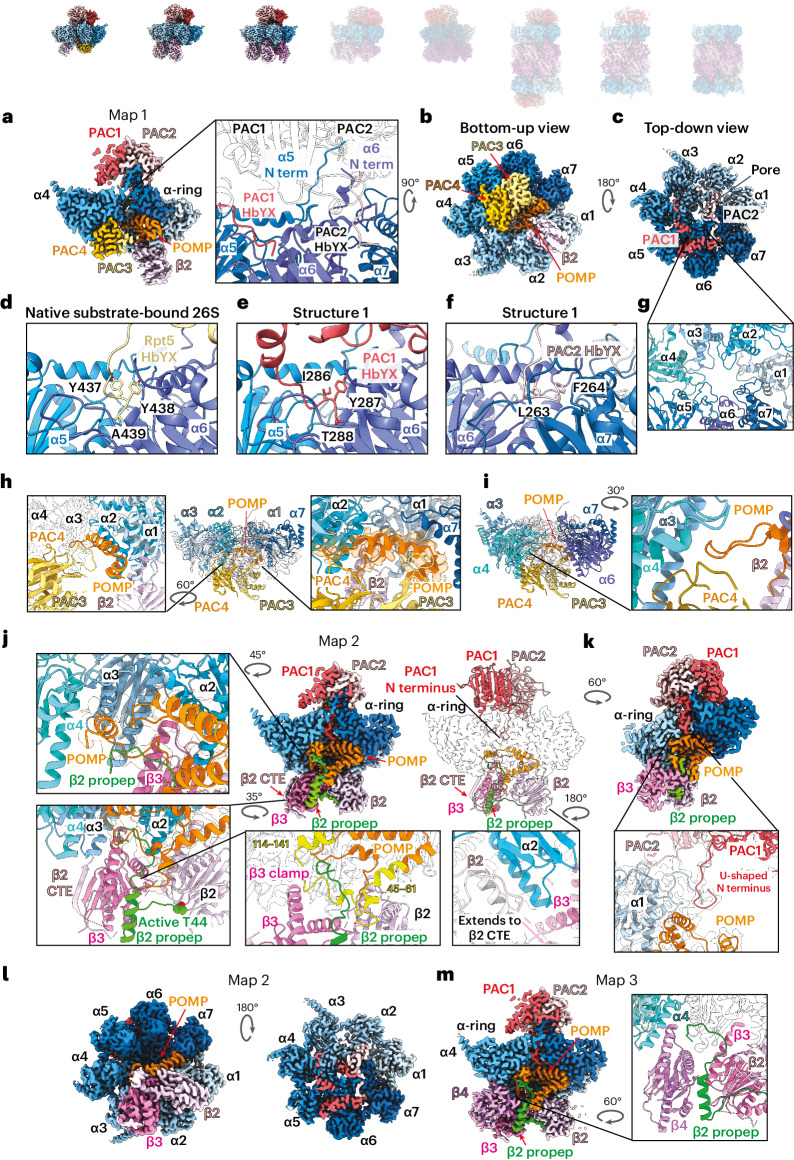
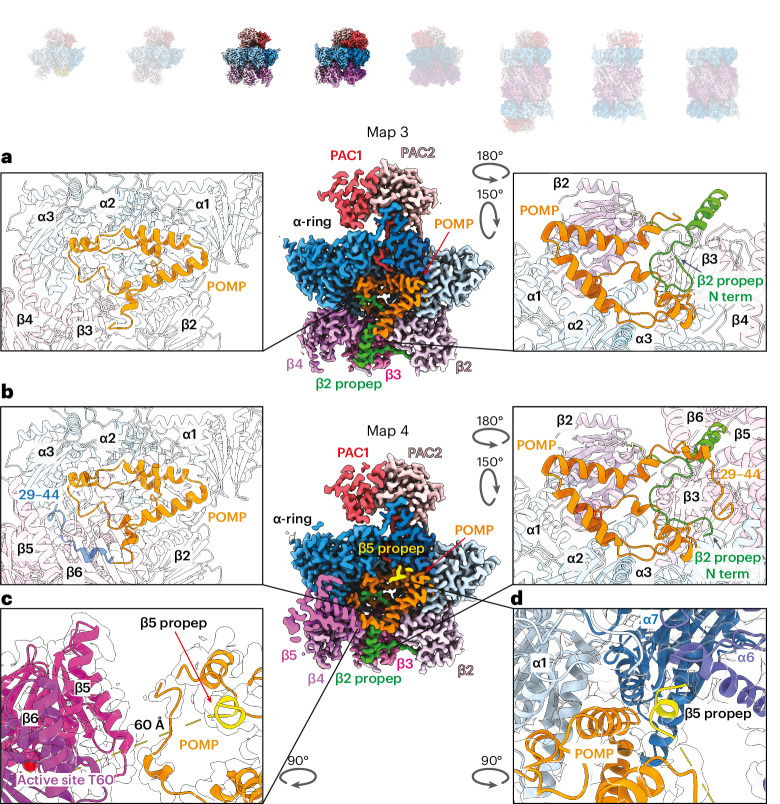
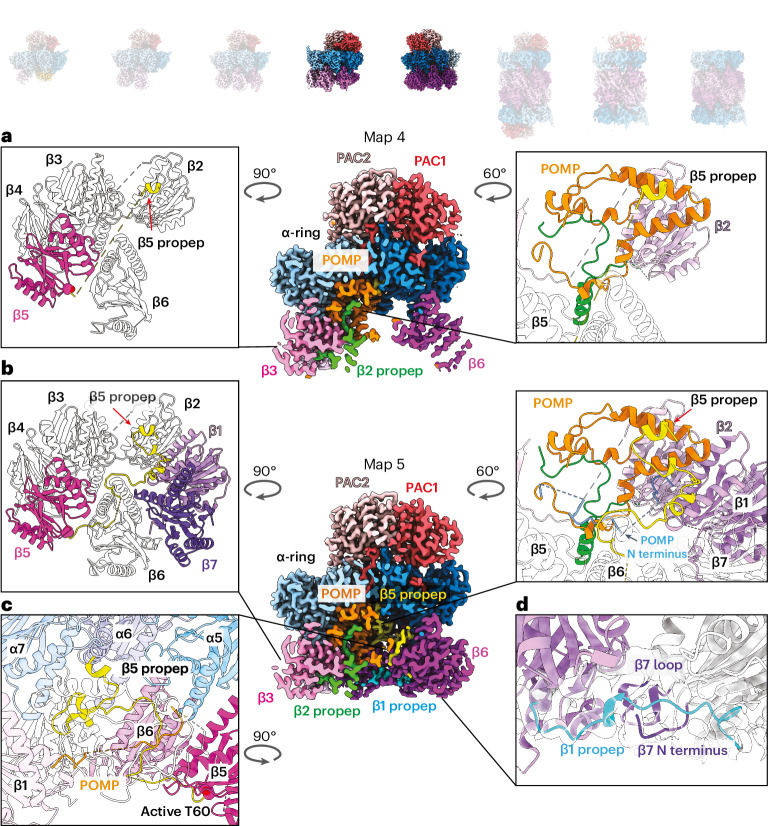
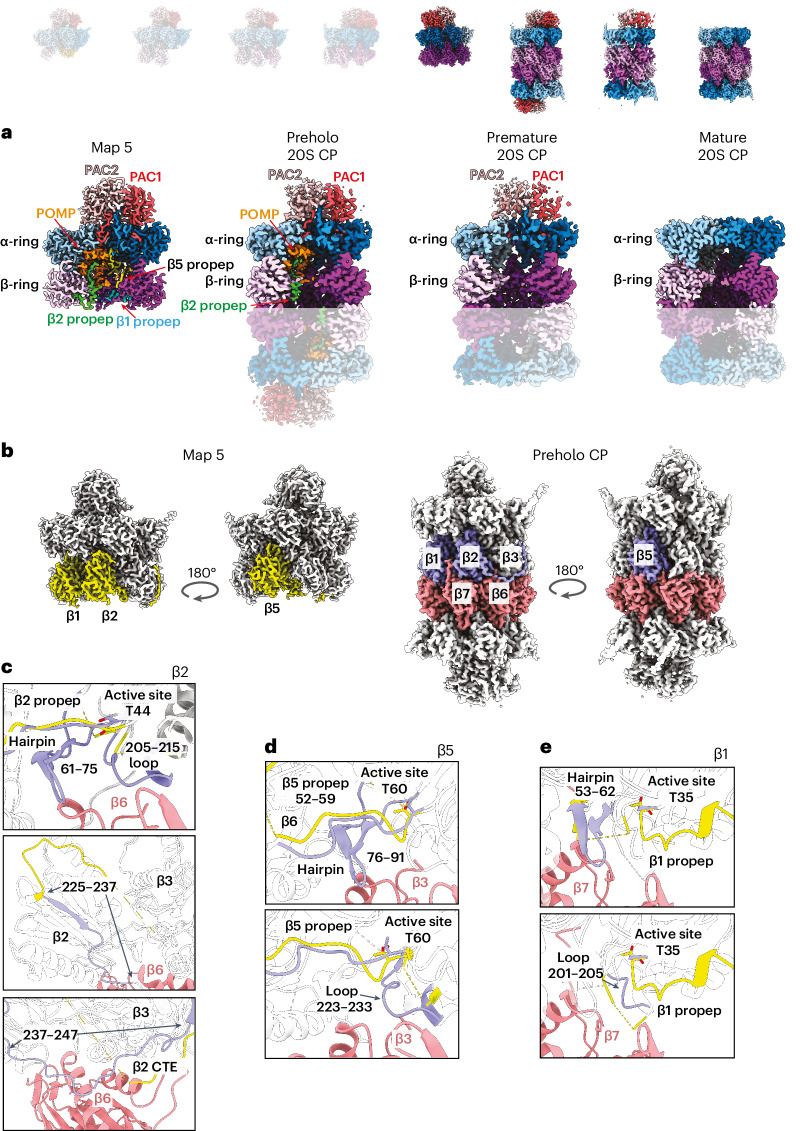
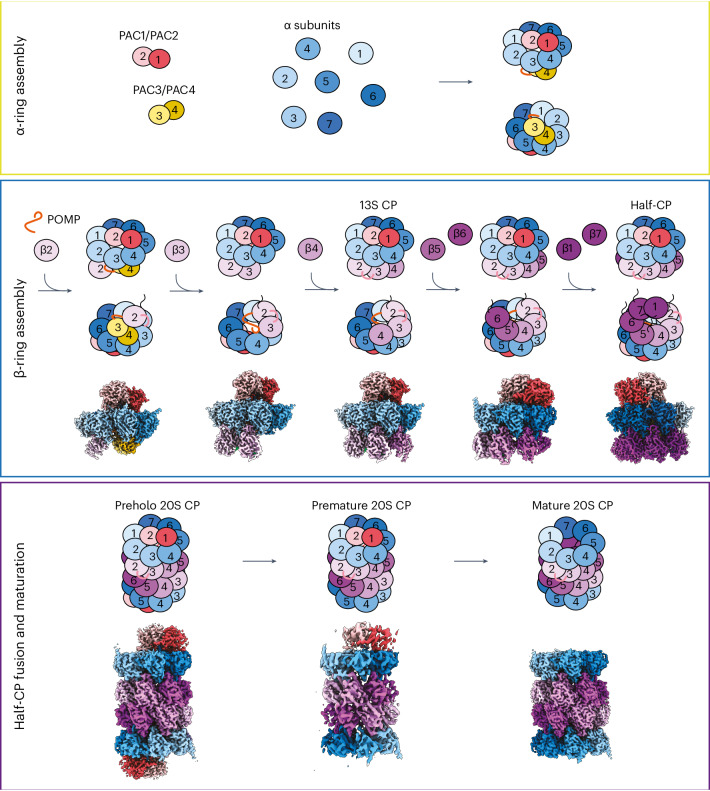
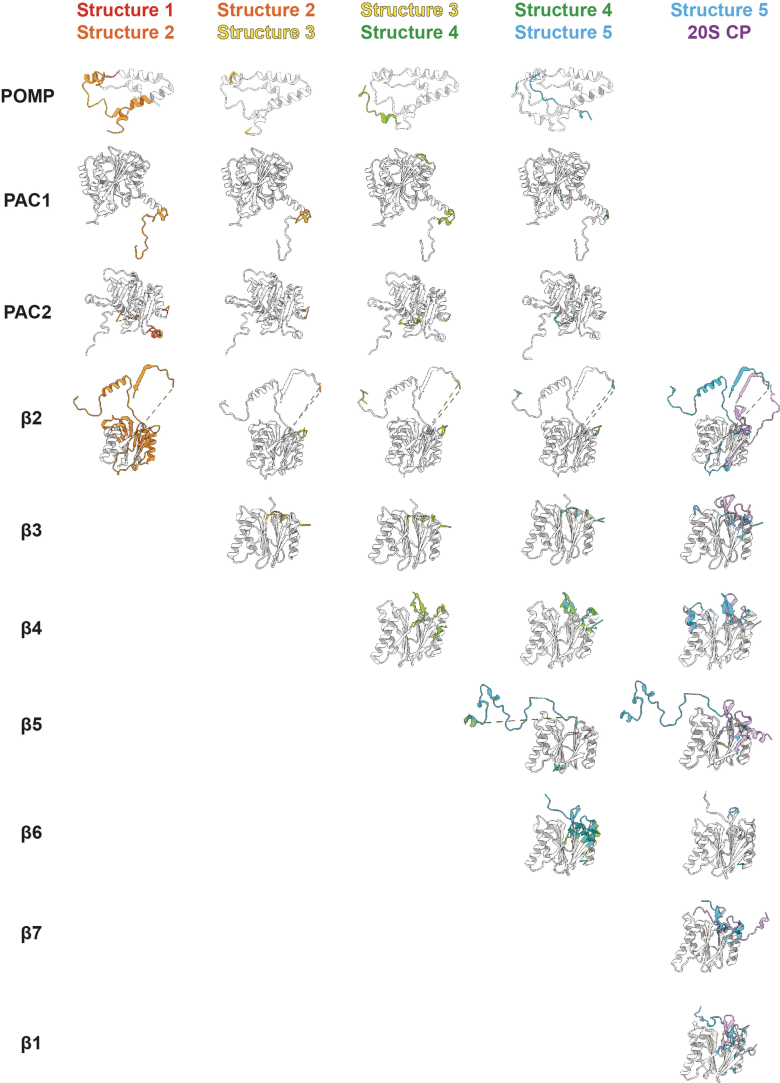
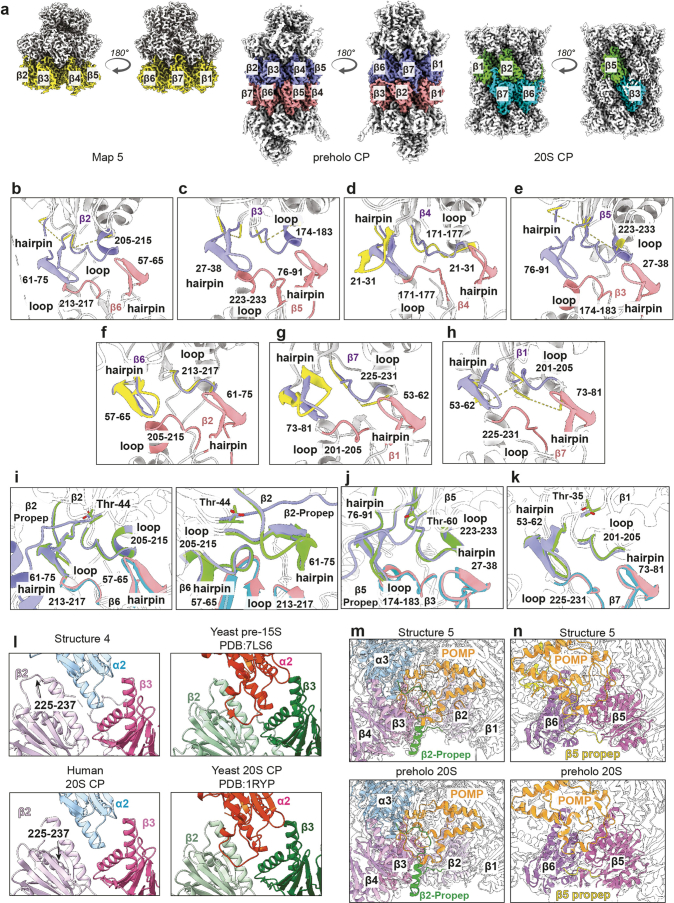
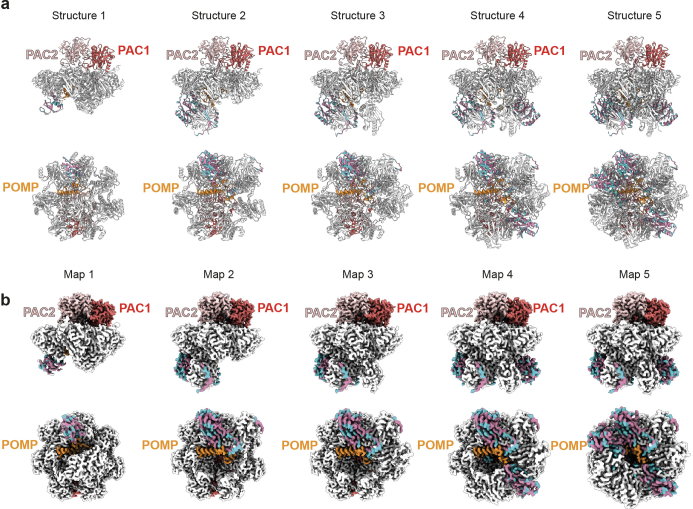
Dedicated assembly factors orchestrate the stepwise production of many molecular machines, including the 28-subunit proteasome core particle (CP) that mediates protein degradation. Here we report cryo-electron microscopy reconstructions of seven recombinant human subcomplexes that visualize all five chaperones and the three active site propeptides across a wide swath of the assembly pathway. Comparison of these chaperone-bound intermediates and a matching mature CP reveals molecular mechanisms determining the order of successive subunit additions, as well as how proteasome subcomplexes and assembly factors structurally adapt upon progressive subunit incorporation to stabilize intermediates, facilitate the formation of subsequent intermediates and ultimately rearrange to coordinate proteolytic activation with gated access to active sites. This work establishes a methodologic approach for structural analysis of multiprotein complex assembly intermediates, illuminates specific functions of assembly factors and reveals conceptual principles underlying human proteasome biogenesis, thus providing an explanation for many previous biochemical and genetic observations.


Conflict of interest statement

J.W.H. is a founder and consultant for Caraway Therapeutics. B.A.S. is on the scientific advisory boards of Biotheryx and Proxygen. The other authors declare no competing interests.

Figures

Fig. 1
Fig. 1. Recombinant expression of human 20S proteasome in insect cells.
a, Purification of recombinant β2-tagged (PSMB7) 20S CP. Eluates were subjected to SEC, and the fractions were analyzed by SDS–PAGE, followed by Coomassie staining. The asterisk indicates bands in the later fractions (corresponding to complexes smaller than a mature 20S CP) of lower molecular weight than proteasome subunits that would correspond to the assembly chaperones PAC1–PAC4 and POMP. Red, blue and purple dots indicate fractions used for cryo-EM, with the later-migrating fraction (blue dot) yielding high-resolution structures 1–5 of 20S CP assembly intermediates and the early fraction (red dot) yielding structures of β2-tagged preholo, premature and mature 20S CP. MW, molecular weight; mAU, milli-absorbance units. b, Purification of recombinant β7-tagged (PSMB4) 20S CP. The single-peak fraction (purple dot) yielded a high-resolution structure of β7-tagged 20S CP. c, Cryo-EM maps of eight distinct CP subcomplexes. Their subunits, the chaperone configurations and the resolved region in each map are indicated. Check marks and cross marks indicate subunits that are visible or absent in the corresponding maps, respectively. Similar results for a and b were obtained in three independent experiments. Source data
Fig. 2
Fig. 2. Structural progression of early assembly intermediates.
Cryo-EM maps of eight distinct CP subcomplexes; opaque images represent complexes described in the figure. a, Cross-section side view of cryo-EM map of structure 1 showing all five assembly chaperones. PAC1/PAC2 are perched atop the α-ring and interact with all α subunits except for α3. term, terminus. b, Bottom-up view of cryo-EM map of structure 1 showing PAC3/PAC4 in the groove between α4–α5 and α5–α6 and β2 in the groove between α1 and α2. c, Top-down view of map 1 showing the interaction of PAC1/PAC2 with the α-ring; the central pore is open. d, Close-up view of the HbYX motif of Rpt5 inserted in between α5 and α6 in native substrate-bound 26S proteasome (PDB 6MSJ). e, Close-up view of the HbYX motif of PAC1 inserted between α5 and α6 in structure 1. f, Close-up view of the HbYX motif of PAC2 inserted between α6 and α7 in structure 1. g, Top-down view of structure 1 (PAC1/PAC2 not shown) showing that the α-ring ‘gate’ is open. h, Side view of structure 1 showing that PAC3/PAC4 interact with α3–α7 of the α-ring. i, Side view of structure 1 showing that POMP interacts with α1–α3 and α7 of the α-ring. j, Cross-section view of cryo-EM map of structure 2 showing that the incorporation of β3 is mutually stabilized by the β2 propeptide (propep) and β2 CTE. Close-up view: the additional POMP N-terminal region interacting with the β2 propeptide and β3. The β2 propeptide is colored green. Most of POMP is colored orange, but the designated regions are yellow. k, Close-up view of the PAC1 N terminus of structure 2 showing its interaction with α1 and POMP. l, Left: bottom-up view of cryo-EM map of structure 2 showing that the release of PAC3/PAC4 liberates grooves between α4–α5 and α5–α6 and that β3 occupies the α2–α3 groove. Right: top-down view showing that the pore is closed. m, Cross-section view of cryo-EM map of structure 3 showing the incorporation of β4 and its interaction with β3 and the α-ring.
Fig. 3
Fig. 3. Distinct structural features upon β5 and β6 incorporation.
Cryo-EM maps of eight distinct CP subcomplexes; opaque images represent complexes described in the figure. a, Cross-section view of cryo-EM map of structure 3 showing PAC1/PAC2, POMP and β2–β4. Left: close-up view of POMP showing its helix–turn–helix configuration and its interactions with the α-ring and β subunits. Right: close-up view revealing the interaction between POMP and the β2 propeptide. b, Cross-section view of cryo-EM map of structure 4 showing PAC1/PAC2, POMP and β2–β5 upon β5 and β6 incorporation (β6 is cropped in the cross-section). Left: close-up view of POMP showing that the additional POMP N-terminal region (blue) is resolved and stabilizes β5 and β6 incorporation. Right: close-up view of the β2 propeptide (green) revealing that the additional resolved POMP N-terminal region interacts with and reorients the N terminus of the β2 propeptide. c, Close-up view of β5, β6 and POMP showing that the additional resolved N-terminal region of POMP interacts with the β5 loop. The β5 propeptide is colored yellow. d, Close-up view of the β5 propeptide showing its interaction with α6, α7, α1 and POMP.
Fig. 4
Fig. 4. Incorporation of β7 and β1 completes the β-ring and reveals propeptides from all proteolytic subunits.
Cryo-EM maps of eight distinct CP subcomplexes; opaque images represent complexes described in the figure. a, Cross-section view of cryo-EM map of structure 4 showing PAC1/PAC2, POMP, β3 and β6 upon β5 and β6 incorporation (β2 is hidden behind, and β4–β5 are cropped in the cross-section). Left: close-up view of β-ring. Right: interaction between β5 propeptide and POMP. The β2 propeptide is colored green, and the β5 propeptide is colored yellow. b, Cross-section view of cryo-EM map of structure 5 showing PAC1/PAC2, POMP, β3 and β6 upon β7 and β1 incorporation (β7 and β1–β2 are hidden behind, and β4–β5 are cropped in the cross-section). Left: close-up view showing that the additional β5 propeptide is resolved upon completion of the β-ring compared to β5 in structure 4. Right: close-up view of the β5 propeptide’s interaction with POMP, β1 and β2 showing that POMP’s N terminus (blue) is resolved upon completion of the β-ring and interacts with the β5 propeptide. The β2 propeptide is colored green, and the β5 propeptide is colored yellow. c, Close-up view of the β5 propeptide’s interaction with α5–α7, β5–β6 and β1. d, Close-up view of newly incorporated β1 and β7 revealing the β1 propeptide and its interaction with the β7 N terminus and loop. The β1 propeptide is colored cyan.
Fig. 5
Fig. 5. Half-CP fusion and 20S CP maturation.
Cryo-EM maps of eight distinct CP subcomplexes; opaque images represent complexes described in the figure. a, Cross-section view of cryo-EM map of structure 5, preholo 20S CP, premature 20S CP and mature 20S CP showing the earlier presence and subsequent absence of assembly chaperones and β propeptides during the 20S CP fusion and maturation process. b, Cryo-EM map of structure 5 with β1, β2 and β5 colored in yellow. Cryo-EM map of preholo 20S CP with β1, β2 and β5 of one half-CP colored in purple and the other half-CP colored in salmon. c, Close-up view of β2’s structural changes (β2 from structure 5 colored in yellow and β2 from preholo 20S CP colored in purple) and interactions with β6 (salmon) from the opposite half-CP upon CP fusion. The active site position is shown and fusion hairpin and fusion loop elements are labeled ‘hairpin’ and ‘loop’, respectively. d, Close-up view of β5’s structural changes (β5 from structure 5 colored in yellow and β5 from preholo 20S CP colored in purple) and interactions with β3 (salmon) from the opposite half-CP upon CP fusion. The active site position is shown and fusion hairpin and fusion loop elements are labeled ‘hairpin’ and ‘loop’, respectively. e, Close-up view of β1’s structural changes (β1 from structure 5 colored in yellow and β1 from preholo 20S CP colored in purple) and interactions with β7 (salmon) from the opposite half-CP upon CP fusion. The active site position is shown and fusion hairpin and fusion loop elements are labeled ‘hairpin’ and ‘loop’, respectively.
Fig. 6
Fig. 6. Schematic representation of chaperone-mediated stepwise assembly of the 20S CP and summary of high-resolution structures of human assembly intermediates.
Top: assembly of the 20S CP through α-ring assembly (yellow outline). Middle: β-ring assembly (blue outline). Bottom: half-CP fusion and maturation (purple outline). High-resolution maps of human CP assembly intermediates presented in this study are indicated below their schematic representations.
Extended Data Fig. 1
Extended Data Fig. 1. Structure determination of recombinant β2-tagged human 20S. proteasome.
a, Cryo-EM image processing scheme for β2-tagged mature human 20S proteasome. b, Angular distribution and GSFSC curves of human 20S proteasome map. c, Local resolution of the cryo-EM map of human 20S proteasome map. d, Structure of recombinant human 20S CP with tag on β2 C terminus. e, Structure of substrate-bound native human 26S proteasome (PDB: 6MSJ, only 20S core particle is shown). f, Cryo-EM image processing scheme for preholo 20S CP and premature 20S CP. g, Angular distribution and GSFSC curves of preholo 20S CP (top) and premature 20S CP (bottom) maps h, Local resolution of the cryo-EM maps of preholo 20S CP (top) and premature 20S CP (bottom). Scale bar in all micrographs represents 15 nm.
Extended Data Fig. 2
Extended Data Fig. 2. Structure determination of recombinant human 20S proteasome and half proteasome with tag on β7.
a, Cryo-EM image processing scheme for human 20S CP and half CP with tag on β7 (indicated by "7" in superscript). b, Angular distribution and GSFSC curves of human 20S CP and half CP with tag on β7. c, Local resolution of the cryo-EM maps of human 20S CP and half CP with tag on β7. Scale bar in all micrographs represents 15 nm.
Extended Data Fig. 3
Extended Data Fig. 3. Structure determination of recombinant human proteasome assembly intermediates.
a, Cryo-EM image processing scheme for the human proteasome assembly intermediates. b, Angular distribution and GSFSC curves of human proteasome assembly intermediates. c, Local resolution of the cryo-EM maps of human proteasome assembly intermediates. Scale bar in all micrographs represents 15 nm.
Extended Data Fig. 4
Extended Data Fig. 4. Particle proportion of 20S assembly intermediates and 20S CP and EM density of assembly chaperones and β propeptides.
a, Particle distribution of 20S assembly intermediates and 20S CP obtained in 4 datasets. b, Model-fitted EM densities of PAC1/2 HbYX motifs. c, Model-fitted EM densities of POMP. d, Model-fitted EM densities of PAC3/4. e, Model-fitted EM densities of β5-propeptide. f, Model-fitted EM densities of β2-propeptide g, Model-fitted EM densities of β1-propeptide. h, Model-fitted EM densities of α subunit N-termini in Map5 and 20S CP. Each pair is globally aligned to show conformational changes at N-termini.
Extended Data Fig. 5
Extended Data Fig. 5. Structural comparison of human 20S CP assembly intermediates with yeast orthologs and 20S CP with 26S proteasome.
a, Comparison of human PAC3/4 (yellow) with yeast Pba3/4 (green, PDB:2Z5C) reveals their structural similarity. b, Comparison of Structure 1 and Structure 5 shows the position of PAC3/4 in Structure 1 is occupied by β4-7 later in Structure 5. c, Comparison of human POMP (orange) with yeast Ump1 (green, PDB:7LSX) reveals their structural similarity. d, Y collar of α-ring in Structure 1 and 2 shows collar of Tyr residues between α-ring subunits stabilizing the open gate conformation. e, Top-down view of Structure 4 and yeast pre-15S structure (PDB:7LS6) shows the N-terminus of PAC1 (red) and Pba1 (hot pink) interacting with α-ring subunits. f, Close-up view of Structure 4 and yeast pre-15S structure (PDB:7LS6) shows the N-terminus of PAC1 (red) interacting with α1 N-terminus and Pba1 (hot pink) interacting with α2 N-terminus. g, Close-up view of Structure 4 and yeast pre-15S structure (PDB:7LS6) shows the N-terminus of PAC1 (red) and Pba1 (hot pink) making close contacts with POMP/Ump1, and β5-propeptide. Close-up cut view of proholo and premature maps shows PAC1 N-terminus visible after half CP fusion.
Extended Data Fig. 6
Extended Data Fig. 6. Structural comparison of α subunits across β-ring formation.
Pairwise structural comparison of α subunits between Structure 1 (red), Structure 2 (orange), Structure 3 (yellow), Structure 4 (green), Structure 5 (blue) and 20S CP (purple). Each subunit is individually aligned for each pair of comparison and only the difference between structures is colored.
Extended Data Fig. 7
Extended Data Fig. 7. Structures of assembly chaperones and β subunits across β-ring formation.
Pairwise structural comparison of assembly factors POMP, PAC1/2 and β subunits between Structure 1 (red), Structure 2 (orange), Structure 3 (yellow), Structure 4 (green), Structure 5 (blue) and 20S CP (purple). Each subunit is individually aligned for each pair of comparison and only the difference between structures is colored.
Extended Data Fig. 8
Extended Data Fig. 8. Fusion-tetrad formed by the fusion hairpins and loops from opposing β subunits upon half CP fusion.
a, Cryo-EM maps of Structure 5, preholo CP, and mature 20S CP with β-subunits colored in yellow, in purple and salmon in the two halves, or in green and cyan in the two halves, respectively. β-subunit coloring is maintained in panels b-k. b, Close-up comparing fusion "hairpin" and "loop" in β2 between Structure 5 and preholo CP where these interlock with fusion "hairpin" and "loop" from β6 from the opposite half-CP. c, Close-up comparing fusion "hairpin" and "loop" in β3 between Structure 5 and preholo CP where these interlock with β5 from the opposite half-CP. d, Close-up comparing fusion "hairpin" and "loop" in β4 between Structure 5 and preholo CP where these interlock with β4 from the opposite half-CP. e, Close-up comparing fusion "hairpin" and "loop" in β5 between Structure 5 and preholo CP where these interlock with β3 from the opposite half-CP. f, Close-up comparing fusion "hairpin" and "loop" in β6 between Structure 5 and preholo CP where these interlock with β2 from the opposite half-CP. g, Close-up comparing fusion "hairpin" and "loop" in β7 between Structure 5 and preholo CP where these interlock with β1 from the opposite half-CP. h, Close-up comparing fusion "hairpin" and "loop" in β1 between Structure 5 and preholo CP where these interlock with β7 from the opposite half-CP. i, Close-up comparing preholo CP and mature 20S CP fusion "hairpins" and "loops" interlocking between β2 in one half CP and β6 from the opposite half. j, Close-up comparing preholo CP and mature 20S CP fusion "hairpins" and "loops" interlocking between β5 in one half CP and β3 from the opposite half. k, Close-up comparing preholo CP and mature 20S CP fusion "hairpins" and "loops" interlocking between β1 in one half CP and β7 from the opposite half. l, Close-ups showing distinct α2 loop and trajectory of β2 C-terminal loop between human and yeast, as shown in Structure 4 and yeast pre-15S (PDB:7LS6), respectively. m, Close-ups comparing β2-propeptide interactions in Structure 5 and in preholo-20S CP. n, Close-ups comparing β5-propeptide interactions in Structure 5 and preholo-20S CP.
Extended Data Fig. 9
Extended Data Fig. 9. Sequence conservation between constitutive proteasome and immunoproteasome subunits mapped on Structures and Maps 1 to 5.
a, Structures 1 through 5 are shown from left to right in two views. β2, β5, and β1 subunits are colored based on sequence conservation with their counterparts in the immunoproteasome (sequence identity in maroon, divergence in cyan). PAC1/2 and POMP are colored brick red, salmon, and orange, respectively. b, Same as a, except showing the cryo-EM maps.

Update of

Similar articles

Cited by

References

    1. Lowe, J. et al. Crystal structure of the 20S proteasome from the archaeon T. acidophilum at 3.4 Å resolution. Science268, 533–539 (1995). 10.1126/science.7725097 - DOI - PubMed
    1. Groll, M. et al. Structure of 20S proteasome from yeast at 2.4 Å resolution. Nature386, 463–471 (1997). 10.1038/386463a0 - DOI - PubMed
    1. Groll, M. et al. A gated channel into the proteasome core particle. Nat. Struct. Mol. Biol.7, 1062–1067 (2000).10.1038/80992 - DOI - PubMed
    1. Arendt, C. S. & Hochstrasser, M. Identification of the yeast 20S proteasome catalytic centers and subunit interactions required for active-site formation. Proc. Natl Acad. Sci. USA94, 7156–7161 (1997). 10.1073/pnas.94.14.7156 - DOI - PMC - PubMed
    1. Unno, M. et al. The structure of the mammalian 20S proteasome at 2.75 Å resolution. Structure10, 609–618 (2002). 10.1016/S0969-2126(02)00748-7 - DOI - PubMed

MeSH terms

Substances

LinkOut - more resources