. 2024 May;25(5):2202-2219.
doi: 10.1038/s44319-024-00131-8. Epub 2024 Apr 10.

Foxp1 suppresses cortical angiogenesis and attenuates HIF-1alpha signaling to promote neural progenitor cell maintenance

Affiliations

Foxp1 suppresses cortical angiogenesis and attenuates HIF-1alpha signaling to promote neural progenitor cell maintenance

Jessie E Buth et al. EMBO Rep. 2024 May.

Abstract

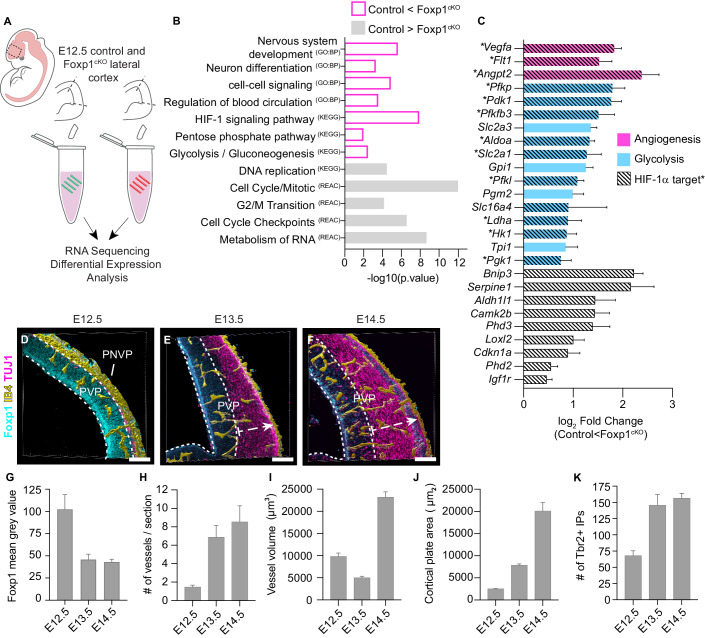
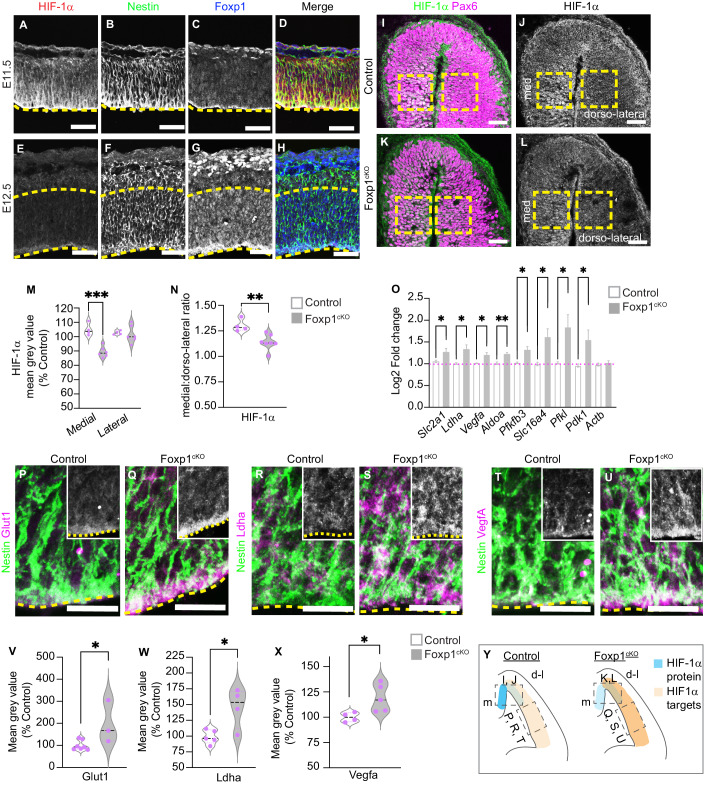
Neural progenitor cells within the cerebral cortex undergo a characteristic switch between symmetric self-renewing cell divisions early in development and asymmetric neurogenic divisions later. Yet, the mechanisms controlling this transition remain unclear. Previous work has shown that early but not late neural progenitor cells (NPCs) endogenously express the autism-linked transcription factor Foxp1, and both loss and gain of Foxp1 function can alter NPC activity and fate choices. Here, we show that premature loss of Foxp1 upregulates transcriptional programs regulating angiogenesis, glycolysis, and cellular responses to hypoxia. These changes coincide with a premature destabilization of HIF-1α, an elevation in HIF-1α target genes, including Vegfa in NPCs, and precocious vascular network development. In vitro experiments demonstrate that stabilization of HIF-1α in Foxp1-deficient NPCs rescues the premature differentiation phenotype and restores NPC maintenance. Our data indicate that the endogenous decline in Foxp1 expression activates the HIF-1α transcriptional program leading to changes in the tissue environment adjacent to NPCs, which, in turn, might alter their self-renewal and neurogenic capacities.

Keywords: Angiogenesis; Autism; Corticogenesis; HIF-1 Signaling; Neurodevelopment.


Conflict of interest statement

The authors declare no competing interests.

Figures

Figure 1
Figure 1. Processes regulating angiogenesis, HIF-1 signaling, and glycolysis are upregulated upon conditional removal of Foxp1.
(A) RNA collected from E12.5 control and Foxp1cKO cortices. (B) Gene ontology terms associated with significantly misregulated genes in the Foxp1cKO cortex at E12.5. GO terms: BP, biological process; KEGG, pathways, REAC, reactome pathway. (C) Significantly misregulated genes associated with angiogenesis (magenta), glycolysis (blue), and HIF-1α signaling (white/hashed lines) in Foxp1cKOs at E12.5. * and bars with hashed lines are also HIF-1α targets. (DF) 3D surface rendering of IB4+ blood vessels in the cortex from E12.5 to E14.5 with Foxp1 and TUJ1 expression. White dashed arrows delineate cortical plate. (GJ) Foxp1 intensity, periventricular plexus vessel (PVP) number, volume, and cortical plate area in the lateral cortex at E12.5–E14.5. (K) Number of Tbr2+ progenitors (per 200 μm2) in wild-type cortex at E12.5–E14.5. Scale bars 100 μm. Data information: Statistical significance determined by ANOVA (B, C). N = 4 controls, 2 mutants (B, C). N = 5 (G), 4 (H), 3–4 (I), 3–4 (J), 3–4 (K) embryos/time point. All data represented as mean ± SEM. Source data are available online for this figure.
Figure 2
Figure 2. HIF-1α expression is reduced, and HIF-1α targets are upregulated in RG in the absence of Foxp1.
(AH) IHC analysis of HIF-1α and Foxp1 in Nestin+ RG at E11.5 and E12.5 wild-type cortex. (IL) IHC analysis of Pax6 and HIF-1α expression in the medial and dorsolateral cortex at E12.5 in control and Foxp1cKO mutants. Boxed areas indicate regions quantified in (M) and (N). (M, N) HIF-1α mean gray value (percent control) and medial to dorsal ratio in control and Foxp1cKO mutant cortex at E12.5. (O) Quantification of mRNA fold enrichment (normalized to Actb) for Slc2a1, Ldha, Vegfa, Aldoa, Pfkfb3, Slc16a4, Pfkl, Pdk1, and Actb in control and Foxp1cKO by qPCR in the lateral cortex at E12.5. (PU) IHC for Glut1, Ldha, Vegfa, and Nestin in control and Foxp1cKO mutants in the VZ of the cortex at E12.5. The inset is Glut1/Ldha/Vegfa only. (V) Glut1 mean gray value (percent control) in control and Foxp1cKO mutant Nestin+ RG at E12.5. (W) Ldha mean gray value (percent control) in control and Foxp1cKO cortex at E12.5. (X) Vegfa mean gray value (percent control) in control and Foxp1cOn cortex at E12.5. (Y) Summary of HIF-1α and target gene expression in control and Foxp1cKO cortex at E12.5. Dashed lines demarcate the ventricular zone. Scale bars 50 μm (AL), 20 μm (PU). Data information: p = 0.0003 and 0.0055, respectively, Student’s t-test. N = 7 control, 6 mutants (M, N). N = 3 control, 3 mutants (3 litters). p values = 0.039 (Slc2a1), 0.0256 (Ldha), 0.013 (Vegfa), 0.0073 (Aldoa), 0.0177 (Pfkfb3), 0.0152 (Slc16a4), 0.0183 (Pfkl), 0.0392 (Pdk1). Student’s t-test (O). p = 0.0262, Student’s t-test. N = 7 control, 3 mutants (V). p = 0.0169, Student’s t-test. N = 5 control, 4 mutants (W). p = 0.0328, Students t-test. N = 4 control, 5 mutants (X). All data represented as mean ± SEM. Source data are available online for this figure.
Figure 3
Figure 3. Loss of Foxp1 results in precocious development of the cortical vasculature.
(A, B) Isolectin B4 (IB4) vessel staining in the cortex of control and Foxp1cKO embryos at E12.5. (C, D) Surfaced rendered contiguous vessels in (A) and (B). (E) Number of IB4+ vessels in each binned area in control and Foxp1cKO lateral cortices at E12.5. (F) Schematic of bins used for quantification in (E). (G, H) IB4 labeled filopodia at the ventricular surface in control and Foxp1cKO cortex at E12.5. Arrowheads mark filopodia. (IJ) IB4+ vessels in control and Foxp1cKO cortex at E13.5. (K, L) Surface rendered cortex images in control and Foxp1cKO at E13.5. (M) Mean filopodia (percent control) in control and Foxp1cKO cortex at E12.5. (NP) Vessel length, vessel volume, and number of branches per vessel in control and Foxp1cKO cortex. Dashed yellow lines demarcate the apical surface. d, dorsal; v, ventral. Scale bars 100 μm (AD), 5 μm (G, H), and 50 μm (IL). Data information: p < 0.0001, Mann–Whitney test. N = 10 control, 7 mutants (E). p = 0.0033, Student’s t-test. N = 12 control, 6 mutants (M). p = 0.0386, 0.0235, and 0.0063, respectively, Student’s t-test. N = 6 control, 7 mutants (NP). All data represented as mean ± SEM. Source data are available online for this figure.
Figure 4
Figure 4. HIF-1α stabilization promotes NPC maintenance in Foxp1-deficient cortical spheroids.
(A) Western blot analysis of Foxp1 and GAPDH protein in control and Foxp1KO mouse embryonic stem cells. (B) Western blot analysis and quantification of HIF-1α protein (compared to α-tubulin) in control and Foxp1KO spheroids at 10 div treated with DMSO or VH298. (C) qPCR analysis of HIF-1α target gene expression in control and Foxp1KO#1 spheroids at 10 div. (D) qPCR analysis of HIF-1α target gene expression in control and Foxp1KO#1 spheroids at 10 div. treated with DMSO or VH298. (EJ) IHC for Pax6+ NPCs and Ctip2+ neurons in control and Foxp1KO spheroids (10 div) treated with DMSO or VH298. (K) Percentage of DAPI+ cells that are Pax6+ in control and Foxp1KO spheroids (10 div) treated with DMSO or VH298. (L) Percentage of DAPI+ cells that are Ctip2+ in control and Foxp1KO spheroids (10 div) treated with DMSO or VH298. (M) Schematic of control and Foxp1cKO phenotypes. Foxp1 attenuates the HIF-1α signaling pathway to promote RG self-renewal. In the absence of Foxp1, HIF-1α target gene expression is upregulated, angiogenesis is perturbed, and RG precociously differentiate. Scale bars 100 μm. Data information: p = **0.0097, 0.00364 (Foxp1KO#1) and 0.0162 (Foxp1KO#2). Student’s t-test. N = 10–12 spheroids, western blots run in triplicate (B). p values = 0.0008 (Slc2a1), <0.0001 (Ldha), 0.0026 (Vegfa), 0.0010 (Aldoa), <0.0001 (Pdk1), <0.001 (Pfkl), 0.0061 (Pfkfb3, Mann–Whitney test), 0.0001 (Slc16a4). N = 10–12 spheroids/experiment, 3 experiments (C). p values = <0.0001 (Slc2a1, control), 0.0013 (Ldha, control), 0.0446 (Ldha, Foxp1KO#1), 0.0002 (Vegfa, control), 0.0179 (Aldoa, control), 0.0002 (Pdk1, control), 0.0201 (Pkfl, control), 0.0003 (Slc16a4, control). N = 10–12 spheroids/experiment, 3 experiments (D). One-way ANOVA, p = >0.9999, <0.0001, 0.928, 0.0024 and 0.1066, respectively. N = 10–12 spheroids/experiment, 3 experiments (K). Ordinary one-way ANOVA, p = >0.9999, <0.0001, 0.8306, 0.0196, 0.9883. N = 10–12 spheroids/experiment, 3 experiments (L). All data represented as mean ± SEM. Source data are available online for this figure.
Figure EV1
Figure EV1. RNA Seq analysis of Foxp1cKO cortex.
(A) Volcano plot of gene expression changes in the absence of Foxp1 in E12.5 lateral cortex compared to control embryos. Gray circles denote non-significant gene changes (adjusted p-value > 0.05); red circles denote significantly differentially expressed genes (adjusted p-value < 0.05). (B) Human disorders associated with genes significantly misregulated in Foxp1cKO mutants at E12.5. (C) The principal component analysis (PCA) of control and Foxp1cKO mutants shows PC1 and PC2. (DF) IHC for Tbr2+ intermediate progenitors in wild-type cortex at E12.5, E13.5, and E14.5. Schematic denotes area image in (DF). Scale bars 50 μm. Data information: significance determined by ANOVA (A, B).
Figure EV2
Figure EV2. HIF-1α target gene expression in RG in the wild-type cortex.
(AG) Wild-type mRNA expression of glycolysis genes Slc2a1, Ldha, Aldoa, Pfkl, Pfkfb3, Pdk1, and Slc16a4 in the wild-type lateral cortex at E12.5. (H) Western blot analysis of HIF-1α, Glut1, Ldha, and Vegfa (with Beta Actin) in wild-type cortical lysates at E11.5, E12.5, E13.5. (I) Fold change of HIF-1α levels normalized to Beta Actin between E11.5 and E13.5. (J) Fold change of Glut1 levels normalized to Beta Actin between E11.5 and E13.5. (K) Fold change of Ldha levels normalized to Beta Actin between E11.5 and E13.5. (L) Fold change of Vegfa levels normalized to Actin between E11.5 and E13.5. (M, N) IHC for Glut1 and Ldha with Isolectin B4, and Nestin at E12.5 in the wild-type cortex. (O, P) IHC for Glut1 or Ldha with Isolectin B4, and Nestin at E13.5 in the wild-type cortex. Boxed areas are magnified in (QX). (QT) High magnification image of IHC for Glut1 in Nestin+ RG at E12.5. Isolectin B4 labels blood vessels. (UX) High magnification images of IHC for Ldha in Nestin+ RG at E13.5. Isolectin B4 labels blood vessels. Scale bars 50 μm (AK), 10 μm (LS). Data information: N = 5–9 embryos per time point, 3–6 replicates. p = 0.0039 and 0.0073 (I). N = 5–9 embryos per time point, 3 replicates. p = 0.0028 (J). N = 5–9 embryos per time point, 6 replicates. p = 0.0041 (K). N = 5–9 embryos per time point, 6 replicates. p = 0.0017 (L). All Student’s t-tests. All data represented as mean ± SEM. Source data are available online for this figure.
Figure EV3
Figure EV3. Spatial and temporal relationship between Foxp1 and Vegfa in radial glia and neurons.
(AC) RNA Scope analysis of Vegfa and Foxp1 in the wild-type cortex at E12.5–E14.5. (D) Vegfa mean gray value (over background) in the ventricular zone between E12.5–E14.5. (EG) IHC for Vegfa and Nestin in the wild-type cortex at E12.5, E13.5, and E14.5. (HK) High magnification images of Vegfa, Nestin, and IB4 at the apical surface of the VZ at E13.5. (LS) High magnification images of IHC for Vegfa, Nestin, and Foxp1 at E12.5 and E14.5 in wild-type cortex. (TU) IHC for Vegfa in the cortex at E12.5 in control and Foxp1cKO embryos. Cyan boxes represent areas in CP magnified in T,’ and U.’ Magenta boxes represent the area within VZ magnified in T” and U”. (V) Quantification of Vegfa mean gray values in the cortical plate in control and Foxp1cKO cortex at E12.5. Scale bars 50 μm (AG, T, U) 10 μm (HS). Data information: N = 5–7 embryos per time point (D). N = 3 control, 6 mutant (2 litters). p = 0.8674, Student’s t-test (V). All data represented as mean ± SEM.
Figure EV4
Figure EV4. Analysis of Foxp1-deficient cortical spheroids.
(AC) IHC for Pax6 in control and Foxp1KO spheroids at 7 days in vitro (div). (DF) IHC for Ctip2 and Tbr1+ neurons in control and Foxp1KO spheroids at 7 div. (G) qPCR analysis of HIF-1α target gene expression in control and Foxp1KO#2 spheroids at 10 div. (HP) IHC for Foxp1 in Pax6+ NPCs in control and Foxp1KO spheroids at 10 div. (Q) qPCR analysis of HIF-1α target gene expression in control and Foxp1KO#2 spheroids at 10 div. treated with DMSO or VH298. Scale bars 100 μm (AF), 50 μm (HP). Data information: N = 10–12 spheroids from 3 individual batches. p = 0.0007 (Slc2a1), 0.0108 (Ldha), 0.0031 (Vegfa), 0.0009 (Aldoa), 0.0002 (Pdk1), 0.0002 (Pfkl), 0.0226 (Pfkfb3), <0.0001 (Slc16a4). Student’s t-test (G). p = <0.0001 (Slc2a1, control), 0.0013 (Ldha, control) <0.0001 (Vegfa, control), 0.0179 (Aldoa, control) 0.0002 (Pdk1, control), 0.0312 (Pdk1, Foxp1KO#2), 0.0201 (Pfkl, control), 0.0003 (Slc16a4, control). Student’s t-test (Q). All data represented as mean ± SEM.

References

    1. Anders S, Pyl PT, Huber W. HTSeq—a Python framework to work with high-throughput sequencing data. Bioinformatics. 2015;31(2):166–169. doi: 10.1093/bioinformatics/btu638. - DOI - PMC - PubMed
    1. Andrews MG, Pearson CA (2024) Toward an understanding of glucose metabolism in radial glial biology and brain development. Life Sci Alliance 7. 10.26508/lsa.202302193 - PMC - PubMed
    1. Andrews S (2010) FastQC: a quality control tool for high throughput sequence data. Preprint at http://www.bioinformatics.babraham.ac.uk/projects/fastqc
    1. Azmitia EC, Saccomano ZT, Alzoobaee MF, Boldrini M, Whitaker-Azmitia PM. Persistent angiogenesis in the autism brain: an immunocytochemical study of postmortem cortex, brainstem and cerebellum. J Autism Dev Disord. 2016;46(4):1307–1318. doi: 10.1007/s10803-015-2672-6. - DOI - PMC - PubMed
    1. Bagnall J, Leedale J, Taylor SE, Spiller DG, White MRH, Sharkey KJ, Bearon RN, Sée V. Tight control of hypoxia-inducible factor-α transient dynamics is essential for cell survival in hypoxia. J Biol Chem. 2014;289(9):5549–5564. doi: 10.1074/jbc.M113.500405. - DOI - PMC - PubMed

MeSH terms