. 2024 May;629(8010):201-210.
doi: 10.1038/s41586-024-07242-1. Epub 2024 Apr 10.

FOXO1 enhances CAR T cell stemness, metabolic fitness and efficacy

Affiliations

FOXO1 enhances CAR T cell stemness, metabolic fitness and efficacy

Jack D Chan et al. Nature. 2024 May.

Abstract

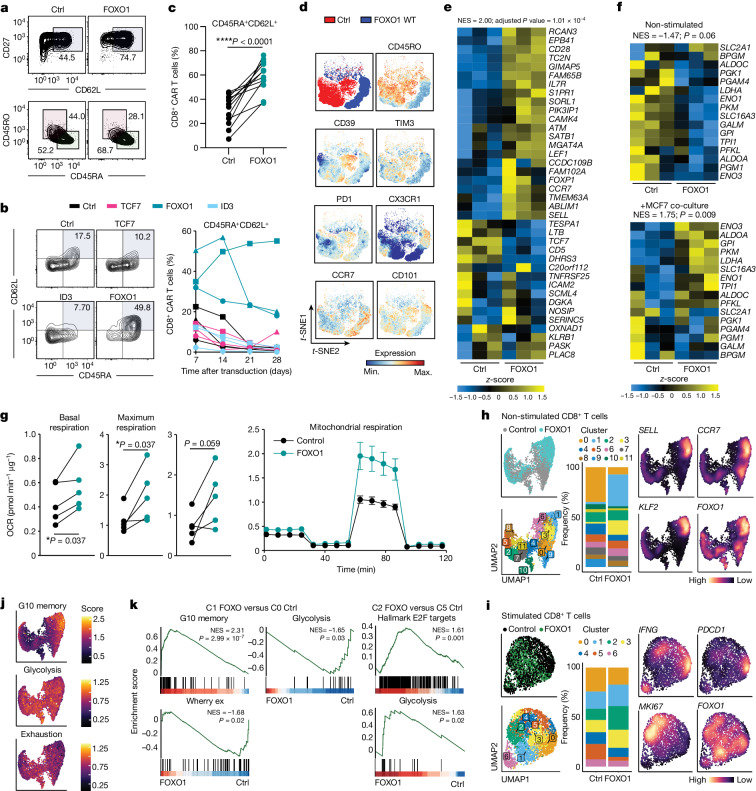
Chimeric antigen receptor (CAR) T cell therapy has transformed the treatment of haematological malignancies such as acute lymphoblastic leukaemia, B cell lymphoma and multiple myeloma1-4, but the efficacy of CAR T cell therapy in solid tumours has been limited5. This is owing to a number of factors, including the immunosuppressive tumour microenvironment that gives rise to poorly persisting and metabolically dysfunctional T cells. Analysis of anti-CD19 CAR T cells used clinically has shown that positive treatment outcomes are associated with a more 'stem-like' phenotype and increased mitochondrial mass6-8. We therefore sought to identify transcription factors that could enhance CAR T cell fitness and efficacy against solid tumours. Here we show that overexpression of FOXO1 promotes a stem-like phenotype in CAR T cells derived from either healthy human donors or patients, which correlates with improved mitochondrial fitness, persistence and therapeutic efficacy in vivo. This work thus reveals an engineering approach to genetically enforce a favourable metabolic phenotype that has high translational potential to improve the efficacy of CAR T cells against solid tumours.


Conflict of interest statement

P.A.B. declares research funding from AstraZeneca, Bristol-Myers-Squibb and Gilead Sciences. P.K.D. declares research funding from Myeloid Therapeutics, Prescient Therapeutics, Bristol-Myers-Squibb and Juno Therapeutics. J. Lai is a present employee at oNKo-Innate. S.J.H. declares consultancy fees and honoraria from Celgene, Janssen Cilag and Novartis; declares research funding from Celgene, Janssen Cilag, Novartis and Haemalogix; was an investigator on studies for Celgene, Janssen Cilag, Novartis and Haemalogix; and has served on the advisory board for Celgene, Janssen Cilag, Novartis and Haemalogix. I.A.P. declares research funding from Bristol-Myers-Squibb and Astrazeneca. The other authors declare no competing interests.

Figures

Fig. 1
Fig. 1. FOXO1-ADA overexpression enhances therapeutic activity of CAR T cells.
a, Schematic for in vivo experiments. i.v., intravenous injection. b,c, Treatment of subcutaneous MC38-HER2 (b) or mammary fat pad E0771-HER2 (c) tumours. Tumours were established in mice for 5 to 7 days prior to treatment with two doses of 1 × 107 indicated CAR T cells administered on subsequent days. Tumour growth is represented as mean tumour size of n = 10 (control), n = 11 (TCF7, FOXO1-ADA) and n = 12 (untreated) (b) or n = 17 (untreated) and n = 18 (control, TCF7, FOXO1-ADA, ID3) (c) mice per group ± s.e.m. from 3 pooled experiments. Two-way ANOVA. *P < 0.05, **P < 0.01, ***P < 0.001, ****P < 0.0001. Source Data
Fig. 2
Fig. 2. FOXO1-ADA overexpression enhances in vivo polyfunctionality and metabolic fitness.
a,b,d,e,gj, Tissues from E0771-HER2 tumour-bearing mice were analysed nine days after treatment. a,b,d,e, Flow cytometry analysis of tumour-infiltrating CAR T cells. 2A3, isotype control antibody; ctrl, control; MFI, mean fluorescence intensity. a, Frequency of tumour-infiltrating CD8+ CAR T cells expressing IFNγ and TNF. Top, combined samples. Bottom, data from individual mice. b, Frequency of CAR T cells expressing 0, 1, 2 or 3 effector proteins (IFNγ, TNF or GZMB). c, MC38-HER2 tumour growth in mice treated as in Fig. 1. Indicated mice were co-treated with anti-IFNγ. d,e, MDR and MG staining of CD8+ CAR T cells. d, Combined samples. e, Individual mice. f, Heat map for genes in the oxidative phosphorylation Hallmark pathway of CD8+ CAR T cells at 72 h after anti-CAR stimulation. NES, normalized enrichment score. gj, Flow cytometry analysis of CAR T cells associated with tumour, dLN or non-draining lymph node (ndLN). Number of total (g) or CXCR3+CD62L+ (h) tumour dLN-resident CD8+ CAR T cells. i, Paired analysis of CAR T cell numbers in the ndLN and dLN of n = 11 mice per group. LN, lymph node. j, Correlation of number of tumour dLN-resident CD8+ CAR T cells with frequency of IFNγ+TNF+ intratumoral CD8+ CAR T cells. a,b,e,g,h, Data are mean ± s.e.m. from n = 10 (a), n = 12 (b), n = 8 (control, FOXO1-ADA), n = 10 (TCF7) or n = 11 (ID3) (e), n = 7 (non-treatment (NT), FOXO1-ADA, ID3), n = 6 (control), n = 8 (TCF7) (g), n = 5 (control), n = 8 (TCF7, FOXO1-ADA), n = 7 (ID3) (h) mice pooled from two independent experiments. Two-sided, one-way ANOVA. c, Data are mean ± s.e.m. of indicated number of mice. Two-way ANOVA. i, Two-sided, paired t-test. j, Number of mice as indicated. Simple linear regression analysis. Source Data
Fig. 3
Fig. 3. FOXO1 overexpression enhances the stemness and metabolic fitness of human CAR T cells.
Analysis of human CD8+CAR+ T cells expressing mCherry (ctrl), FOXO1, TCF7 or ID3. a, Proportion of CD62L+CD27+ or CD45RA+ CAR T cells. b, Proportion of CD8+CAR+ T cells with a CD45RA+CD62L+ phenotype. Left, representative staining (day 14 post-transduction). Right, time course analysis. Different shapes represent individual donors. c, Paired analysis from 12 individual experiments. d, t-Distributed stochastic neighbour embedding (t-SNE) plot of indicated cell surface markers. Max., maximum; min., minimum; WT, wild type. e,f, CD8+CAR+ T cells were analysed by RNA-seq before and after activation with MCF7 tumour cells. n = 3 biological replicates. e, Heat map depicting the 38 genes with highest differential expression in the G10 memory cluster identified by Sade-Feldmann et al.. f, expression of glycolysis-related genes before and after co-culture with MCF7 tumour cells. g, Analysis of CAR T cell oxidative consumption by Seahorse MitoStress assay. Data represent paired analysis from n = 5 independent donors (left) or mean ± s.e.m. of n = 3 technical replicates of a representative donor (right). OCR, oxygen consumption rate. hk, Control or FOXO1-expressing CAR T cells were left unstimulated or were stimulated for 16 h with MCF7 tumour cells and then analysed by single-cell RNA-seq (scRNA-seq). h,i, Uniform manifold approximation and projection (UMAP) plots, cell cluster composition and density plots showing expression of indicated genes of non-stimulated (h) and stimulated (i) CD8+CAR T cells. j, Visualization of gene signatures scores (SingleCellSignature) of memory, glycolysis and exhaustion gene sets in non-stimulated CD8+ CAR T cells. k, Gene set enrichment analysis for indicated pathways comparing FOXO1-expressing CAR T cells in cluster 1 to control CAR T cells within cluster 0 (non-stimulated clusters) or FOXO1-expressing CAR T cells in cluster 2 to control CAR T cells in cluster 5 (stimulated clusters). Two-sided, paired t-test (c,g). Source Data
Fig. 4
Fig. 4. FOXO1 overexpression induces an epigenetic landscape that promotes CAR T cell stemness but does not preclude effector-like transition upon CAR T cell activation.
Human FOXO1 or control CAR T cells generated as in Fig. 3 were analysed by ATAC-seq 7 days after generation with no stimulation or after 16 h co-culture with MCF7 tumour cells at a 1:1 ratio. CD8+ CAR T cells were purified by fluorescence-activated cell sorting (FACS) prior to analysis. The experiment was performed in n = 3 biological replicates. a, Differential peak analysis of non-stimulated control or FOXO1-expressing CAR T cells. b, IGV tracks for indicated genes in indicated CAR T cell groups. c, Correlation of motifs upregulated by IL-15 relative to IL-2 in mouse CAR T cells as in Extended Data Fig. 1 and in FOXO1-overexpressing CAR T cells as determined by HOMER analysis. d, Principal component analysis of ATAC-seq data for indicated CAR T cell populations. e, Number of peaks with differential accessibility in FOXO1-expressing CAR T cells relative to controls before and after stimulation.
Fig. 5
Fig. 5. FOXO1 overexpression enhances the efficacy of human CAR T cells in a mouse tumour transplant model.
ah, Mice bearing OVCAR-3 tumours were treated with Lewis Y CAR T cells generated as in Fig. 3. a, Tumour mass at day 13 after treatment. b,c, Analysis of CAR T cell frequency in the blood (b) and spleens (c) of treated mice. ac, Data are mean ± s.e.m. of n = 12 (control) or n = 6 (TCF7, FOXO1, ID3) (a,c), and n = 6 (b) mice per group. d. Therapeutic efficacy of CAR T cell treatment. Data are the mean ± s.e.m. of 7 mice per group from a representative experiment of n = 2. eh, Analysis of CAR T cell frequency and phenotype in the spleens and tumours of treated mice at day 12 after treatment. Data are mean ± s.e.m. of 5 mice per group. i, Proportion of CD8+ CAR T cells generated from six patients enroled in a trial of CAR T cells with a CD45RA+CD62L+ phenotype. j, Representative FACS plot of TIM3 and CD39 expression on CD8+ CAR T cells derived from patients. k, Analysis of oxidative consumption in patient-derived CAR T cells by Seahorse MitoStress assay. Data represent paired analysis from three independent patients (top) or a representative patient (bottom). ln, Analysis of CAR T cell frequency (l) and phenotype (m,n) in the spleens and tumours of mice treated with patient-derived CAR T cells at day 13 after treatment. l, Data are mean ± s.e.m. of n = 10 (patient 1, spleen control and patient 4, tumour FOXO1), n = 11 (patient 1, spleen FOXO1 and patient 4, tumour control), n = 7 (patient 1, tumour) or n = 15 (patient 4, spleen) mice per group pooled from two independent experiments. m, Data are mean ± s.e.m. of n = 11 (spleen) or n = 7 (tumour) mice per group pooled from two independent experiments. P values deterined by two-sided, one-way ANOVA (ac), two-way ANOVA (d), two-sided unpaired t-test (e,g,h,l,m) or two-sided paired t-test (i,k). Source Data
Extended Data Fig. 1
Extended Data Fig. 1. CAR T cells polarized with IL-15 have increased expression of Foxo1.
a-j, Murine anti-Her2 CAR T cells preconditioned with IL-2/IL-7 or IL-15/IL-7. a, Expression of CD62L and CD44 on CD8+ CAR T cells on concatenated samples from a representative experiment of n = >3. b, CAR T cell numbers from tumors and spleens of E0771-Her2 tumor bearing mice at day 9 post treatment. n = 7 (Tumor 2/7, spleen 2/7 and 7/15) or n = 6 (tumor 7/15) mice per group. c-e, Heatmaps and MA-plot of indicated genes in CD8+CD62L+ CAR T cells at day 6 post transduction. f-g. Gene set enrichment analyses of CAR T cells from c relative to the CHEA dataset (f) and in silico predicted FOXO1 target genes (g; FOXO_01; https://www.gsea-msigdb.org/gsea/msigdb/cards/FOXO1_01.html). h-j, CD8+ CAR T cells treated as per c. were analyzed by ATAC-Seq. h-i, Homer analysis of motif enrichment in differentially accessible peaks. The top 50 most significantly enriched motifs in IL-15 conditioned CAR T cells plotted relative to the percentage of target sequence and average expression in IL-15 cultured CD8+CD62L+ CAR T cells. j, ChromVar analysis from h. Mean deviation score was calculated for the following subsets of CD8+ CAR T cells; CD62L+CD44+, CD62L+CD44low, CD62LCD44+. The delta mean deviation score for the CD62L+CD44+ subset is shown for the top 10 ranking transcription factors in each direction. c-j, Samples indicative of biological duplicates. k-l, anti-Her2 CAR T cells were CRISPR/Cas9-edited to target Foxo1. At day 5 post transduction CD8+ CAR T cells were phenotyped in steady state (k) or serially cocultured with E0771-Her2 tumor cells for 3 consecutive days (l-m). k-m, representative of >3 independent experiments, data points indicate biological triplicates. b Bars represent mean ± SEM k-l, Bars represent mean ± SD, ****p < 0.0001, unpaired two-sided t test. Source data are provided in the Source Data file. Source Data
Extended Data Fig. 2
Extended Data Fig. 2. CAR T cell transduction efficiency and transgene overexpression.
a, Schematic of anti-Her2 CAR with Myc binding domain and detection of Myc tag in CAR T cells transduced with the indicated transcription factors. Representative histograms of 3 independent transductions. b, Expression of indicated transcription factors in murine CD8+NGFR+ CAR T cells (b) or human FACS sorted CAR T cells as determined by qRT-PCR. Data represent the mean ± SD of technical triplicates from two independent experiments. Statistics determined by unpaired two-sided t test, (*p < 0.05, ***p < 0.001, ****p < 0.0001). Source data are provided in the Source Data file. Source Data
Extended Data Fig. 3
Extended Data Fig. 3. FOX1-ADA overexpression enhances CAR T cell polyfunctionality.
a, Schematic of tumor cell coculture assay. b, IFNγ and TNF production following each round of E0771-Her2 tumor cell stimulation with CAR T cells modified via overexpression of indicated transcription factors. c. Paired analyses of n = 3 (Tcf7, ID3) or n = 4 (Foxo1-ADA) repeat experiments setup as per b. d-e, Expression of Granzyme B in CAR T cells following 72 h of coculture. Histogram overlays of concatenated data from biological replicates. f, Number of total CD8+ or CD62L+Ly108+CD8+ CAR T cells following 72 h of coculture. b, and e-f Data represents the mean ± SD of technical triplicates. Statistics determined by two-sided, one-way ANOVA. Representative of at least 3 independent experiments. Source data are provided in the source data file. Source Data
Extended Data Fig. 4
Extended Data Fig. 4. Therapeutic efficacy and safety of murine CAR T cells in E0771-Her2 and MC38-Her2 tumor bearing mice.
a-b, MC38-Her2 subcutaneous tumors or c, E0771-Her2 mammary fat pad tumors were established in mice for 5 to 7 days, prior to treatment with control, Tcf7, Foxo1-ADA or ID3 overexpressing CAR T cells as per Fig. 1. a, Survival curves of mice. Data represent 2 independent experiments (Tcf7, ID3) or 3 independent experiments (Untreated, Control, Foxo1-ADA) combined. Statistics determined by Mantel-Cox test, *, p < 0.05 **, p < 0.01. b-c, Individual tumor growth curves of mice. d-e, Therapeutic efficacy of control, wild-type Foxo1 (Foxo1 WT) overexpressing, Foxo1-ADA overexpressing, c-Jun overexpressing, or no CAR T cells. Data presented as mean ± SEM from indicated number of mice. Statistics determined by Two-way ANOVA (ns = not significant, *p < 0.05, **p < 0.01, ***p < 0.001). f-h, At day 9 post treatment, serum was taken from treated mice. Liver and kidney function was assessed by levels of indicated factors and potential cytokine release syndrome assessed through measurement of indicated cytokines. f-h Data represent the mean ± SD (f, g) or ± SEM (h) of 6 samples obtained from independent mice for each group. Statistics determined by One-way ANOVA (ns = not significant, *p < 0.05, **p < 0.01, ***p < 0.001). i, hematoxylin and eosin histology staining was performed on brain liver and lungs of mice day 9 post treatment. Images are representatives of 3 mice per group of one experiment. Source data are provided in the Source Data file. Source Data
Extended Data Fig. 5
Extended Data Fig. 5. Phenotype of anti-Her2 CAR T cells isolated from E0771-Her2 expressing tumors.
E0771-Her2 tumor bearing mice were treated with anti-Her2 CAR T cells and tumors analyzed by flow cytometry at day 9 post treatment. a, Proportion of CD8+ b, or CD8+Tcf1+ CAR T cells expressing Ki67. Data presented as mean ± SEM n = 10 mice per group combined from 2 experiments. c, Expression of PD-1, TIM-3 and Tox in CD8+ CAR T cells modified with the indicated transcription factor. Data obtained from concatenated samples of n = 5 mice from a representative experiment of n = 2. d, E0771-Her2 tumor-bearing mice were treated with CAR T cells and with a total of 4 doses of 200 μg of anti-PD-1 or 2A3 on days 0, 3, 7 and 11 post-treatments. Data presented as mean ± SEM of indicated number of mice. Statistics determined by Two-way ANOVA (*p < 0.05, **p < 0.01, ****p < 0.0001). e, Frequency of CD8+ and CD4+ T cells within the NGFR+ (CAR+ subset). Data represented as the mean ± SEM of n = 12 (control and id3), n = 8 (Tcf7), n = 11 (Foxo1-Ada) mice combined from two independent experiments. Source data are provided in the Source Data file. Source Data
Extended Data Fig. 6
Extended Data Fig. 6. GSEA pathways in in vitro stimulated Foxo1-ADA overexpressing CAR T cells.
Foxo1-ADA and control CAR T cells were stimulated for 72 h with an agonistic antibody against the Her2 directed CAR prior to RNA-sequencing. Unbiased ranking of gene sets from the Hallmark gene sets.
Extended Data Fig. 7
Extended Data Fig. 7. Comparison of FOXO1 WT and FOXO1-ADA in human CAR T cells.
a, LeY-mCherry (Control), LeY-FOXO1-ADA and LeY-FOXO1 WT constructs. b, Expression of indicated markers on healthy donor derived control or FOXO1-ADA CD8+ CAR T cells 5 days post transduction. Representative of 3 independent donors. c, Timecourse of control or FOXO1-ADA CD8+ CAR T cell phenotypes during in vitro culture. Data representative of 3 independent donors. d-e. CAR T cells were serially cocultured with OVCAR-3 tumor cells through 3 successive rounds of tumor cell addition. d, Proportion of CD8+ CAR T cells expressing CD69 in control or FOXO1-ADA expressing CAR T cells at Day 3. Data presented as mean ± SD of three technical replicates from a representative donor of n = 3. Statistics determined by unpaired two-sided t test. e, Proportion of CD8+ CAR T cells expressing IFNγ and TNF in control, FOXO1-ADA or FOXO1 WT expressing CAR T cells. Data presented as mean ± SD of three technical replicates from a representative donor of n = 3. Statistics determined by One-way ANOVA. f, T cells were transduced with the anti-Lewis Y CAR and mCherry or FOXO1 WT transgenes driven by the EF1α, PGK or CMV promoters. Histograms show the expression of mCherry (left) or FOXO1 (right). Numbers indicate MFI for relevant transgenes. Data representative of 3 independent donors. g, Flow cytometry analysis of the CD45RA+CD62L+ profile of CD8+ CAR T cells transduced with either mCherry (Ctrl), FOXO1 WT or FOXO1-ADA driven by the indicated promoters. Representative plots and paired data are shown for 3 independent donors. h. CAR T cells were cocultured for 24 h with OVCAR-3 or MCF7 tumor cells and production of IFNγ and TNF determined. Data is represented as the mean ± SD of experimental triplicates. Statistics determined by unpaired two-sided t test. *p < 0.05, **p < 0.01, ***p < 0.001, ****p < 0.0001. Source data are provided in the Source Data file. Source Data
Extended Data Fig. 8
Extended Data Fig. 8. Phenotype and transcriptional profile of healthy donor CAR T cells following FOXO1 overexpression.
Healthy donor T cells were transduced with mCherry (ctrl), FOXO1, TCF7 or ID3 and an anti-Lewis Y CAR. a, Paired data of indicated phenotypic markers in control and FOXO1 expressing CAR T cells, n = 5 (CCR7, CD39, PD1) or 4 (TIM3) independent donors. Statistics determined by paired two-sided t test,. b-e, g, CAR T cells were serially cocultured with OVCAR-3 or MCF7 tumor cells over 72 h after which point CAR T cell number (b), cytokine production (c) or cell surface phenotype (d-e, g) were determined. b, d, Data represents the mean ± SD of biological triplicates from a representative experiment of n = 4. Statistics determined by unpaired two-sided t test. c, e, Paired data of indicated markers in control and FOXO1 expressing CAR T cells, n = 5 independent donors (c) or n = 4 independent donors (e). e, Statistics determined by paired two-sided t test. f, g, Flow cytometry showing the expression of CD39 and TIM3 prior to (f, g) or after co-culture with MCF7 tumor cells (g), representative of 2 independent experiments. h-n. Gene expression of CD8+ CAR T cells (h-j, l-n) and CD4+ CAR T cells (k-l) was determined by RNA-Sequencing as per Fig. 3. Data indicative of biological triplicates. h, enrichment of genes associated with less differentiated T cells that correlate with improved responses to immune checkpoint blockade in FOXO1 but not TCF7 expressing CAR T cells. i-j, Expression of indicated immune checkpoints in control, TCF7 or FOXO1 expressing CD8+ CAR T cells k, Expression of genes associated with glycolysis. l, Volcano plot highlighting differentially expressed genes in control or FOXO1-expressing CAR T cells prior to and after tumor cell coculture. m, negative enrichment of genes associated with exhaustion in FOXO1-expressing but not TCF7-expressing CD8+ CAR T cells, gene set defined by. n, Control or FOXO1-expressing CD8+ CAR T cells were assessed by RNA-Sequencing prior to stimulation (left), after 24 h activation with 0.1 μg/ml plate bound anti-Lewis Y (middle) or after 7 days recovery post stimulation with anti-Lewis Y (right). *p < 0.05, **p < 0.01, ***p < 0.001, ****p < 0.0001. Source data are provided in the Source Data file. Source Data
Extended Data Fig. 9
Extended Data Fig. 9. Phenotype and function of anti-Lewis Y CAR T cells following CRISPR/Cas9-mediated deletion of FOXO1.
Anti-Lewis Y CAR T cells deficient for FOXO1 were generated via CRISPR/Cas9 targeting. The expression of CD62L and CD27 on CD8+CAR+ T cells (a-b) and CD4+CAR+ T cells (c-d) were determined over 28 days in culture with IL-2. a, c, Representative flow cytometry plots of 3 independent donors. b, d, Numbers of total (left) or CD27+CD62L+ (right) CD8 + CAR T cells. Data represents the mean ± SD of technical triplicates from a representative experiment of n = 3 donors. Statistical significances determined by unpaired two-sided t test. e, CAR T cells were cocultured overnight at a 1:1 ratio with OVCAR-3 or MCF7 tumor cells for 16 h and the production of IFNγ or TNF determined by CBA. Data represents the mean ± SD of technical triplicates from a representative experiment of n = 3 donors. Statistical significance determined by unpaired two-sided t test, (*p < 0.05, **p < 0.01, ***p < 0.001, ****p < 0.0001. Source data are provided in the Source Data file. Source Data
Extended Data Fig. 10
Extended Data Fig. 10. Phenotype of human CAR T cells expressing WT FOXO1 following repetitive stimulation cocultures.
a, Control and FOXO1 expressing CAR T cells were stimulated as per Extended Data Fig. 8n. Expression of CD45RA and CD62L on CD8+ CAR T cells is shown for a representative donor n = 3. b, Control and FOXO1 expressing CAR T cells were stimulated with MCF7 cancer cells for three weeks and the phenotype determined. Flow cytometry plots from a representative donor of n = 2.
Extended Data Fig. 11
Extended Data Fig. 11. scRNA-seq analysis of control and FOXO1-expressing CAR T cells.
CAR T cells were either left non stimulated or cocultured with MCF7 tumor cells and analyzed by scRNA-Seq as per Fig. 3. a-b, UMAP plots, cluster composition and density plot of indicated genes shown for pooled stimulated and non-stimulated CD8+ (a) and CD4+ (b) CAR T cells. c-d, Heatmap indicating the expression of the top 10 differentially expressed genes in each (c) CD8+ and (d) CD4+ cluster.
Extended Data Fig. 12
Extended Data Fig. 12. Epigenetic changes evoked in human CAR T cells by FOXO1 overexpression.
a, ChromVAR analysis of motifs (JASPAR) with increased or decreased accessibility in FOXO1-expressing CAR T cells. Heatmap depicts the top 20 motifs in each direction for non-stimulated cells and the same motifs after CAR activation. b, fold reduction in indicated transcription factor expression following FOXO1 overexpression in CD8+ CAR T cells analyzed as per Fig. 3e. c, Location of peaks with reduced accessibility in FOXO1-expressing T cells relative to controls prior to stimulation (left) and after MCF7 coculture (right). Source data are provided in the Source Data file.
Extended Data Fig. 13
Extended Data Fig. 13. Phenotype and safety of FOXO1-expressing anti-Lewis Y CAR T cells in vivo.
a, Individual tumor growth curves of mice treated in Fig. 5d, 7 mice per group from a representative experiment of n = 2. b. Therapeutic efficacy of control, FOXO1 overexpressing or TCF7 overexpressing CAR T cells. Data presented as mean ± SEM of indicated numbers of mice representative experiment of n = 2. Statistic determined by Two-way ANOVA. c, Ki-67 expression of CD8+ CAR T cells in the tumors of treated mice at day 12 post treatment. Data represents the mean ± SEM of 5 mice per group. d, Expression of PD-1 and TIM3 or CD45RA and CD62L in CD8+ CAR T cells at day 13 post treatment. Representative FACS staining from concatenated samples (left) and data presented as mean ± SEM of n = 12 (Control) or n = 6 (Tcf7, Foxo1) (right). Statistics determined by unpaired two-sided t test. e, f, Analysis of CAR T cell frequency in the tumors (e) and spleens (f) of treated mice at day 7 post treatment. Data represents the mean ± SEM of 5 mice per group. Statistics determined by unpaired two-sided t test. g, h, Expression of indicated enzymes (g) and cytokines (h) in serum at day 12 post treatment. Data represent the mean ± SEM of 8 (untreated, control) or 7 (FOXO1) independent mice. i, body weight of mice at day 19, experimental endpoint of Fig. 5d. Data represents the mean ± SEM of 7 mice per group from a representative experiment of n = 2. *p < 0.05, **p < 0.01, ****p < 0.0001. Source data are provided in the Source Data file. Source Data

References

    1. Maude SL, et al. Chimeric antigen receptor T cells for sustained remissions in leukemia. N. Engl. J. Med. 2014;371:1507–1517. doi: 10.1056/NEJMoa1407222. - DOI - PMC - PubMed
    1. Kalos M, et al. T cells with chimeric antigen receptors have potent antitumor effects and can establish memory in patients with advanced leukemia. Sci. Transl. Med. 2011;3:95ra73. doi: 10.1126/scitranslmed.3002842. - DOI - PMC - PubMed
    1. Rodriguez-Otero P, et al. Ide-cel or standard regimens in relapsed and refractory multiple myeloma. N. Engl. J. Med. 2023;388:1002–1014. doi: 10.1056/NEJMoa2213614. - DOI - PubMed
    1. San-Miguel J, et al. Cilta-cel or standard care in lenalidomide-refractory multiple myeloma. N. Engl. J. Med. 2023;389:335–347. doi: 10.1056/NEJMoa2303379. - DOI - PubMed
    1. Mardiana S, Solomon BJ, Darcy PK, Beavis PA. Supercharging adoptive T cell therapy to overcome solid tumor-induced immunosuppression. Sci. Transl. Med. 2019;11:eaaw2293. doi: 10.1126/scitranslmed.aaw2293. - DOI - PubMed

Publication types

MeSH terms

Substances