. 2024 Apr;628(8009):894-900.
doi: 10.1038/s41586-024-07287-2. Epub 2024 Apr 10.

Emergence of fractal geometries in the evolution of a metabolic enzyme

Affiliations

Emergence of fractal geometries in the evolution of a metabolic enzyme

Franziska L Sendker et al. Nature. 2024 Apr.

Abstract

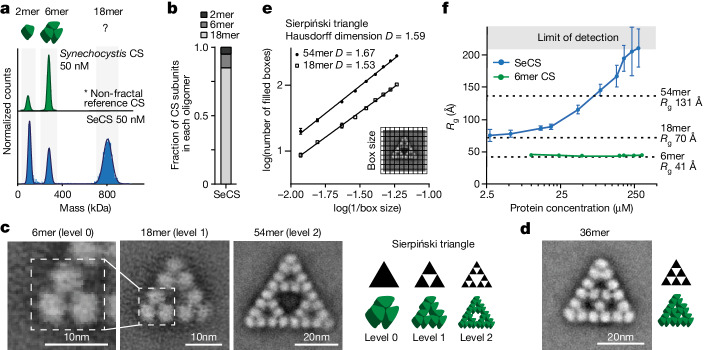
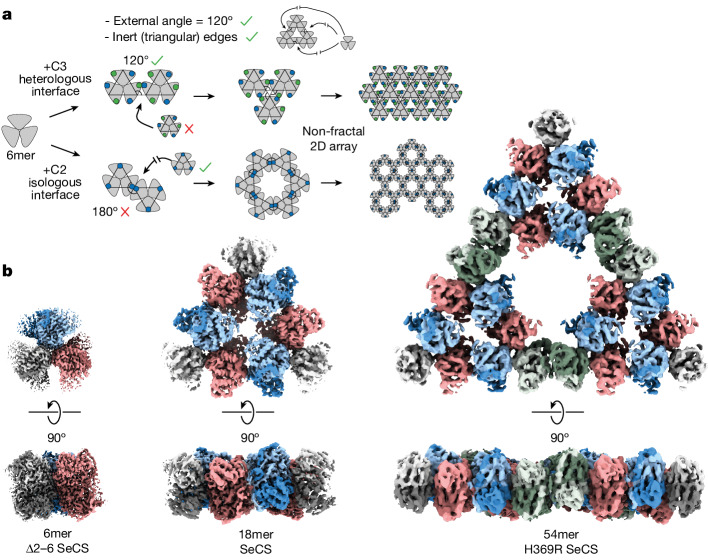
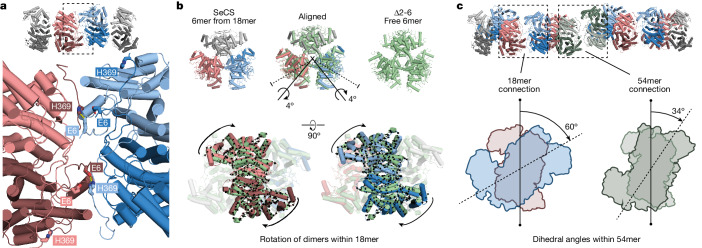
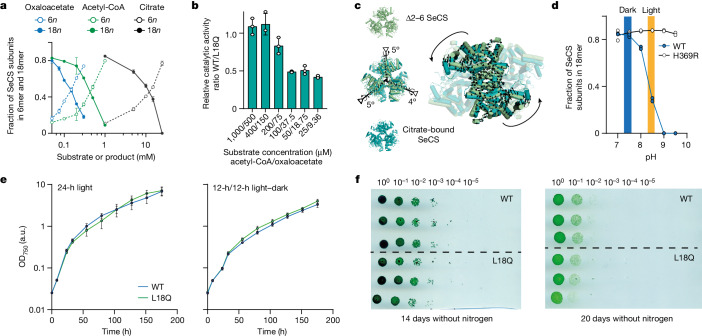
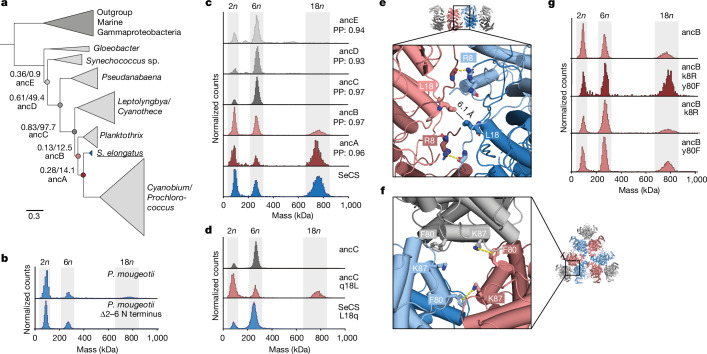
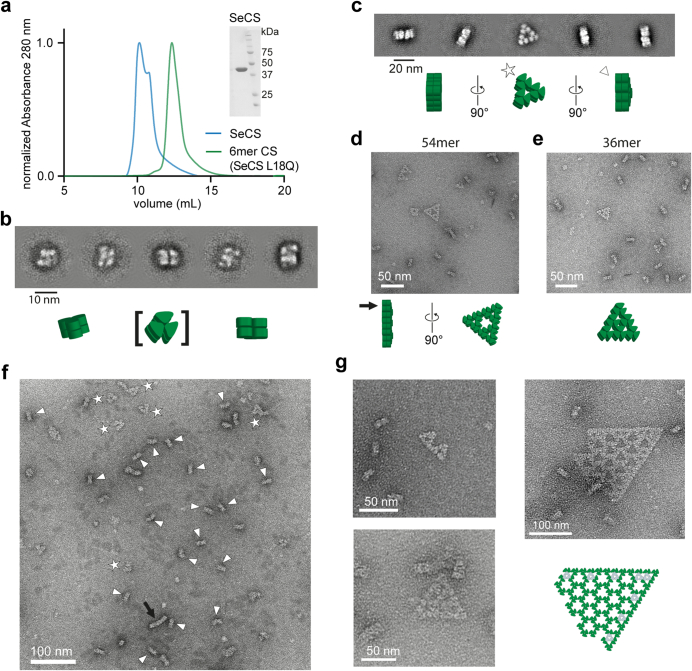
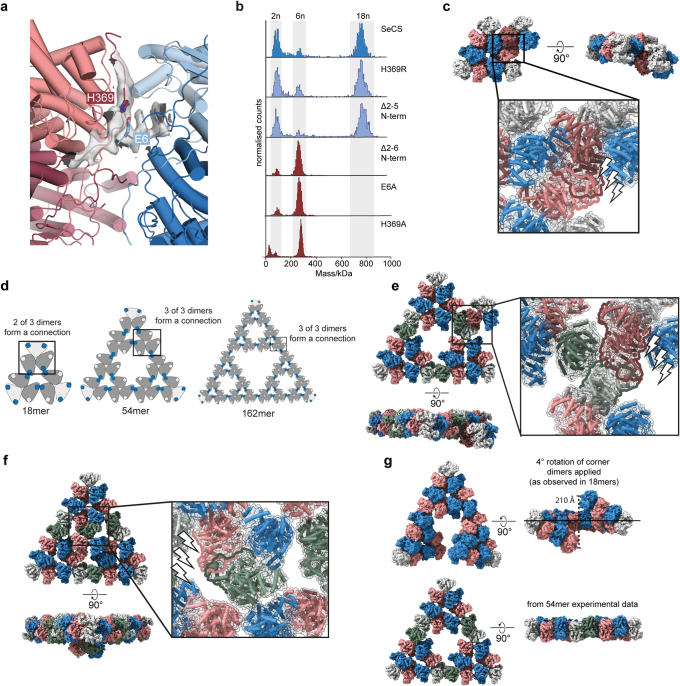
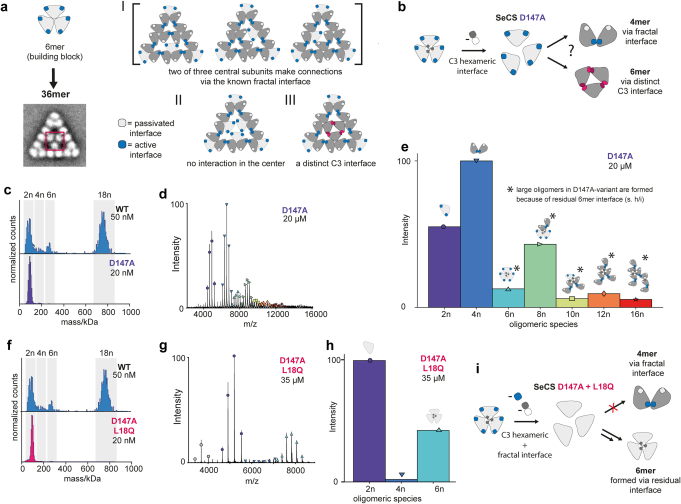
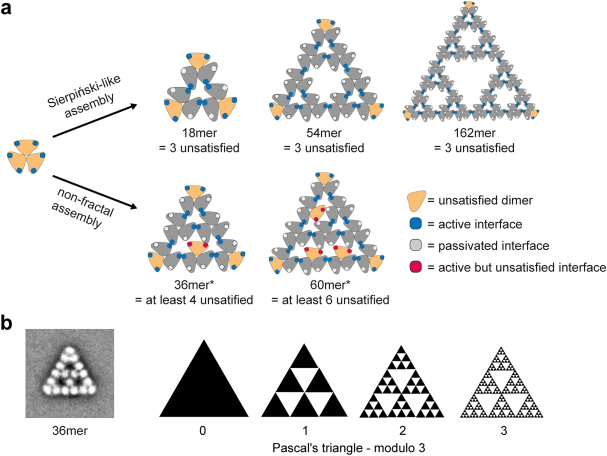
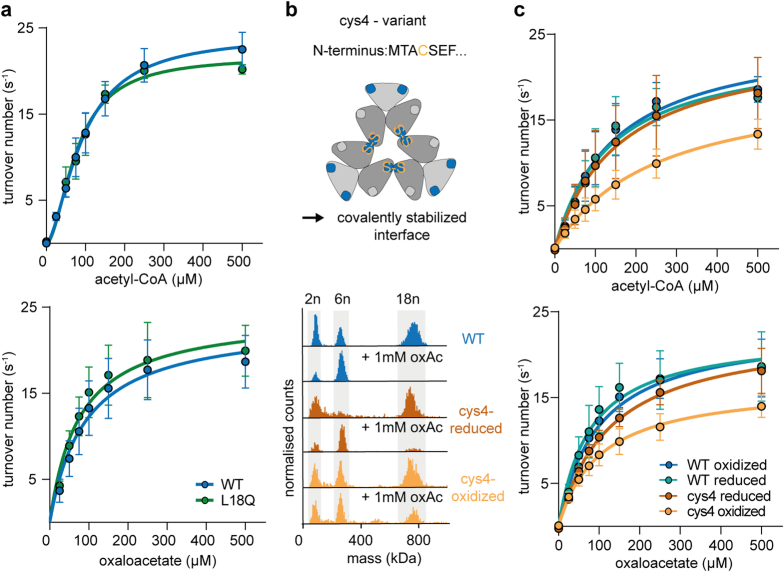
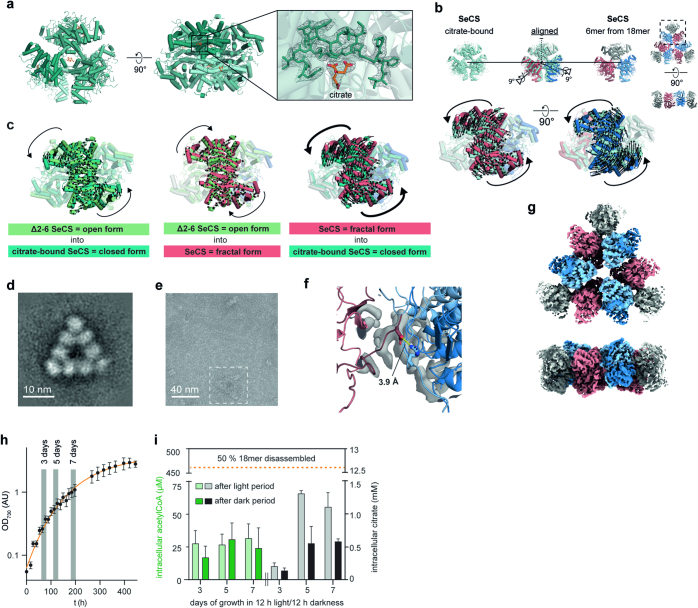
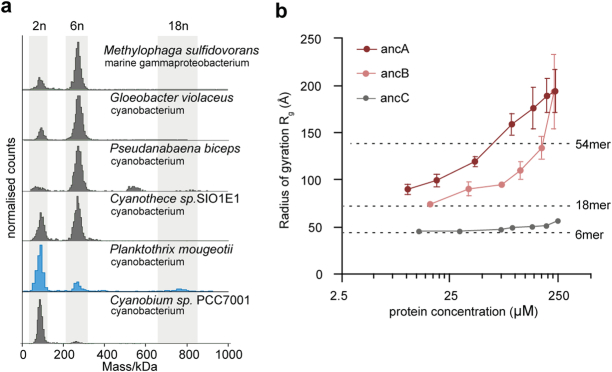
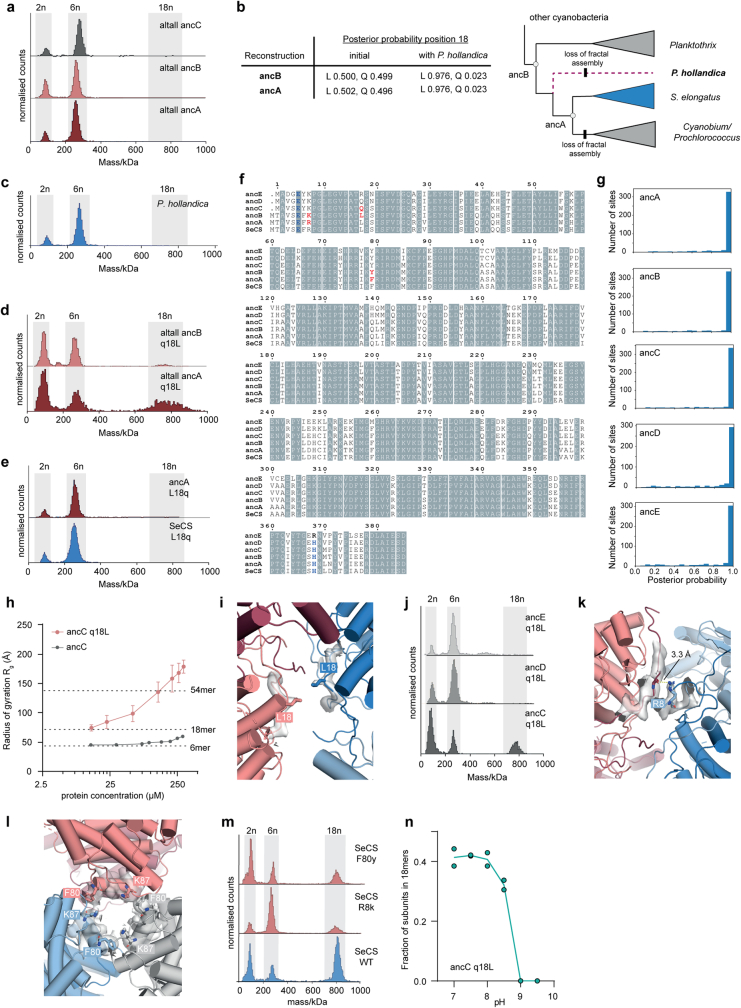
Fractals are patterns that are self-similar across multiple length-scales1. Macroscopic fractals are common in nature2-4; however, so far, molecular assembly into fractals is restricted to synthetic systems5-12. Here we report the discovery of a natural protein, citrate synthase from the cyanobacterium Synechococcus elongatus, which self-assembles into Sierpiński triangles. Using cryo-electron microscopy, we reveal how the fractal assembles from a hexameric building block. Although different stimuli modulate the formation of fractal complexes and these complexes can regulate the enzymatic activity of citrate synthase in vitro, the fractal may not serve a physiological function in vivo. We use ancestral sequence reconstruction to retrace how the citrate synthase fractal evolved from non-fractal precursors, and the results suggest it may have emerged as a harmless evolutionary accident. Our findings expand the space of possible protein complexes and demonstrate that intricate and regulatable assemblies can evolve in a single substitution.


Conflict of interest statement

The authors declare no competing interests.

Figures

Fig. 1
Fig. 1. CS of S.elongatus PCC 7942 assembles into Sierpiński triangles.
a, Distribution of oligomeric protein complexes of purified CS from two cyanobacterial species, S.elongatus PCC 7942 (SeCS, monomer mass = 44.3 kDa) and Synechocystis sp. PCC 6803 (monomer mass = 45.9 kDa), measured by MP. Cartoons represent the assembly of known CS proteins. b, Distribution of SeCS subunits in the different oligomeric complexes corresponding to the MP measurements in a. c,d, 2D class averages of purified SeCS recorded by negative-stained EM. The 6mer complexes did not produce top-views (Extended Data Fig. 1b). Therefore, an isolated 6mer of the 18mer class average was used for representation. Schematics of the images are on the right. e, Box-counting quantification of the Hausdorff dimensions (D) using the class averages of the 18mers and 54mers. Data are presented as the mean values of three different grid positions, and error bars correspond to s.d. D was obtained from the slope of the regression line (R254mer = 0.996, R218mer = 0.997). f, Rg values inferred from SAXS data for SeCS and a hexameric variant (SeCS L18Q; Fig. 5d) at varying protein concentrations. The experiment was conducted by starting at the highest concentration and then serially diluting the protein. Larger assemblies are therefore reversible. One sample for each concentration step was measured over ten frames. The data presented are the inferred Rg values using Guinier approximation, and error bars correspond to the s.d. of fit values calculated from the covariance matrix (ScÅtter IV). Dashed lines indicate Rg values calculated from the indicated structural models of the 6mer, 18mer and 54mer.
Fig. 2
Fig. 2. Levels of fractal assembly.
a, Schematic representation of the requisites needed to produce a Sierpiński fractal from hexameric blocks and the symmetry-based constraints on oligomeric assembly. Green and blue dots represent active or open interfaces, respectively. b, Cryo-EM density maps of Sierpiński triangles of the zeroth, first and second fractal level. The 6mer (3.1 Å) was derived from the hexameric Δ2–6 SeCS variant. The 18mer (3.9 Å) was derived from the wild-type (WT) SeCS. The 54mer (5.9 Å) was derived from the pH-stabilized variant H369R SeCS.
Fig. 3
Fig. 3. The molecular basis of fractal assembly.
a, Close-up of the interface that produces the 18mer. Two out of the four adjacent protomers are making the connection (dark red and light blue). b, Structural alignment of a free Δ2–6 SeCS hexamer with an extracted hexamer from the 18mer structure. Black arrows indicate the molecular displacement in the 18mer, which corresponds to a rotation of the connecting dimers around an internal axis (black axis). The symmetry axes of the dimer interfaces are shown as dotted lines for reference. c, Dihedral angles between dimers interacting across the fractal interface are depicted for the connection within and between 18mers in a 54mer. Dimers are shown as blue and red, and green and olive outlines, respectively.
Fig. 4
Fig. 4. Fractal formation affects catalysis in vitro but not fitness in vivo.
a, Fraction of SeCS subunits in 6mers and 18mers at different concentrations of the two substrates acetyl-CoA and oxaloacetate and the product citrate quantified by MP. Data are presented as the mean values, and error bars indicate the s.d. n = 3. b, Ratio of turnover numbers (SeCS/L18Q, mean values, error bars indicate the s.d., n = 3) of SeCS and a hexameric variant (L18Q) at different substrate concentrations (see Extended Data Fig. 5 and Supplementary Table 1 for underlying data). c, Alignment of a citrate-bound structure with a Δ2–6 SeCS hexamer. Black arrows depict the molecular displacement from Δ2–6 SeCS into the citrate-bound state corresponding to a rotation around an internal axis within the dimers (black axes). The symmetry axes of the dimer interfaces are shown as dotted lines. Comparison of the citrate-bound conformation and the 18mer is shown in Extended Data Fig. 6b. d, MP quantification of SeCS subunits in 18mers at different pH values for the WT and the H369R variant. Protein concentration = 50 nM, n = 2. The intracellular pH range of S.elongatus in the dark and in light are indicated. Values taken from ref. . e, Growth curves of genetically modified S.elongatus strains harbouring either WT CS or hexameric L18Q CS at the original genetic locus and an additional antibiotic resistance cassette. Strains were cultivated either in full light (24 h) or light and dark cycles (12 h/12 h). Cultures were set up in three biological replicates, and data depict the mean values, error bars indicate the s.d. f, Survival of the genetically modified S.elongatus strains with either WT CS or the hexameric L18Q SeCS variant after nitrogen starvation for extended periods of time. Serial dilutions of three independent cultures are shown for each time point. Uncropped image in Supplementary Fig. 1b.
Fig. 5
Fig. 5. Evolution of the SeCS fractal.
a, Phylogenetic tree of CS in Cyanobacteria (full phylogeny in Supplementary Fig. 6). Internal nodes that were resurrected by ancestral sequence reconstruction are labelled with branch support by Felsenstein’s bootstrap and approximate likelihood test statistic. b, MP of purified extant CS from the Planktothrix clade and its N-terminal truncation. c, MP of purified ancestral CS. PP, average posterior probability of the maximum a posteriori state of the reconstructed sequence over all amino acids. d,g, MP of ancestral CS proteins with individual historical substitutions (lowercase and uppercase letters refer to ancestral and derived amino acids, respectively). e,f, Location of the substitutions within the structure of the SeCS 18mer.
Extended Data Fig. 1
Extended Data Fig. 1. SeCS forms complexes of 18 subunits and larger assemblies.
(a) Size exclusion chromatography profile of purified WT SeCS and a 6mer SeCS-variant (SeCS L18Q, see Fig. 5d). The size exclusion chromatography runs were performed three independent times for both samples with similar results. Inlay shows a SDS-PAGE gel of the purified WT SeCS (Uncropped image in Supplementary Fig. 1a). (b) 2D class averages from negative stain electron microscopy of a 6mer SeCS variant (SeCS L18Q, s. Fig. 5d) which yielded different particle orientations but no top views. (c) 2D class averages from negative stain electron microscopy of the 18mer SeCS complexes. Strong preferential orientation towards side views, where the complex lays on the edge or tip of the triangle. Compare also cryo-EM 2D class averages supplementary Fig. 3. (d-f) Detail from example micrographs from negative stain electron microscopy. For the depicted structures we observed for the 18mer = 1491 particles, 54mer = 200 particles and the 36mer = 186 particles. Symbols (star, triangle, arrow) indicate the respective complex and orientation in the overview micrograph (f). (g) Additional assemblies that were observed only 2–4 times from a total of 20 micrographs (4096×4096 pixels). The largest shown assembly was observed only a single time but we created a model based on hexameric subcomplexes, see below the micrograph. Subunits colored in grey rely on a three-way junction of dimers and subunits colored in green rely on a two-way junction. For 18mers and 54mers all connections are two-way junctions. The central connection of 36mers is in contrast a three-way junction.
Extended Data Fig. 2
Extended Data Fig. 2. Interface residues of the 18mer and construction of 54mers.
(a) Close-up of the 18mer cryo-EM density at the interface that connects hexamers with key residues annotated. (b) MP measurements of variants of SeCS. (c) Addition of a hexamer to the edge of an 18mer via the interface residues that do not participate in the fractal connection (dark-red dimer from hexamer binding to a blue dimer from 18mer). The angle of this interaction would force the added hexamer out of the plane of the 18mer. The interaction would also introduce steric clashes with the salmon-colored dimer of the 18mer. (d) Schematic depiction of different interactions of the hexameric subcomplexes within subsequent levels of Sierpińksi triangles. Addition of a hexamer to the edge (e) or central void (f) of an 54mer connecting to the interface residues that do not participate in the fractal connection via the same interaction that is observed between 18mers. In both cases the added hexamer tilts out of the plane of the 54mer and introduces steric clashes with a dimer within the 54mer. (g) Formation of 54mer from the 18mer structures. The 18mer is a flat, closed triangle because of the internal rotation introduced by the interface of the connecting subunits. If the corner dimers of the 18mers are rotated by the same 4° rotation when forming a 54mer the angle between 18mer subcomplexes is too large and does not form planar, closed triangles. Our empirical density of the closed 54mer is shown in comparison.
Extended Data Fig. 3
Extended Data Fig. 3. 36mer complexes are not stabilized via an additional C3 interface.
(a) Pascal’s triangle-like 36mer complexes contain a three-fold connection in their center that is not observed in fractal-like 18mers and 54mers. From the 18mer structure a three-way interaction via the observed interface is not possible as it passivates the subunits. Therefore, either only two subunits can connect in the center (I), no subunits interact (II) or there is a distinct C3-interface that allows for a threefold interaction (III). (b) The mutation D147A destabilizes the interface connecting three dimers to a hexamer, that forms the building block of all larger oligomers. The interface that induces fractal assembly is unchanged and allows for formation of 4mers. In case of an additional distinct C3-interface, the formation of stable 6mers is expected. (c) Mass photometry measurements of the D147A variant reveal dimers and the disruption of the hexamer interface. (d) Native mass spectrometry of D147A SeCS at high protein concentration (20 µM). (e) The distribution of oligomers determined from (d) revealed a strong preference for the formation of 4mers. A low abundance of 6mers renders an additional distinct C3-interface as unlikely or at least much less stable. Larger oligomers arise probably due to an incomplete disruption of the hexamer subcomplex interface. Cartoons indicate potential structures that correspond to the larger observed oligomers. (f) MP measurement of an additional variant in which the fractal interface was also disrupted (SeCS D147A + L18Q). This variant showed to form only dimers at nanomolar concentrations using MP. (g) Native mass spectrometry of D147A + L18Q SeCS at high protein concentration (35 µM). (h) The distribution of oligomers determined from (g) revealed the formation of mostly dimers and hexamers. (i) The formation of hexamers in the variant D147A + L18Q SeCS additionally supports that the hexamer interface was not completely destroyed by the mutant D147A and that the larger oligomers (≥ 8mer, d + e) are formed because of residual affinity in the hexamer interface, not because of an additional C3 interface.
Extended Data Fig. 4
Extended Data Fig. 4. Interface occupancy in fractal and non-fractal assemblies.
(a) Assembly into Sierpiński-triangle complexes from hexameric subcomplexes always results in only three unsatisfied dimers at the corners of the triangle. When assembled into other complexes e.g. the 36mers or larger forms of lattice-like triangles at least 4 or more dimers stay unsatisfied. * The active but unsatisfied interfaces in the inner part of the represented structures can be located at different positions, similar to a resonance structure. Depicted is one possibility. (b) Schematic depiction of a fractal pattern that can be assembled from 36mers.
Extended Data Fig. 5
Extended Data Fig. 5. Enzyme kinetics of SeCS and its variants.
(a) Michaelis-Menten kinetics of SeCS and the hexameric L18Q variant. Data presented as mean values, error bars = SD, n = 3 biological replicates with 3 technical replicates each. (b) Schematic depiction of the cys4-variant of SeCS, which stabilizes 18mer-complexes by a reversible disulfide bridge in the fractal interface and prevents the disassembly at high substrate concentration. MP measurements of SeCS and the cys4-variant under oxidizing and reducing conditions, with and without oxaloacetate (oxAc). (c) Michaelis-Menten kinetics of SeCS and cys4-variant after oxidation and subsequent reduction. Data presented as mean values, error bars = SD, n = 3 biological replicates with 3 technical replicates each.
Extended Data Fig. 6
Extended Data Fig. 6. Structural changes in the citrate-bound SeCS, structural integrity of the H369R variant, and intracellular CS metabolite concentrations.
(a) Molecular model of hexameric SeCS bound to citrate, solved by X-ray crystallography to a resolution of 2.7 Å. Zoom displays the density of a citrate-molecule inside the substrate binding pocket of the enzyme. (b) Alignment of the citrate-bound structure with a hexameric subcomplex from the 18mer structure. Arrows depict the molecular displacement from the 18mer to the citrate-bound structure, which can be described by a 9° rotation around an internal axis within the dimer-subcomplexes (black axis). The symmetry axes of the dimer-interfaces are shown as dotted lines for reference. (c) Comparison of the conformational changes between Δ2-6 SeCS (representing the typical open form of CS structures), citrate-bound SeCS (representing the closed form of CS) and the fractal form of 18meric SeCS. (d) Negative stain 2D class average of the 18mer formed by H369R SeCS at 450 nM. (e) Detail of a negative stain micrograph showing a 54mer formed by H369R SeCS at 450 nM. We collected 196 micrographs (2048×2048 pixel) in total. (f) Close up on the interaction between R369 and E6 in the 18mer structure H369R SeCS. (g) Cryo-EM density of an 18mer from the H369R SeCS variant resolved to 3.5 Å. (h) Growth curve of S. elongatus PCC 7942 cultivated under circadian cycles (12 h light and 12 h darkness). Grey columns indicate the growth phases, in which samples were taken for metabolomic analysis. Cultures were set up in three biological replicates, data are presented as mean values and error bars indicate SD. (i) Intracellular concentration of metabolites in S. elongatus grown under circadian conditions. Samples were taken at the end of a full dark or light cycle, respectively. Oxaloacetate concentrations could not be measured due to low abundance and stability but are thought to be extremely low. The concentration values that induce the disassembly of 18mers are taken from the titrations in Fig. 4a. Data are presented as mean values, error bars indicate SD from three biological replicates.
Extended Data Fig. 7
Extended Data Fig. 7. Oligomeric state of extant cyanobacterial CSs and ancestral CSs.
(a) MP measurements of purified CS from extant cyanobacteria. Assembly into fractal 18mers was only detected in the CS of P. mougeotii. The CS from Cyanobium sp. PCC7001, which belongs to the immediate sister-group of S. elongatus formed only dimers. The fractal assembly was therefore lost in this lineage. (b) Rg measurements for ancA-C at varying protein concentrations based on SAXS measurements. One sample for each concentration step was measured over 10 frames. The data presented is the inferred Rg value using Guinier approximation and error bars correspond to the standard deviation of fit values calculated from the covariance matrix (ScÅtter IV). Dashed lines indicate Rgs calculated from structural models of the 6mer, 18mer, and 54mer.
Extended Data Fig. 8
Extended Data Fig. 8. Alternative reconstructions of the ancestral proteins and emergence of fractal assembly.
(a) MP measurements of purified alternative ancestral proteins (altall = all position changed to the second most likely amino acid, if PP > 0.2). (b) Posterior probability for the position 18 of ancA-B. The initial reconstruction was very ambiguous about this state reconstructing Q or L with similar probabilities. The alternative ancestors therefore contained a Q at position 18. The sequence from P. hollandica was added as sister to S. elongatus and the Cyanobium-/Prochloroccous group to the phylogeny, which is well established in cyanobacterial species trees (see methods). Subsequent ancestral sequence reconstruction with the modified alignment shifted the probability strongly towards leucine at position 18. Indicated on the tree are the losses of fractal assembly on two branches, which were observed from the assembly state of extant CS from P. hollandica and Cyanobium (c) MP measurement of the purified CS from P. hollandica. (d) We adjusted the altall sequences of ancA-B to include q18L corresponding to the reconstruction including P. hollandica. MP measurements of purified modified altall ancA-ancB showed assembly into 18mers supported the inference of ancestral assembly states of ancA-B. (e) MP measurements of ancA and SeCS with a reversal to L18q, which prevents assembly into 18mers. (f) Alignment of the inferred amino acid sequences of the ancestral proteins ancA-E and SeCS. Interface residues E6 and H369 are colored in blue and historical changes that were found to have had an influence on the assembly into fractals are colored in red (residues 8, 18, 80). (g) Histograms that display the distribution of the posterior probabilities of the maximum a posterior state across reconstructed sites for all five ancestral proteins. (h) Rg measurements ancC q18L at varying protein concentrations based on SAXS measurements. One sample for each concentration step was measured over 10 frames. The data presented is the inferred Rg value using Guinier approximation and error bars correspond to the standard deviation of fit values calculated from the covariance matrix (ScÅtter IV). Dashed lines indicate Rgs calculated from structural models of the 6mer, 18mer, and 54mer. (i) Close-up of cryo-EM density of SeCS with key substitution L18 annotated. (j) MP measurements of ancC-E variants with the q18L substitution. The substitution only triggers the formation of 18mers when introduced into ancC. Close-up of cryo-EM density of SeCS with key substitutions R8 (k) and F80 (l) annotated. (m) MP measurements of SeCS variants in which the identified important historical substitutions between ancB and ancA were reversed (F80y, R8k). (n) MP quantification of the fraction of CS monomers in 18mers at different pH values for ancC q18L. Two independent measurements were performed for each pH value.

References

    1. Mandelbrot, B. B. The Fractal Geometry of Nature. Vol. 1 (W. H. Freeman and Co., 1982).
    1. Husain, A., Reddy, J., Bisht, D. & Sajid, M. Fractal dimension of coastline of Australia. Sci Rep.11, 6304 (2021). 10.1038/s41598-021-85405-0 - DOI - PMC - PubMed
    1. Du, J. X., Zhai, C. M. & Wang, Q. P. Recognition of plant leaf image based on fractal dimension features. Neurocomputing116, 150–156 (2013).10.1016/j.neucom.2012.03.028 - DOI
    1. Tarboton, D. G., Bras, R. L. & Rodriguez-Iturbe, I. The fractal nature of river networks. Water Resour. Res.24, 1317–1322 (1988).10.1029/WR024i008p01317 - DOI
    1. Shang, J. et al. Assembling molecular Sierpiński triangle fractals. Nat. Chem.7, 389–393 (2015). 10.1038/nchem.2211 - DOI - PubMed

Publication types

MeSH terms

Substances

Supplementary concepts