. 2024 Apr;628(8008):534-539.
doi: 10.1038/s41586-024-07175-9. Epub 2024 Apr 10.

Terahertz electric-field-driven dynamical multiferroicity in SrTiO3

Affiliations

Terahertz electric-field-driven dynamical multiferroicity in SrTiO3

M Basini et al. Nature. 2024 Apr.

Abstract

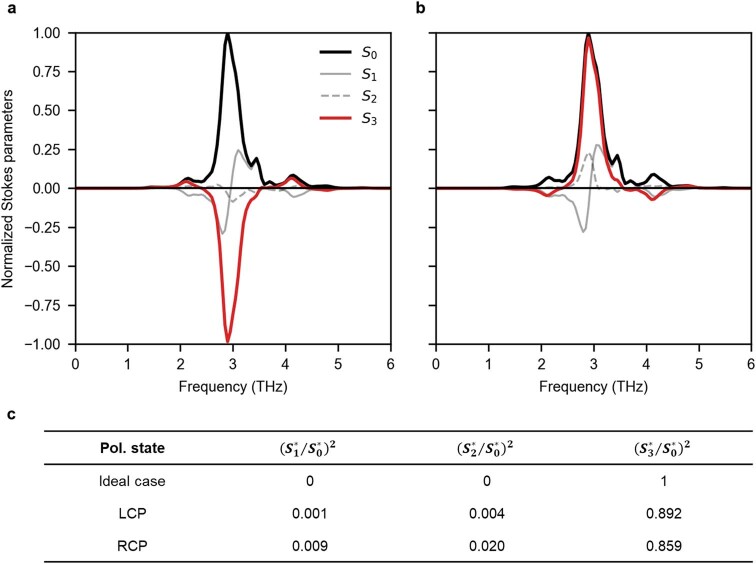
The emergence of collective order in matter is among the most fundamental and intriguing phenomena in physics. In recent years, the dynamical control and creation of novel ordered states of matter not accessible in thermodynamic equilibrium is receiving much attention1-6. The theoretical concept of dynamical multiferroicity has been introduced to describe the emergence of magnetization due to time-dependent electric polarization in non-ferromagnetic materials7,8. In simple terms, the coherent rotating motion of the ions in a crystal induces a magnetic moment along the axis of rotation. Here we provide experimental evidence of room-temperature magnetization in the archetypal paraelectric perovskite SrTiO3 due to this mechanism. We resonantly drive the infrared-active soft phonon mode with an intense circularly polarized terahertz electric field and detect the time-resolved magneto-optical Kerr effect. A simple model, which includes two coupled nonlinear oscillators whose forces and couplings are derived with ab initio calculations using self-consistent phonon theory at a finite temperature9, reproduces qualitatively our experimental observations. A quantitatively correct magnitude was obtained for the effect by also considering the phonon analogue of the reciprocal of the Einstein-de Haas effect, which is also called the Barnett effect, in which the total angular momentum from the phonon order is transferred to the electronic one. Our findings show a new path for the control of magnetism, for example, for ultrafast magnetic switches, by coherently controlling the lattice vibrations with light.


Conflict of interest statement

The authors declare no competing interests.

Figures

Fig. 1
Fig. 1. Schematic of the experimental realization of dynamical multiferroicity.
a, SrTiO3 unit cell in the absence of a terahertz electric field. When a circularly polarized terahertz field pulse drives a circular atomic motion, dynamical multiferroicity is expected to create a net magnetic moment in the unit cell. b,c, The north pole points up for a pulse that is left-handed (b), and down for a pulse that is right-handed (c).
Fig. 2
Fig. 2. Experimental detection of the time-resolved Kerr rotation.
a,b, Measured Kerr rotation as a function of pump–probe delay for 400 nm probe pulses after excitation by the terahertz pump field. The probe polarization is parallel to the [100] crystal axis and the sample is tilted at an angle of 45° (Methods). a, Difference between the responses from circularly polarized fields with opposite helicities. b, FFT of the time trace in a together with the spectrum of the product of the two components Ex and Ey of the incident circular pump field (Methods). The standard error is indicated by the shaded area. Source Data
Fig. 3
Fig. 3. Temperature and field dependence of the measured Kerr rotation.
a, FFT of the difference of the magneto-optical Kerr effect response from opposite circularly polarized fields at a few selected temperatures. The error bars in the legend represent the standard error of the corresponding dataset. b, Dependence of the amplitude of the two main spectral peaks on the terahertz electric field. The standard error is smaller than the symbol size. Blue solid lines are quadratic fits to the data at ω and ω+. Yellow lines indicate the field dependence of the ω and ω+ peaks for the ExEy product, after normalization to the experimental (Exp.) ω+ value at maximum field. Source Data
Fig. 4
Fig. 4. Experimental and modelled dynamical multiferroicity.
a, Calculated total time-domain polarization rotation (blue), which includes the contribution of both EKE and IKE (yellow) and of the magnetic moment μph due to dynamical multiferroicity (orange). b, FFT of the time-domain response, decomposing the spectral features of the different contributions. c, Calculated temperature dependence of the magnetic moment expected from the pure dynamical multiferroicity mechanism (semi-transparent symbols and line) and experimentally extracted spectral weight of the low-frequency peak (solid symbols and line). The error bars represent the standard error of the corresponding dataset. d, Pictorial representation of the phonon Barnett effect with enhancement factor B. Source Data
Extended Data Fig. 1
Extended Data Fig. 1. Individual helicity measurements and difference.
a,b, Measured Kerr rotation as a function of pump–probe delay for 400 nm probe pulses after sample excitation via right (RCP) (a) and left (LCP) (b) circularly polarized terahertz pump fields. c, Difference of the responses from circularly polarized fields with opposite helicities (RCP-LCP)/2. d, Its Fourier transform. Source Data
Extended Data Fig. 2
Extended Data Fig. 2. Electro-optical sampling data of the circularly polarized terahertz fields.
a,b, Recorded temporal traces. c,d, Their Fourier transforms. The measurements were performed using a 50-μm-thick GaP crystal cut along the 110 crystallographic direction, and the broadband pulse was filtered by means of a 3 THz filter with approximately 10% bandwidth, as described in the Methods. The two components Ex and Ey of the electric field are shown with red (left circular polarization, LCP) and violet (right circular polarization, RCP) solid lines. In a,b, the reflected terahertz field from the back side of the GaP crystal starts to interfere with the direct beam at approximately t = 3.8 ps. This complicates the electro-optic sampling data presented here, but it has no importance in all measurements on the STO crystal presented in the main text. In STO, the large terahertz absorption suppresses the back-side reflection below the experimental noise level. Source Data
Extended Data Fig. 3
Extended Data Fig. 3. Stokes parameters in the frequency domain.
a, Stokes parameters extracted from the LCP pump trace. b, Stokes parameters extracted from the RCP pump trace. The polarization state can be described by these four parameters: S0 represents the intensity, S1 and S2 are associated with linear polarization along two sets of orthogonal axes, and S3 is associated with circular polarization. c, Table collecting the Stokes parameters integrated in a 0.5 THz range around the main peaks in a,b. The (S3*/S0*)2 quantity can be considered as an indication of the average amount of circular polarization, and it takes a value of 1 for ideal circularly polarized light. Source Data
Extended Data Fig. 4
Extended Data Fig. 4. Complex permittivity and refractive index for STO in the terahertz regime.
a, Complex permittivity of STO at T = 300 K used for the simulations. The functional dependence was found assuming a Lorentz oscillator with linewidth and oscillator strength taken from ref. , while the resonance frequency was matched with the experimental soft phonon frequency of ref. and listed in Extended Data Table 1. b, Temperature dependence of the real and imaginary parts of the refractive index in STO at 3 THz, and corresponding penetration depth ldecay. All values were estimated considering the dielectric function plotted in a and properly shifted to take into account the variation of the dielectric function with temperature. Source Data
Extended Data Fig. 5
Extended Data Fig. 5. Magneto-optical Faraday effect in STO at 400 nm.
Faraday rotation experienced by the transmitted 400 nm probe beam at normal incidence when a magnetic field is applied in the direction of the probe propagation (that is, perpendicularly to the sample surface). The measurements were performed with a balanced detection scheme equipped with a half-wave plate, and the P and S polarization directions were defined by the Wollaston prism. After switching the probe polarization from P to S, the same balancing orientation for the half-wave plate was maintained, in order to ensure consistency between measurements. The solid lines represent linear fits to the data, which allow us to estimate an average Verdet constant of approx. 180 rad m−1 T−1. The change of sign when the polarization is switched from P to S is consistent with a magnetic origin of the signal. Source Data
Extended Data Fig. 6
Extended Data Fig. 6. Measured polarization rotation in STO at 400 nm and 800 nm probe wavelengths.
a, Fourier transform of the measured Faraday rotation trace with a probe wavelength of 400 nm (solid blue curve), compared with the spectrum of the product of the two components Ex and Ey of the incident circular pump field (filled yellow area). b, Fourier transform of the measured Faraday rotation trace with a probe wavelength of 800 nm (solid red curve), corresponding to a photon energy of 1.55 eV, less than half of the direct bandgap in STO. Source Data
Extended Data Fig. 7
Extended Data Fig. 7. Response of STO to circularly and linearly polarized pump pulses.
a, Measured Kerr rotation signals for different pump helicities. The blue solid line shows the difference of the Kerr rotation signal between right (RCP) and left (LCP) circularly polarized terahertz fields. The black solid line is the Kerr rotation measured with a linearly polarized pump field of the same amplitude. b, Simulated Kerr rotation considering only the electronic Kerr effect (EKE) nonlinear contribution, as discussed in the Methods. Both the simulated signals were rescaled by the same factor in order to reproduce the measured amplitude of the experimental linear signal, for which the dynamical multiferroicity effect is not present. c, Difference between the experimental and simulated Kerr rotation for the circularly polarized pump case. See Methods for details. Source Data
Extended Data Fig. 8
Extended Data Fig. 8. Phonon dispersion curves of cubic STO.
The curves were calculated based on the harmonic approximation (dashed lines) and the self-consistent phonon theory at 300 K (solid lines). The experimental inelastic neutron scattering data are also shown for comparison (open symbols). Source Data

References

    1. Fausti, D. et al. Light induced superconductivity in a stripe-ordered cuprate. Science331, 189–191 (2011). - PubMed
    1. Först, M. et al. Nonlinear phononics as a new ultrafast route to lattice control. Nat. Phys.7, 854–856 (2011).
    1. Liu, M. et al. Terahertz-field-induced insulator-to-metal transition in vanadium dioxide metamaterial. Nature487, 345–348 (2012). - PubMed
    1. Mankowsky, R., von Hoegen, A., Först, M. & Cavalleri, A. Ultrafast reversal of the ferroelectric polarization. Phys. Rev. Lett.18, 197601 (2017). - PubMed
    1. Von Hoegen, A., Mankowsky, R., Fechner, M., Först, M. & Cavalleri, A. Probing the interatomic potential of solids with strong-field nonlinear phononics. Nature555, 79 (2018). - PubMed