. 2024 May;629(8010):211-218.
doi: 10.1038/s41586-024-07300-8. Epub 2024 Apr 10.

FOXO1 is a master regulator of memory programming in CAR T cells

Affiliations

FOXO1 is a master regulator of memory programming in CAR T cells

Alexander E Doan et al. Nature. 2024 May.

Erratum in

  • Publisher Correction: FOXO1 is a master regulator of memory programming in CAR T cells.
    Doan AE, Mueller KP, Chen AY, Rouin GT, Chen Y, Daniel B, Lattin J, Markovska M, Mozarsky B, Arias-Umana J, Hapke R, Jung IY, Wang A, Xu P, Klysz D, Zuern G, Bashti M, Quinn PJ, Miao Z, Sandor K, Zhang W, Chen GM, Ryu F, Logun M, Hall J, Tan K, Grupp SA, McClory SE, Lareau CA, Fraietta JA, Sotillo E, Satpathy AT, Mackall CL, Weber EW. Doan AE, et al. Nature. 2024 May;629(8011):E11. doi: 10.1038/s41586-024-07450-9. Nature. 2024. PMID: 38654101 Free PMC article. No abstract available.

Abstract

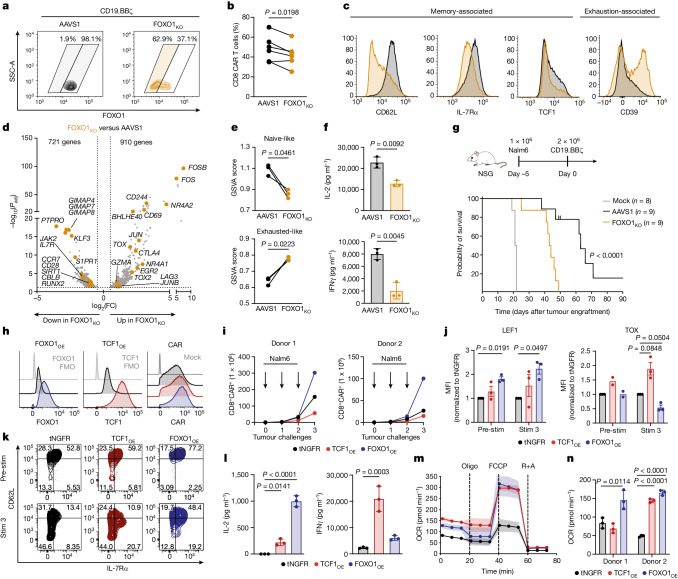
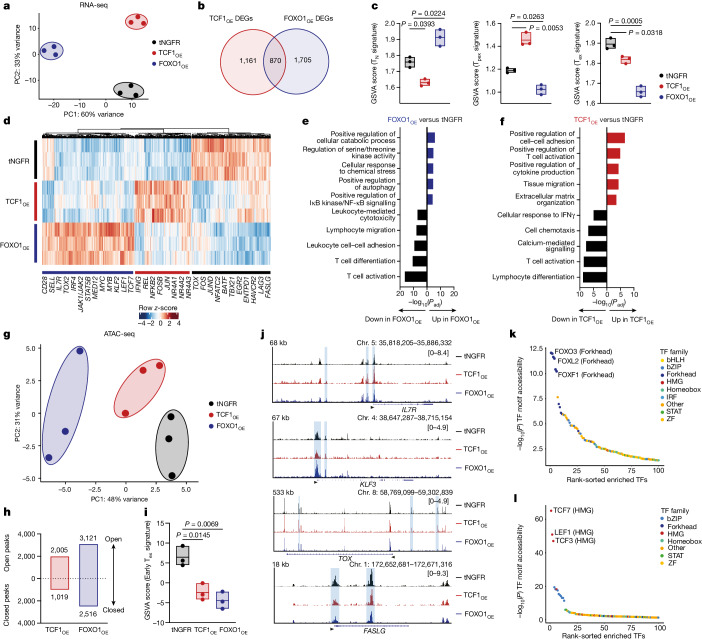
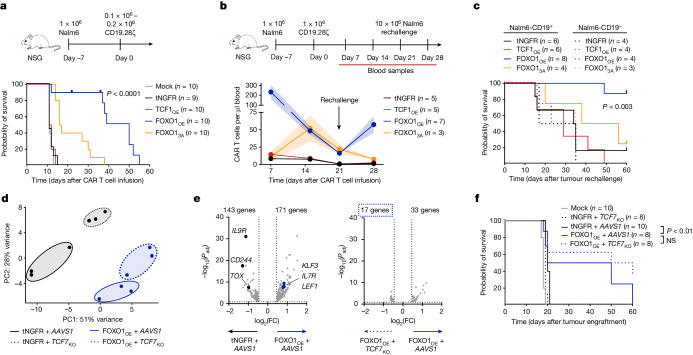
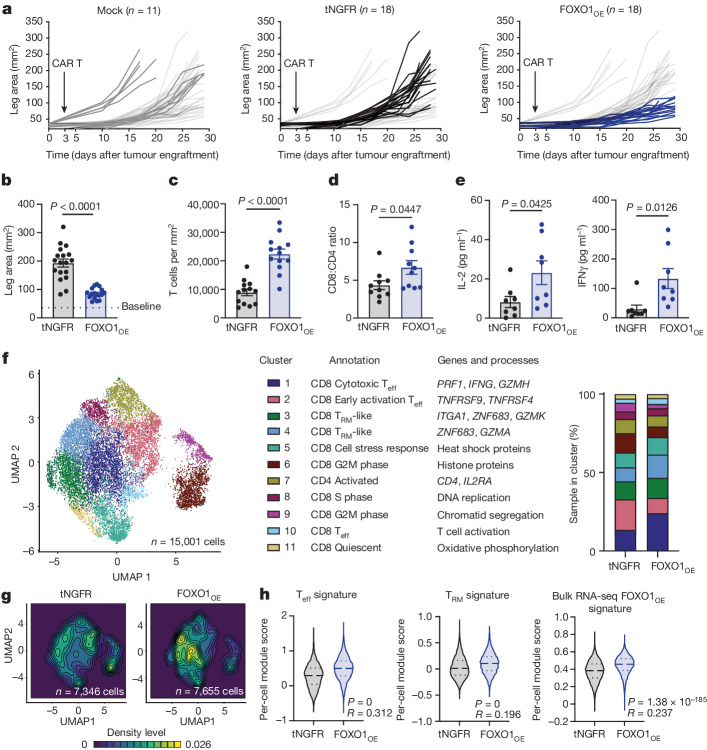
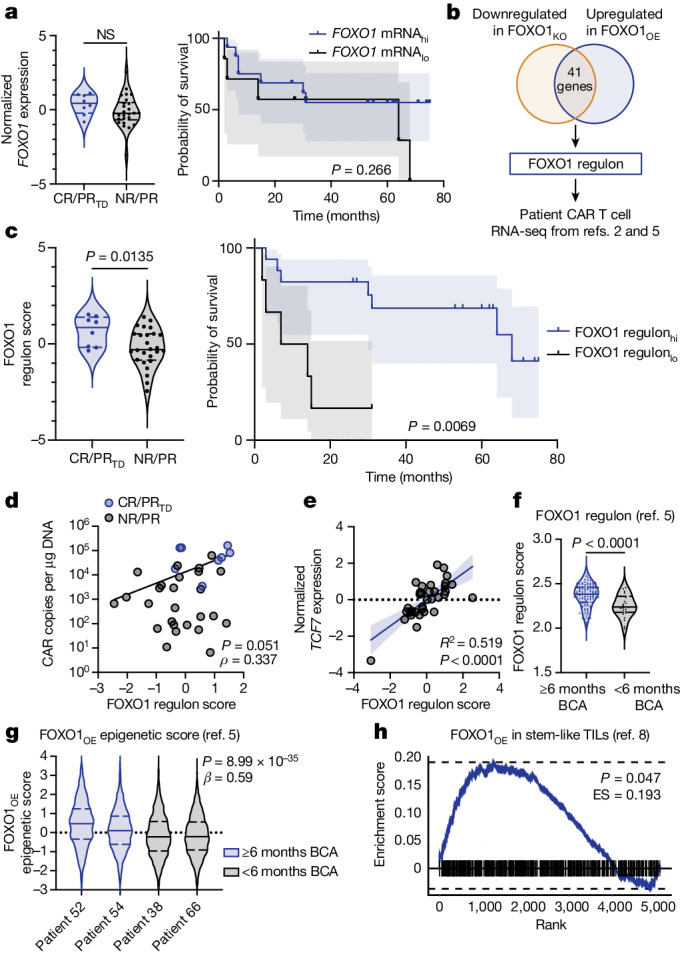
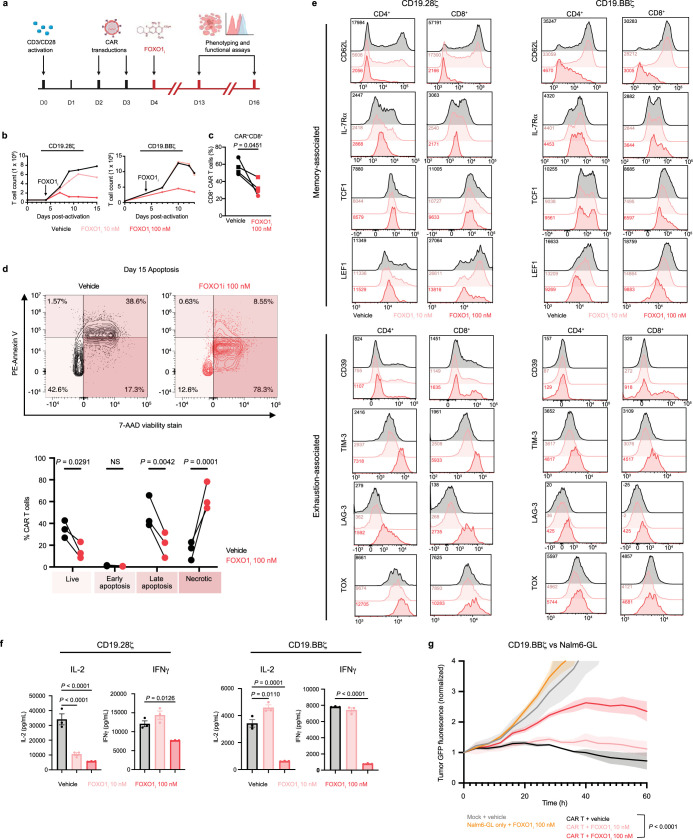
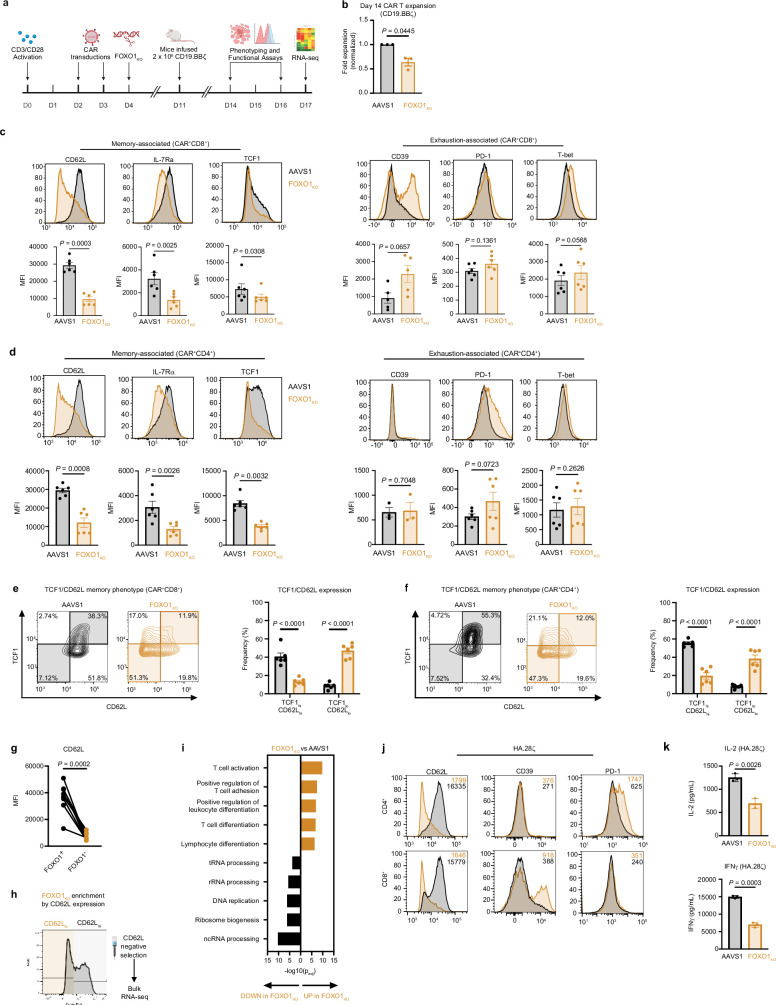
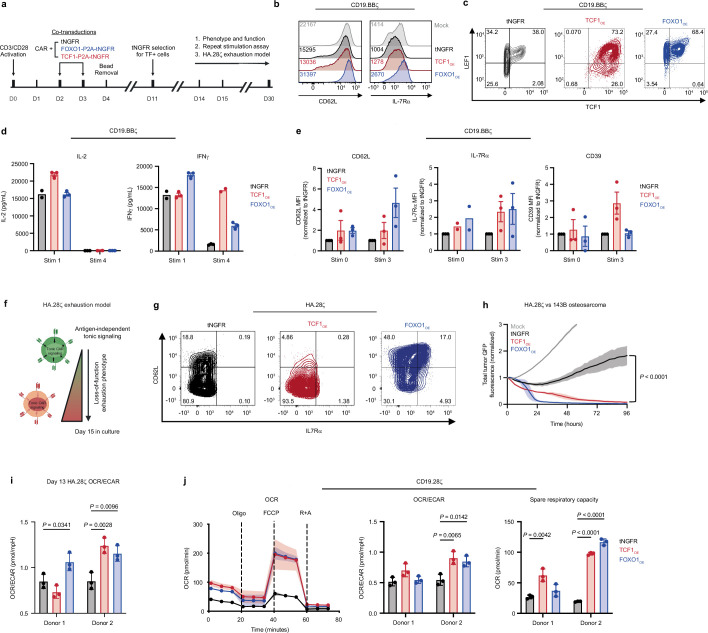
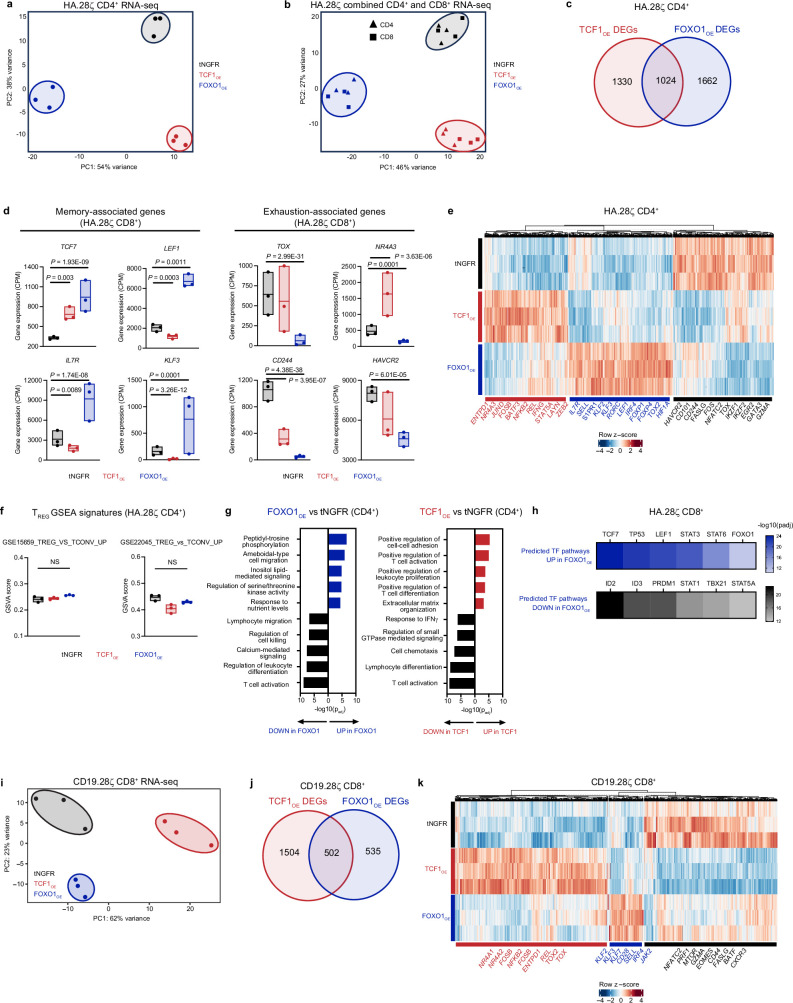
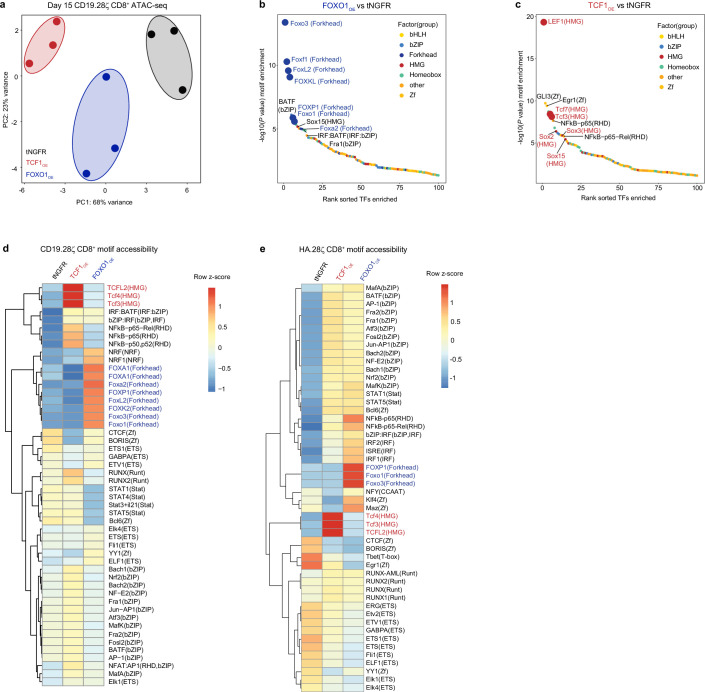
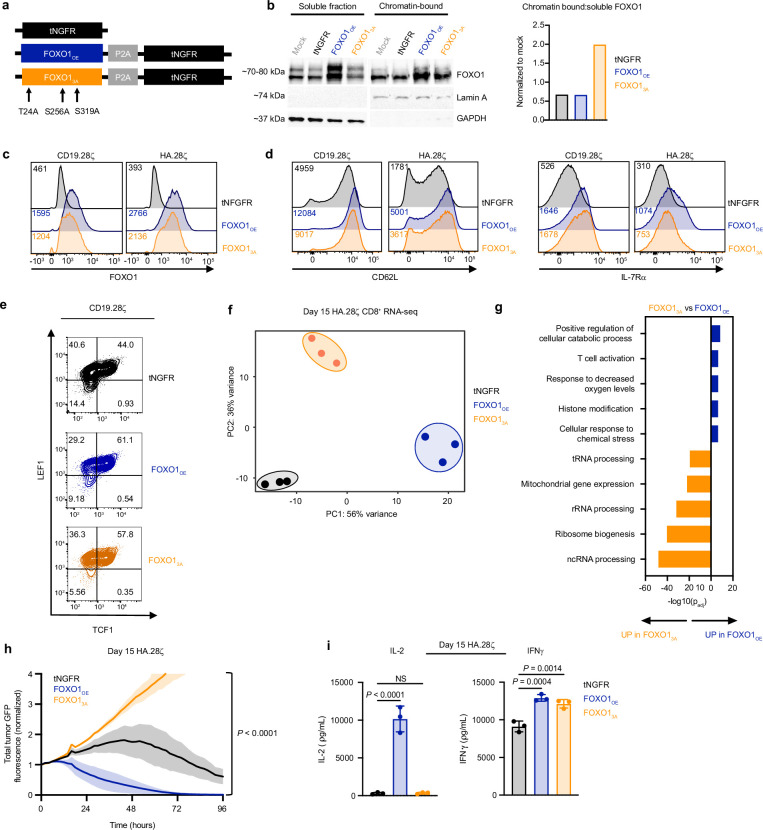
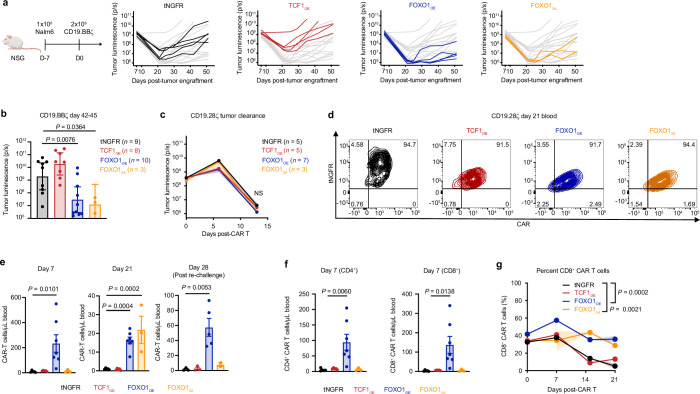
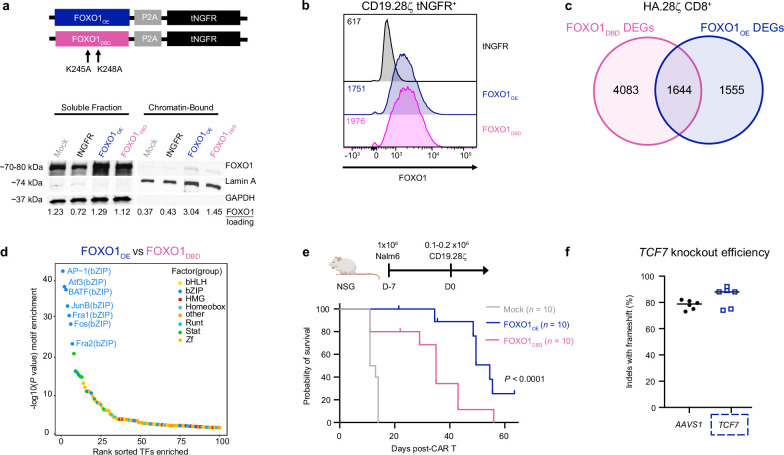
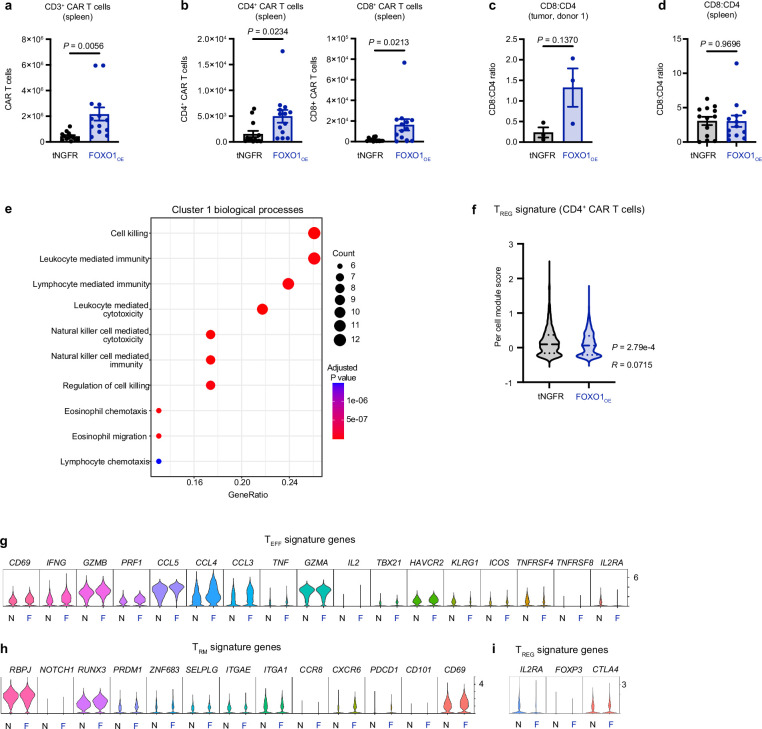
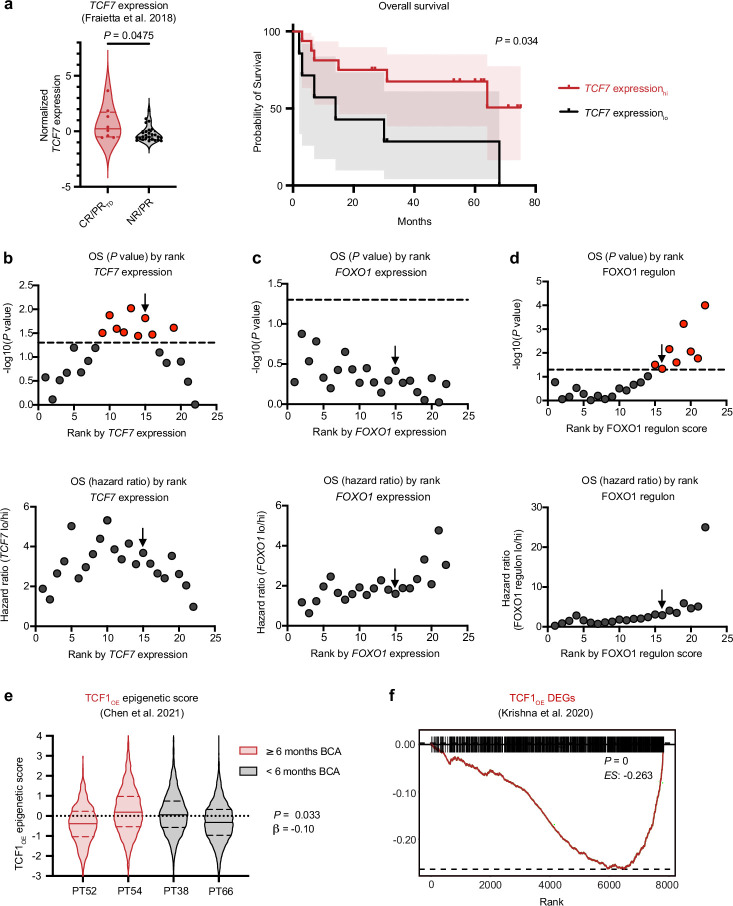
A major limitation of chimeric antigen receptor (CAR) T cell therapies is the poor persistence of these cells in vivo1. The expression of memory-associated genes in CAR T cells is linked to their long-term persistence in patients and clinical efficacy2-6, suggesting that memory programs may underpin durable CAR T cell function. Here we show that the transcription factor FOXO1 is responsible for promoting memory and restraining exhaustion in human CAR T cells. Pharmacological inhibition or gene editing of endogenous FOXO1 diminished the expression of memory-associated genes, promoted an exhaustion-like phenotype and impaired the antitumour activity of CAR T cells. Overexpression of FOXO1 induced a gene-expression program consistent with T cell memory and increased chromatin accessibility at FOXO1-binding motifs. CAR T cells that overexpressed FOXO1 retained their function, memory potential and metabolic fitness in settings of chronic stimulation, and exhibited enhanced persistence and tumour control in vivo. By contrast, overexpression of TCF1 (encoded by TCF7) did not enforce canonical memory programs or enhance the potency of CAR T cells. Notably, FOXO1 activity correlated with positive clinical outcomes of patients treated with CAR T cells or tumour-infiltrating lymphocytes, underscoring the clinical relevance of FOXO1 in cancer immunotherapy. Our results show that overexpressing FOXO1 can increase the antitumour activity of human CAR T cells, and highlight memory reprogramming as a broadly applicable approach for optimizing therapeutic T cell states.


Conflict of interest statement

C.A.L. is a consultant to Cartography Biosciences. S.A.G. receives research funding from Novartis, Kite, Vertex and Servier; consults for Novartis, Roche, GSK, Humanigen, CBMG, Eureka, Janssen/JNJ and Jazz Pharmaceuticals; and has advised for Novartis, Adaptimmune, TCR2, Cellctis, Juno, Vertex, Allogene, Jazz Pharmaceuticals and Cabaletta. J.A.F. receives research funding from Tceleron (formerly Tmunity Therapeutics) and Danaher Corporation; consults for Retro Biosciences; and is a member of the scientific advisory boards of Cartography Biosciences and Shennon Biotechnologies. A.T.S. is a founder of Immunai and Cartography Biosciences and receives research funding from Allogene Therapeutics and Merck Research Laboratories. C.L.M. is a co-founder of and holds equity in Link Cell Therapies, Cargo Therapeutics (formerly Syncopation Life Sciences) and Lyell Immunopharma; holds equity and consults for Mammoth and Ensoma; consults for Immatics and Nektar; and receives research funding from Tune Therapeutics. E.W.W. holds equity in Lyell Immunopharma and consults for Umoja Immunopharma. The remaining authors declare no competing interests.

Figures

Fig. 1
Fig. 1. FOXO1 is necessary and sufficient for memory and antitumour function in human CAR T cells.
ag, CRISPR–Cas9 gene editing of AAVS1 (AAVS1) or FOXO1 (FOXO1KO) in CD19.BBζ CAR T cells. ac, Flow cytometric analysis of FOXO1 knockout efficiency (a), percentage of CAR+ CD8+ cells at day 14 (b) and memory- and exhaustion-associated markers in CAR+CD8+ cells (c). Shaded areas in a represent gates used in phenotypic analyses. One representative donor is shown in a and c (n = 6 donors). d, Volcano plot of DEGs in CD62Llo FOXO1KO versus AAVS1 (Bonferroni-adjusted P < 0.05 with absolute log2-transformed fold change (abs(log2(FC)) > 0.5). e, GSVA using T cell gene signatures. f, Cytokine secretion in response to Nalm6 leukaemia cells from one representative donor (n = 4 donors). g, Stress test Nalm6 xenograft model. Top, schematic. Bottom, survival curves of Nalm6-engrafted mice treated with mock T cells or gene-edited CD19.BBζ cells. Data show two donors tested in two independent experiments (n = 8 or 9 mice per group). Data in d and e include n = 3 donors. hn, CAR T cells overexpressing truncated NGFR (tNGFR), TCF1-P2A-tNGFR (TCF1OE) or FOXO1-P2A-tNGFR (FOXO1OE). h, Flow cytometric analysis of FOXO1, TCF1 and CD19.28ζ expression from one representative donor (n = 8 donors). FMO, fluorescence minus one. ik, Serial restimulation of CD19.BBζ cells with Nalm6. CD8+ CAR T cell expansion (i) and flow cytometric analysis of memory- and exhaustion-associated markers (j,k). j, Mean ± s.e.m. of normalized mean fluorescence intensity (MFI) (n = 2 or 3 donors). k, One representative donor (n = 4 donors). l, HA.28ζ cytokine secretion (day 13) in response to 143B osteosarcoma cells from one representative donor (n = 4 donors). m,n, HA.28ζ seahorse analysis (day 13) (n = 2 donors). m, Oxygen consumption rate (OCR) (mean ± s.d. of 11 technical replicates from one representative donor). Oligo, oligomycin; R+A, rotenone and antimycin. n, Spare respiratory capacity. Data in f,l,n are mean ± s.d. of three technical replicates. Statistical comparisons were performed using paired two-tailed Student’s t-test (b,e), two-sided Welch’s t-test (f), log-rank Mantel–Cox test (g) and repeated-measures one-way ANOVA with Geisser–Greenhouse correction (j) or one-way ANOVA with Dunnett’s test (l,n) . Source Data
Fig. 2
Fig. 2. Overexpression of FOXO1, but not TCF1, induces transcriptional and epigenetic features of T cell memory.
al, Bulk RNA-seq (af) and ATAC-seq (gl) in tNGFR+CD8+ HA.28ζ CAR T cells (n = 3 donors). a, RNA-seq PCA. b, Venn diagram showing unique and shared DEGs in TCF1OE and FOXO1OE compared with tNGFR (Bonferroni-adjusted P < 0.05 with abs(log2(FC) > 0.5). c, GSVA of DEGs using naive (TN), Tpex and exhausted (Tex) T cell signatures. Centre line represents mean score. d, Heat map and hierarchical clustering of DEGs. Genes of interest are highlighted. The colour bar shows normalized z-scores for each DEG. e,f, GO term analyses showing curated lists of the top upregulated and downregulated processes in FOXO1OE (e) and TCF1OE (f) versus tNGFR (Benjamini–Hochberg-adjusted P). g, ATAC-seq PCA. h, Number of differentially accessible peaks compared with tNGFR (P < 0.05 with abs(log2FC) > 0.5). i, GSVA of differentially accessible peaks using an early Tex cell epigenetic signature. Centre line represents mean score. j, Chromatin accessibility tracks for the IL7R, KLF3, TOX and FASLG loci, for one representative donor. k,l, Rank-ordered plots of differentially accessible transcription factor (TF)-binding motifs in FOXO1OE (k) and TCF1OE (l) versus tNGFR. ZF, zinc-finger. Statistical comparisons were performed using DESeq2 (b,d,h,k,l), one-sided hypergeometric test (e,f) and repeated-measures one-way ANOVA with Dunnett’s test (c,i). Source Data
Fig. 3
Fig. 3. Overexpression of FOXO1 enhances CAR T cell persistence and antitumour activity against leukaemia in a TCF7-independent manner.
a, Subcurative doses of 0.1 × 106–0.2 × 106 tNGFR+ CD19.28ζ cells were infused into Nalm6-bearing mice seven days after engraftment. Schematic (top) and survival curve (bottom) are shown; n = 9-10 mice per group. bd, Curative doses of 1 × 106 tNGFR+ CD19.28ζ cells were infused into Nalm6-bearing mice seven days after engraftment. Mice were rechallenged with 10 × 106 CD19+ or CD19 Nalm6 on day 21 after CAR T cell infusion (n = 2 donors tested in 2 independent experiments). b, Rechallenge Nalm6 model. Schematic (top) and quantification (bottom) of circulating human CD45+ CAR T cells. Mean ± s.e.m. of n = 3–7 mice per group from one representative donor. c, Survival curve after rechallenge (n = 3–8 mice per group pooled from 2 donors). df, CD19.28ζ cells overexpressing tNGFR or FOXO1OE were gene-edited to knock out AAVS1 (control; AAVS1) or TCF7 (TCF7KO). d, RNA-seq PCA. e, Volcano plots of DEGs; n = 3 donors (Bonferroni-adjusted P < 0.05 with abs(logFC) > 0.5). f, Stress test Nalm6 model. tNGFR+ CD19.28ζ cells (0.6 × 106 cells) were infused into Nalm6-bearing mice seven days after engraftment. Survival curve is shown (n = 8–10 mice per group). a,c,f show pooled data from two donors tested in two independent experiments. Statistical comparisons were performed using log-rank Mantel–Cox test (a,c,f) and DESeq2 (e). NS, not significant. Source Data
Fig. 4
Fig. 4. FOXO1OE CAR T cells exhibit enhanced tumour control and sustained effector function in solid tumours.
A total of 5 × 106 mock or tNGFR+ Her2.BBζ CAR T cells expressing tNGFR or FOXO1OE were infused into 143B-bearing mice three days after engraftment. a,b, Tumour measurements over time (a) and on day 25–29 (b). One FOXO1OE mouse has been omitted in b owing to tumour-independent death before day 25. Data were pooled from three donors tested in three independent experiments (n = 11–18 mice per group). ce, Analysis of day-29 CAR TILs. c, Total CAR TILs (n = 13 mice per group). d, Ratio of CD8+ to CD4+ CAR TILs. One representative donor (n = 10 mice per group). e, CAR TIL IL-2 and IFNγ secretion after ex vivo stimulation with 143B (n = 13 mice per group). Data in ce were pooled from two donors tested in two independent experiments. fh, Single-cell RNA-seq on day-29 CAR TILs. Cells were sorted and pooled from n = 5 mice per group from one donor. f, Left, uniform manifold approximation and projection (UMAP) of CAR TILs. Eleven clusters were identified with k-nearest neighbours clustering, and were annotated manually (middle). Right, sample distribution by cluster. Teff, T effector cell; TRM, tissue resident memory T cell. g, Sample distribution within the UMAP. h, Teff, TRM and FOXO1OE-associated transcriptional signatures. Long dashed lines represent the mean and short dashed lines represent the top and bottom quartiles. Data in be are mean ± s.e.m. Statistical comparisons were performed using two-tailed Student’s t-test (be) and two-sided Wilcoxon rank-sum test (h). Source Data
Fig. 5
Fig. 5. FOXO1 activity correlates with clinical responses to CAR T cell and TIL therapies.
ae, Single-sample gene set enrichment analysis (ssGSEA) on RNA-seq from pre-infusion, CAR-stimulated CTL019 cells from patients with CLL (complete responder (CR), n = 5; partial responder with transformed disease (PRTD), n = 3; partial responder (PR), n = 5; non-responder (NR), n = 21). a, FOXO1 ssGSEA for patient outcomes (left) and overall survival (right). b, The FOXO1 regulon was generated using FOXO1KO and FOXO1OE bulk RNA-seq data and then applied to published datasets,; n = 3 donors. c, FOXO1 regulon ssGSEA (data from ref. ) for patient outcomes (left) and overall survival (right). d, Least squares regression (dark line) of FOXO1 regulon score and peak CAR T cell expansion. e, Simple linear regression (dark line) of TCF7 expression and FOXO1 regulon score. Dark lines in a,c represent patient survival curves and shaded areas in a,c,e represent 95% confidence intervals. Dots in d,e represent individual samples (blue, CR/PRTD; grey, NR/PR). f, FOXO1 regulon ssGSEA for pre-manufactured effector T cells from paediatric patients with B-ALL with durable (six or more months of B cell aplasia (BCA); n = 33 patients) or short (less than six months of BCA; n = 27 patients) CAR T cell persistence. g, An epigenetic signature derived from FOXO1OE ATAC-seq was applied to pre-manufactured T cell single-cell ATAC-seq data from paediatric patients. Data show FOXO1OE epigenetic signature scores for patients with durable (patient 52, n = 616 cells; patient 54, n = 2,959 cells) and short (patient 38, n = 2,093 cells; patient 66, n = 2,355 cells) CAR T cell persistence. h, GSEA using FOXO1OE DEGs and DEGs derived from CD39CD69 TILs from adult patients with melanoma. ES, enrichment score. Violin plots in a,c,f,g show minima and maxima; solid lines represent the mean and long dashed lines represent the top and bottom quartiles. Statistical comparisons were performed using two-tailed Mann–Whitney test (a, left; c, left; f), log-rank Mantel–Cox test (a, right; c, right), Spearman correlation (d,e), two-sided Wald test (g) and two-sided Kolmogorov–Smirnov test (h). Source Data
Extended Data Fig. 1
Extended Data Fig. 1. Pharmacological inhibition of FOXO1 impairs expansion, formation of a memory phenotype and antitumour function in CD19.28ζ and CD19.BBζ CAR T cells.
CAR T cells were treated with DMSO or 10 nM or 100 nM of the small molecule AS1842856 (FOXO1i) starting on day 4 post-activation and treated every 2–3 days thereafter. a, Schematic of FOXO1i experimental model. b, CD19.28ζ (left) or CD19.BBζ (right) CAR T cell expansion (n = 2 donors). c, Percent CD8+ in CD19.28ζ (circles) and CD19.BBζ (squares) cells (n = 2 donors for each CAR). d, Apoptosis in CD19.BBζ CAR T cells at day 15 post-activation. Contour plots show 1 representative donor and bar graphs show mean±s.e.m. of n = 3 donors. e, Expression of memory- and exhaustion-associated markers on CD19.28ζ and CD19.BBζ cells. Histograms show 1 representative donor (n = 2 donors). f, Cytokine secretion from CD19.28ζ and CD19.BBζ cells in response to Nalm6 cells. Graphs show mean±s.d. of triplicate wells from 1 representative donor (n = 2 donors). g, Cytotoxicity of CD19.BBζ cells against Nalm6 cells at a 1:1 E:T ratio. Data is normalized to t = 0 and show mean±s.d. of triplicate wells from 1 representative donor (n = 2 donors). Statistics are shown for t = 60 h. Statistical comparisons were performed using paired two-tailed Student’s t-test (c), two-way ANOVA with Šídák’s test (d) and one-way (f) or two-way (g) ANOVA with Dunnett’s test. E:T ratio, effector:target cell ratio. NS, not significant. Source Data
Extended Data Fig. 2
Extended Data Fig. 2. CRISPR knockout of FOXO1 attenuates memory formation and promotes exhaustion in CD19.BBζ and HA.28ζ CAR T cells.
ai, CRISPR–Cas9 gene editing of AAVS1 (AAVS1) or FOXO1 (FOXO1KO) in CD19.BBζ CAR T cells. a, Schematic depicting generation of FOXO1KO CAR T cells and downstream assays. b, Day 14 FOXO1KO expansion normalized to AAVS1. Data show mean±s.e.m. of n = 3 donors. cf, Flow cytometric analysis of memory- and exhaustion-associated markers on CD8+ (c,e) and CD4+ (d,f) CD19.BBζ cells. Histograms and contour plots show a representative donor and bar graphs show mean±s.e.m. of n = 3-6 donors. CD62L, IL-7Rα, TCF1, and CD39 histograms in c also appear in Fig. 1c. g, MFI of CD62L in FOXO1+ and FOXO1 gated subpopulations of CD19.BBζ cells. h, Schematic showing CD62Llo / FOXO1KO cell negative selection strategy for RNA-seq experiments. i, GO term analyses showing curated lists of up- and downregulated processes in FOXO1KO compared to AAVS1. Data show Benjamini–Hochberg-adjusted P value (n = 3 donors). j, Flow cytometric analysis of memory- and exhaustion-associated markers in day 15 HA.28ζ CAR T cells. Background-subtracted MFI is displayed. k, Cytokine secretion from day 15 HA.28ζ cells in response to Nalm6. Graphs show mean±s.d. of 3 technical replicates from one representative donor (n = 2 donors). Statistical comparisons were performed using paired two-tailed Student’s t-test (b,c,d,g), two-way ANOVA with Bonferroni’s test (e,f), two-tailed Student’s t-test (k) and one-sided hypergeometric test (i). Source Data
Extended Data Fig. 3
Extended Data Fig. 3. FOXO1 overexpression promotes a memory phenotype and mitigates exhaustion in CAR T cells.
a, Schematic depicting engineering of truncated NGFR-only (tNGFR), TCF1/tNGFR- (TCF1OE), and FOXO1/tNGFR- (FOXO1OE) CAR T cells and magnetic isolation of tNGFR+ cells for downstream analyses. be, Phenotypic and functional analyses of CD19.BBζ CAR T cells at baseline and during repeat stimulation with Nalm6 cells. b,c, Flow cytometric analysis of CD62L and IL-7Rα (b) and TCF1 and LEF1 (c) from 1 representative donor (n = 4 donors). d, Cytokine secretion from CD19.BBζ cells after 1 or 4 stimulations with Nalm6 cells. Data show mean ± s.d. of 2–3 triplicate wells from 1 representative donor (n = 2 donors). e, Flow cytometric analysis of CD62L, IL-7Rα, and CD39 on tNGFR+ CD8+ CAR T cells prior to the first stimulation (Stim 0) and 7 days after the third stimulation (Stim 3). Data show mean ± s.e.m. of mean fluorescence intensity normalized to tNGFR levels from n = 2–3 donors. fi, CAR T cell exhaustion model, whereby T cells express a high-affinity GD2-targeting CAR (HA.28ζ) that promotes antigen-independent tonic CAR signalling. f, Model schematic. g, Flow cytometric analysis of day 15 CD62L and IL-7Rα. Data show 1 representative donor (n = 5 donors). h, Cytotoxicity of day 15 HA.28ζ cells against 143B cells at a 1:8 E:T ratio. Data is normalized to t = 0 and show mean±s.d. of 3 triplicate wells from 1 representative donor (n = 3 donors). Statistics were performed at t = 96 h. i,j, Seahorse metabolic analyses on day 13 of culture (n = 2 donors). i, Ratio of OCR to ECAR of HA.28ζ cells. j, CD19.28ζ cell OCR (left), OCR to ECAR ratio (centre), and spare respiratory capacity (right). OCR line graph shows 1 representative donor. Bar graphs show mean ± s.d. of three representative time points within each donor. Statistical comparisons were performed using one-way ANOVA with Tukey’s test (h) or Dunnett’s test (i,j). E:T ratio, effector:target cell ratio. OCR, Oxygen consumption rate. ECAR, extracellular acidification rate. Source Data
Extended Data Fig. 4
Extended Data Fig. 4. Overexpression of FOXO1 induces a memory-like transcriptional program in CAR T cells.
ag, Bulk RNA-seq analyses of day 15 tNGFR+ CD4+ HA.28ζ CAR T cells overexpressing tNGFR, TCF1OE, or FOXO1OE (n = 3 donors). a, PCA of CD4+ cells. b, PCA that includes CD4+ samples plotted in a and CD8+ samples plotted in Fig. 2a. c, Venn diagram showing the number of unique and shared DEGs in CD4+ TCF1OE and FOXO1OE cells compared to tNGFR cells (Bonferroni-adjusted P < 0.05 with abs(log2FC)>0.5). d, Expression of memory- and exhaustion-associated genes. Centre line represents the mean counts per million. e, Heat map and hierarchical clustering of DEGs. Genes of interest are shown. Scale shows normalized z-scores for each DEG. f, GSVA using published human CD4+ regulatory T cell (Treg) signatures,. Centre line represents mean score. g, GO term analyses showing curated lists of top up- and downregulated processes in CD4+ FOXO1OE and TCF1OE cells versus tNGFR cells. Data show Benjamini–Hochberg-adjusted P. h, QIAGEN IPA of upregulated and downregulated TF pathways in FOXO1OE cells versus tNGFR cells. Data show adjusted P. ik, Bulk RNA-seq analyses of day 15 tNGFR+ CD8+ CD19.28ζ cells overexpressing tNGFR, TCF1OE, or FOXO1OE (n = 3 donors). i, PCA analysis. j, Venn diagram showing the number of unique and shared DEGs in TCF1OE and FOXO1OE cells compared to tNGFR cells (Bonferroni-adjusted P < 0.05 with log2(fold change) < 0.5). k, Heat map and hierarchical clustering of DEGs. Genes of interest are shown. Scale shows normalized z-scores for each DEG. Statistical comparisons were performed using DESeq2 (c,d,e,j,k), repeated-measures one-way ANOVA with Tukey’s test (f) and one-sided hypergeometric test (g). NS, not significant. Source Data
Extended Data Fig. 5
Extended Data Fig. 5. FOXO1 or TCF1 overexpression induces chromatin remodelling in CD19.28ζ and HA.28ζ CAR T cells.
ae, Bulk ATAC-seq analyses of day 15 tNGFR+ CD8+ CAR T cells expressing either CD19.28ζ (ad) or HA.28ζ (e) (n = 3 donors). a, PCA of CD19.28ζ cells. b,c, Rank-ordered plot of differentially accessible TF-binding motifs (P < 0.05 with abs(log2FC)>0.5) in FOXO1OE cells (b) and TCF1OE cells (c) versus tNGFR cells. d,e, Heat maps and hierarchical clustering of mean differential motif accessibility of CD19.28ζ (d) or HA.28ζ (e) cells. Scales show normalized z-scores for each motif. Statistical comparisons were performed using DESeq2 (be).
Extended Data Fig. 6
Extended Data Fig. 6. Nuclear-restricted FOXO1 promotes a memory-like phenotype but impairs effector function.
a, Schematic showing a mutated variant of FOXO1 that contains three amino acid substitutions (T24A, S256A, and S319A) which restrict nuclear export (FOXO13A). b, Analysis of soluble and chromatin-bound FOXO1 fractions isolated from tNGFR+ non-CAR T cells that were activated with Dynabeads for 24 h prior to cell collection. Western blots (left) and bar graph (right) representing the ratio of chromatin-bound to soluble FOXO1 normalized to mock T cells are shown for 1 representative donor (n = 2 donors). c, FOXO1 expression in CD19.28ζ and HA.28ζ CAR T cells from 1 representative donor (n = 5 donors). d, CD62L and IL-7Rα expression in CD19.28ζ and HA.28ζ CAR T cells from 1 representative donor (n = 3 donors). e, TCF1 and LEF1 expression in CD19.28ζ CAR T cells from 1 representative donor (n = 3 donors). f,g, RNA-seq on HA.28ζ CAR T cells. tNGFR and FOXO1OE samples are also represented in Fig. 2 and Extended Data Fig. 4. f, PCA. g, GO term analyses showing curated lists of top up- and downregulated processes in FOXO13A vs FOXO1OE. Data show Benjamini–Hochberg-adjusted P value. h, Cytotoxicity of HA.28ζ cells against Nalm6 at a 1:1 E:T ratio. Data are normalized to t = 0 and show mean±s.d. from 1 representative donor (n = 3 donors). Statistics were performed at t = 96 h. i, Cytokine secretion from day 15 HA.28ζ CAR T cells in response to 143B cells. Plots show mean±s.d. of 3 wells from 1 representative donor (n = 3 donors). Statistical comparisons were performed using one-sided hypergeometric test (g), one-way ANOVA with Tukey’s test (h) or Dunnett’s test (i). E:T ratio, effector:target cell ratio. Source Data
Extended Data Fig. 7
Extended Data Fig. 7. FOXO1OE CAR T cells show enhanced antitumour activity in leukaemia xenograft models.
a,b, A curative dose of 2×10⁶ tNGFR+ CD19.BBζ CAR T cells overexpressing tNGFR, TCF1OE, FOXO1OE, or FOXO13A were infused into Nalm6 leukaemia-bearing mice 7 days post-engraftment (n = 2 donors tested in 2 independent experiments) a, Experimental schematic (left) and tumour bioluminescence of multiple time points (right) from 1 representative donor (n = 3-5 mice per group). b, Tumour bioluminescence from day 42-45. Data show mean±s.e.m. from 2 donors tested in 2 independent experiments (n = 3-10 mice per group; n = 1 donor for FOXO13A). cg, A curative dose of 1×10⁶ tNGFR+ CD19.28ζ cells were infused into Nalm6-bearing mice 7 days post-engraftment. Mice were rechallenged with 10×106 CD19+ or CD19 Nalm6 on day 21 post-CAR T cell infusion (n = 2 donors tested in 2 independent experiments). c, Tumour bioluminescence over time. Data show mean±s.e.m. of n = 3–7 mice per group from 1 representative donor. d, CD19.28ζ and tNGFR expression on circulating CD45+ CAR T cells on day 21. Contour plots show 1 representative mouse from each condition from 1 representative donor. e, Quantification of circulating CD45+ CAR T cells on days 7, 21, and 28. f, CD4+ and CD8+ CAR T cells on day 7 (data derived from e). g, Percent CD8+ CAR T cells. Graphs in eg show mean±s.e.m. of n = 3–7 mice per group from 1 representative donor. Statistical comparisons were performed using nonparametric two-tailed Mann–Whitney test (b) and two-way (c) and one-way ANOVA with Dunnett’s test (e,f) and mixed-effects model with Dunnett’s test (g). NS, not significant. Source Data
Extended Data Fig. 8
Extended Data Fig. 8. FOXO1OE reprogramming and enhanced antitumour activity are dependent on DNA binding.
a, Schematic depicting construct design and amino acid substitutions (K245A and K248A) to generate human FOXO1DBD (top) and western blots of indicated proteins in soluble and chromatin-bound fractions isolated from day 8 tNGFR+ CD19.28ζ CAR T cells (bottom). Densitometry analyses are displayed below the blots. 1 representative donor from n = 2 donors. b, FOXO1 expression in CD19.28ζ CAR T cells from one representative donor (n = 5 donors). c, Bulk RNA-seq analyses of day 15 tNGFR+ CD8+ HA.28ζ CAR T cells show unique and shared DEGs in FOXO1DBD and FOXO1OE compared with tNGFR (Bonferroni-adjusted P < 0.05 with abs(log2FC)>0.5). FOXO1OE samples are also represented in Fig. 2 and Extended Data Figs. 4 and 6. d, Bulk ATAC-seq of day 15 tNGFR+ CD8+ HA.28ζ CAR T cells. Rank-ordered plot of differentially accessible TF-binding motifs in FOXO1OE cells versus FOXO1DBD cells (P < 0.05 with abs(log2FC)>0.5). FOXO1OE samples are also represented in Fig. 2 and Extended Data Fig. 5. e, Schematic of stress test model (left) whereby Nalm6-engrafted mice were treated with mock T cells or FOXO1OE or FOXO1DBD CD19.28ζ CAR T cells. Survival curve shows pooled data from 2 donors tested in 2 independent experiments (n = 10 mice per group, FOXO1OE data from 1 donor are also represented in Fig. 3a). f, TCF7 knockout efficiency for bulk RNA-seq data corresponding to Fig. 3f,g. Data show the mean of n = 3 donors with 2 technical replicates per donor. Statistical comparisons were performed using DESeq2 (c,d) and log-rank Mantel–Cox test (e). Source Data
Extended Data Fig. 9
Extended Data Fig. 9. FOXO1OE CAR T cells exhibit improved persistence and effector- and tissue-residence-associated transcriptomic signatures in a solid-tumour xenograft model.
5×10⁶ Her2.BBζ CAR T cells were infused into 143B-bearing mice 3 days post-engraftment. Tumours and spleens were collected on day 29 post-engraftment for phenotypic, functional, and sequencing-based assays. a, Total splenic CAR T cells. b, Total CD4+ (left) and CD8+ (right) splenic CAR T cells. c, Ratio of CD8+ to CD4+ tumour-infiltrating CAR T cells from donor 1 (n = 3 mice per group). Donor 2 is shown in Fig. 4d. d, Ratio of CD8+ to CD4+ CAR T cells from spleens. Data in ad show mean±s.d. of n = 13 mice per group from 2 donors tested in 2 independent experiments unless otherwise stated. ei, Single-cell RNA-seq on day 29 tumour-infiltrating FOXO1OE or tNGFR cells. Cells were sorted and pooled from n = 5 mice per group from 1 donor. e, Top enriched GO terms in Cluster 1, which was biased towards FOXO1OE cells. Gene ratio and Benjamini–Hochberg-adjusted P value are shown. f, Treg transcriptional signature score. g, Teff signature genes corresponding to Teff scores in Fig. 4i. h, TRM signature genes corresponding to TRM scores in Fig. 4i. i, Treg signature genes corresponding to scores in f. Statistical comparisons were performed using two-tailed Student’s t-test (a-d), one-sided hypergeometric test (e) and two-sided Wilcoxon rank-sum test (f). Source Data
Extended Data Fig. 10
Extended Data Fig. 10. Endogenous TCF7 transcript and FOXO1 regulon, but not TCFOE transcriptional or epigenetic signatures, predict CAR T cell and TIL responses in patients.
a, ssGSEA on RNA-seq from CAR-stimulated CTL019 cells (complete responder, CR, partial responder with transformed disease, PRTD, n = 3; partial responder, PR, n = 5; non-responder, NR, n = 21). Enrichment score stratification points for patient survival analyses were determined using previously published methods. a, TCF7 expression is shown for patient outcomes (left) and overall survival (right). bd, P values (top) and hazard ratios (bottom) of different stratification points in relation to overall survival (OS) of TCF7 expression (b), FOXO1 expression (c) and FOXO1 regulon (d). Dotted lines are drawn at P < 0.05 and black arrows indicate the stratification points used. e, An epigenetic signatured derived from CD8+ CD19.28ζ FOXO1OE bulk ATAC-seq data was applied to pre-manufactured paediatric CAR T cell single-cell ATAC-seq data. Violin plots show TCF1OE epigenetic signature scores for patients with durable (Patient 52, n = 616 cells; Patient 54, n = 2959 cells) and short (Patient 38, n = 2093 cells; Patient 66, n = 2355 cells) CAR T cell persistence. f, GSEA was performed with CD8+ HA.28ζ TCF1OE DEGs and DEGs derived from CD39CD69 patient TILs in adult melanoma. Violin plots in a,e show minima and maxima; centre lines represent mean; dashed lines represent top and bottom quartiles. Statistical comparisons were performed using two-tailed Mann–Whitney test (a, left), log-rank Mantel–Cox test (a, right), two-sided Wald test (e), and two-sided Kolmogorov–Smirnov test (f). Source Data

Update of

References

    1. Weber EW, Maus MV, Mackall CL. The emerging landscape of immune cell therapies. Cell. 2020;181:46–62. doi: 10.1016/j.cell.2020.03.001. - DOI - PMC - PubMed
    1. Fraietta JA, et al. Determinants of response and resistance to CD19 chimeric antigen receptor (CAR) T cell therapy of chronic lymphocytic leukemia. Nat. Med. 2018;24:563–571. doi: 10.1038/s41591-018-0010-1. - DOI - PMC - PubMed
    1. Deng Q, et al. Characteristics of anti-CD19 CAR T cell infusion products associated with efficacy and toxicity in patients with large B cell lymphomas. Nat. Med. 2020;26:1878–1887. doi: 10.1038/s41591-020-1061-7. - DOI - PMC - PubMed
    1. Bai Z, et al. Single-cell antigen-specific landscape of CAR T infusion product identifies determinants of CD19-positive relapse in patients with ALL. Sci. Adv. 2022;8:eabj2820. doi: 10.1126/sciadv.abj2820. - DOI - PMC - PubMed
    1. Chen GM, et al. Integrative bulk and single-cell profiling of premanufacture T-cell populations reveals factors mediating long-term persistence of CAR T-cell therapy. Cancer Discov. 2021;11:2186–2199. doi: 10.1158/2159-8290.CD-20-1677. - DOI - PMC - PubMed

Publication types