

Geographic and socioeconomic inequalities in the coverage of contraception in Uttar Pradesh, India
- PMID: 38600560
- PMCID: PMC11007924
- DOI: 10.1186/s12978-024-01784-3
Geographic and socioeconomic inequalities in the coverage of contraception in Uttar Pradesh, India
Abstract
Background: Uttar Pradesh (UP) is the most populous state in India, with a historically lower level of family planning coverage than the national average. In recent decades, family planning coverage in UP has significantly increased, yet there are considerable geographic and socio-economic inequalities.
Methods: The data used for the study is derived from a cross-sectional quantitative survey of 12,200 currently married women conducted during December 2020-February 2021 in UP by the Technical Support Unit. Univariate and bivariate analyses were performed and equiplots were used to make visualizing inequalities easy.
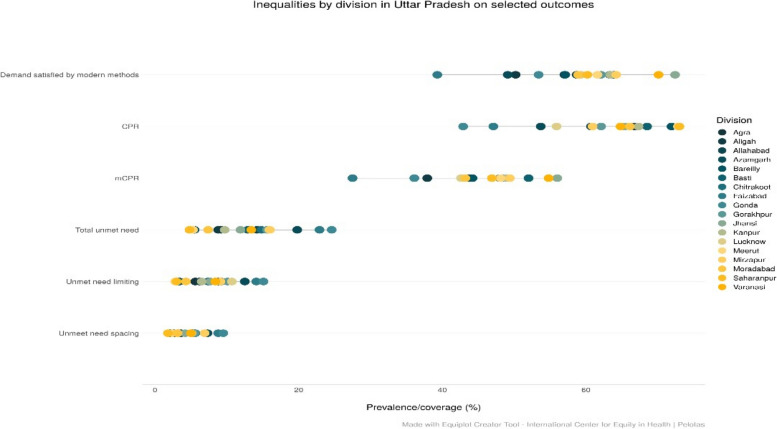
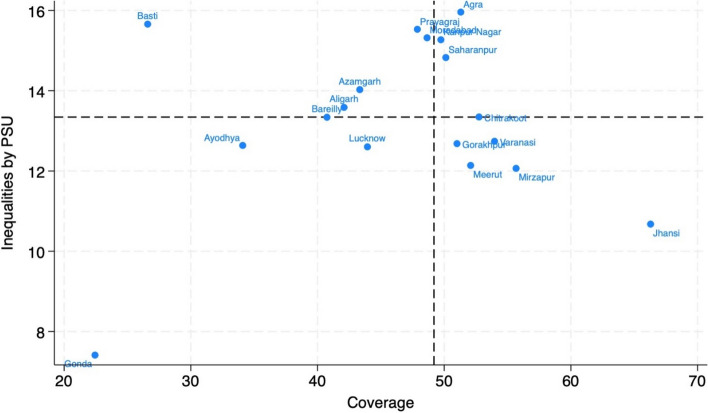
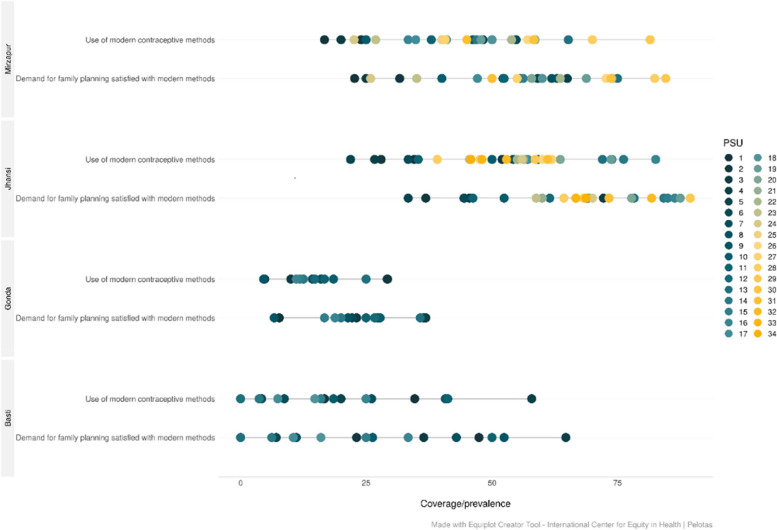
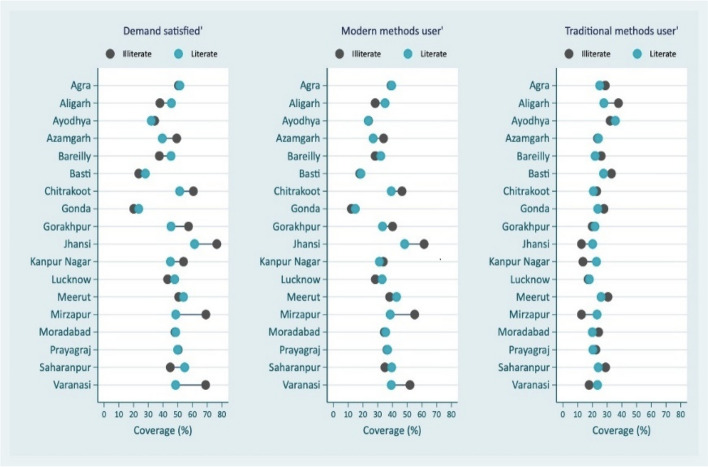
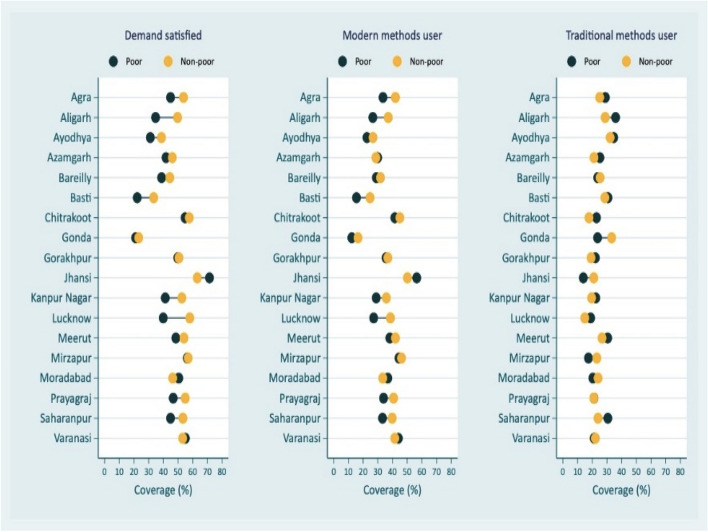
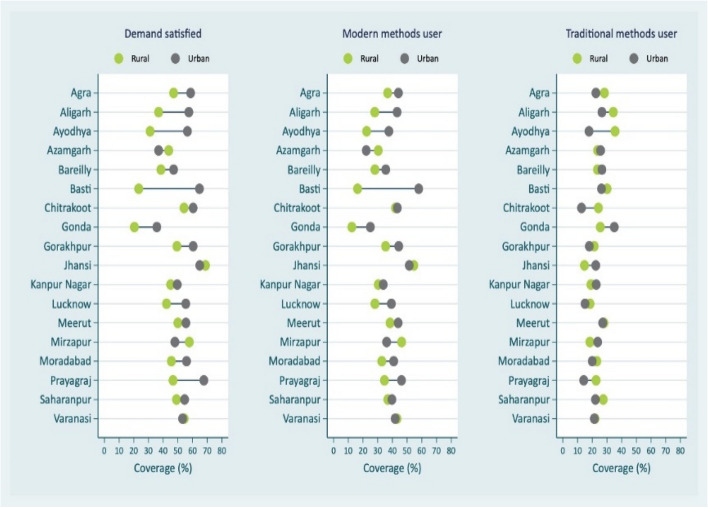
Results: The findings of the study reveal significant variation in family planning coverage indicators amongst currently married women in reproductive ages by administrative divisions in UP. For instance, in the Jhansi division, it was 72.4%, while in Faizabad, it was 39.3%. Jhansi division experienced the highest modern contraceptive coverage with the lowest inequity compared to other divisions. However, the range of coverage within the division by Accredited Social Health Activist (ASHA) areas is 25% to 75%. In fact, for some ASHA areas in the Jhansi division, the family planning demand satisfied for modern contraception ranged from more than 85% to less than 22%. On the other hand, the Gonda division with the lowest coverage and lowest inequity for demand satisfied for modern contraception has some ASHA areas with less than 5% and some with more than 36%. The study also revealed intersectionality of education, wealth, place of residence and geographic divisions in identifying inequity patterns. For instance, in case of Mirzapur and Varanasi, the demand satisfied among the illiterates was 69% and the corresponding percentage for literates was 49%. With respect to place of residence, Basti division, where the coverage for modern contraception is extremely low, demand satisfied for modern contraceptive methods is 16.3% among rural residents compared to 57.9% in the case of urban residents.
Conclusions: The findings showed inequality in the modern family planning methods coverage in UP in both best and worst performing divisions. The inequalities exist even in extremely small geographies such as ASHA areas. Within the geographies as well, the socio-economic inequalities persisted. These inequalities at multiple levels are important to consider for effective resource allocation and utilization.
अमूर्त: पृष्ठभूमि: उत्तर प्रदेश (यूपी) भारत का सबसे अधिक आबादी वाला राज्य है, जहां परिवार नियोजन व्यापकता का स्तर ऐतिहासिक रूप से राष्ट्रीय औसत से कम है। हालाँकि हाल के दशकों में यूपी में परिवार नियोजन व्यापकता में उल्लेखनीय वृद्धि हुई है, फिर भी इसमें काफी भौगोलिक और सामाजिक-आर्थिक असमानताएँ हैं। विधि: अध्ययन के लिए उपयोग किया गया डेटा यूपी तकनीकी सहयोग इकाई द्वारा आयोजित 12,200 वर्तमान में विवाहित महिलाओं के क्रॉस-सेक्शनल मात्रात्मक सर्वेक्षण से लिया गया है, और STATA का उपयोग करके विश्लेषण किया गया है | असमानताओं को दर्शाने के लिए equiplots का उपयोग किया गया है | परिणाम: अध्ययन के निष्कर्षों से यूपी के मंडलों मैं प्रजनन आयु में वर्तमान में विवाहित महिलाओं के बीच परिवार नियोजन व्यापकता संकेतकों में महत्वपूर्ण भिन्नता है। उदाहरण के लिए, झाँसी मंडल में यह 72.4% था जबकि फ़ैज़ाबाद में यह 39.3% था। उदाहरण के लिए झाँसी मण्डल में अन्य मंडलों की तुलना में सबसे कम असमानता के साथ उच्चतम आधुनिक गर्भनिरोधक व्यापकता है | हालाँकि, आशा क्षेत्रों द्वारा प्रभाग के भीतर व्यापकता की सीमा 25% से 75% है। वास्तव में, झाँसी मण्डल के कुछ आशा क्षेत्रों में आधुनिक गर्भनिरोधक के लिए परिवार नियोजन की संतुष्ट मांग 85% से अधिक से लेकर 22% से कम थी। दूसरी ओर, आधुनिक गर्भनिरोधक के लिए संतुष्ट मांग के लिए सबसे कम कवरेज और सबसे कम असमानता वाले गोंडा मण्डल में कुछ आशा क्षेत्र हैं जहां संतुष्ट मांग 5% से कम और 36% से अधिक है। अध्ययन में असमानता पैटर्न की पहचान करने में शिक्षा, संपत्ति, निवास स्थान और भौगोलिक विभाजन की अंतर्संबंधता का भी पता चला। उदाहरण के लिए, मिर्ज़ापुर और वाराणसी के मामले में, निरक्षरों के बीच संतुष्ट मांग 69% है और साक्षरों के लिए यह प्रतिशत 49% है। निवास स्थान के संबंध में, बस्ती मंडल जहां आधुनिक गर्भनिरोधक के लिए कवरेज बेहद कम है, ग्रामीण निवासियों के बीच आधुनिक गर्भनिरोधक तरीकों की संतुष्ट मांग 16.3% है, जबकि शहरी निवासियों के मामले में यह 57.9% है। निष्कर्ष: वर्तमान अध्ययन का मुख्य निष्कर्ष यह है कि उत्तर प्रदेश में सबसे अच्छे और सबसे खराब प्रदर्शन करने वाले मंडलों में भी आधुनिक परिवार नियोजन विधियों के कवरेज में असमानता मौजूद है। आशा क्षेत्रों जैसे अत्यंत छोटे भौगोलिक क्षेत्रों में भी असमानता मौजूद है। भौगोलिक क्षेत्रों में सामाजिक-आर्थिक असमानताएँ भी हैं। प्रभावी संसाधन आवंटन और उपयोग के लिए नीति निर्माताओं के लिए विचार करने के लिए ये महत्वपूर्ण कारक हैं।.
Keywords: Administrative Divisions; Contraception; Coverage; Demand Met; Inequalities; Uttar Pradesh.
© 2024. The Author(s).
Conflict of interest statement
The authors declare no competing interests.
Figures

Similar articles
-
Understanding the rise in traditional contraceptive methods use in Uttar Pradesh, India.Reprod Health. 2023 Jan 6;20(1):8. doi: 10.1186/s12978-022-01547-y. Reprod Health. 2023. PMID: 36609308 Free PMC article.
-
Modern contraceptive use among women in need of family planning in India: an analysis of the inequalities related to the mix of methods used.Reprod Health. 2021 Aug 21;18(1):173. doi: 10.1186/s12978-021-01220-w. Reprod Health. 2021. PMID: 34419083 Free PMC article.
-
Socio-economic inequalities in non-use of modern contraceptives among young and non-young married women in India.BMC Public Health. 2023 May 1;23(1):797. doi: 10.1186/s12889-023-15669-w. BMC Public Health. 2023. PMID: 37127678 Free PMC article.
-
Levels and trends in contraceptive prevalence, unmet need, and demand for family planning for 29 states and union territories in India: a modelling study using the Family Planning Estimation Tool.Lancet Glob Health. 2017 Mar;5(3):e350-e358. doi: 10.1016/S2214-109X(17)30033-5. Lancet Glob Health. 2017. PMID: 28193400
-
Engaging Community Health Workers to Enhance Modern Contraceptive Uptake Among Young First-Time Parents in Five Cities of Uttar Pradesh.Glob Health Sci Pract. 2024 May 21;12(Suppl 2):e2200170. doi: 10.9745/GHSP-D-22-00170. Print 2024 May 21. Glob Health Sci Pract. 2024. PMID: 38575360 Free PMC article. Review.
Cited by
-
Enhancing Leadership and Management Skills in Public Health: Insights from the Public Health Management and Leadership Training Program in Uttar Pradesh, India.J Healthc Leadersh. 2024 Dec 27;16:569-582. doi: 10.2147/JHL.S484478. eCollection 2024. J Healthc Leadersh. 2024. PMID: 39742287 Free PMC article.
References
-
- Ministry of Health and Family Welfare . Report of the Technical Group on Population Projections, 2011–2036. India: New Delhi; 2020.
-
- Government of India, USAID, and Government of Uttar Pradesh. State Innovations in Family Planning Services Project Agency (SIFPSA), Government of Uttar Pradesh, India. 1992. http://www.sifpsa.org/who-we-are.php
-
- Mission National Rural Health . Guidance Note for implementation of RMNCH+A interventions in High Priority Districts. New Delhi: Ministry of Health and Family Welfare; 2013.
-
- International Institute for Population Sciences (IIPS) and ORC Macro. National Family Health Survey (NFHS-2), India 1992-932. Mumbai: IIPS; 1994.
MeSH terms
Substances
LinkOut - more resources
Full Text Sources
Medical
Miscellaneous
