. 2024 Apr 10;15(1):104.
doi: 10.1186/s13287-024-03700-9.

An integrated toolkit for human microglia functional genomics

Affiliations

An integrated toolkit for human microglia functional genomics

Imdadul Haq et al. Stem Cell Res Ther. .

Abstract

Background: Microglia, the brain's resident immune cells, play vital roles in brain development, and disorders like Alzheimer's disease (AD). Human iPSC-derived microglia (iMG) provide a promising model to study these processes. However, existing iMG generation protocols face challenges, such as prolonged differentiation time, lack of detailed characterization, and limited gene function investigation via CRISPR-Cas9.

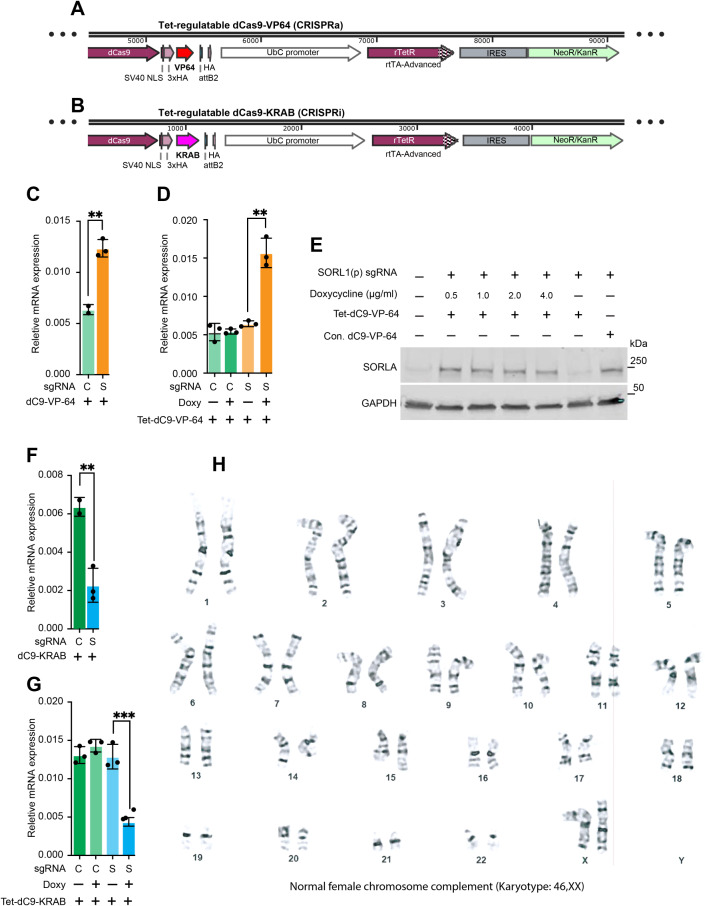
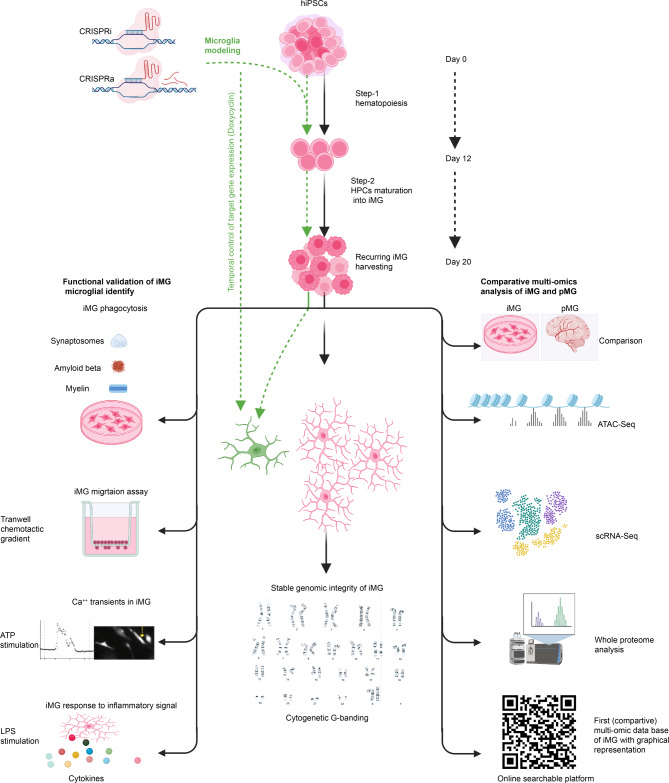
Methods: Our integrated toolkit for in-vitro microglia functional genomics optimizes iPSC differentiation into iMG through a streamlined two-step, 20-day process, producing iMG with a normal karyotype. We confirmed the iMG's authenticity and quality through single-cell RNA sequencing, chromatin accessibility profiles (ATAC-Seq), proteomics and functional tests. The toolkit also incorporates a drug-dependent CRISPR-ON/OFF system for temporally controlled gene expression. Further, we facilitate the use of multi-omic data by providing online searchable platform that compares new iMG profiles to human primary microglia: https://sherlab.shinyapps.io/IPSC-derived-Microglia/ .

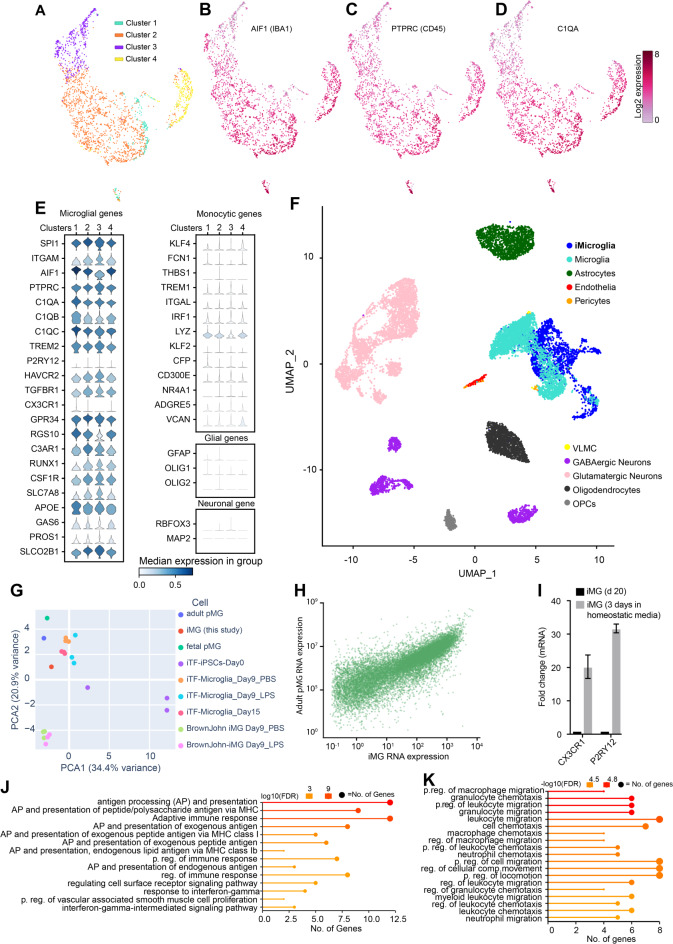
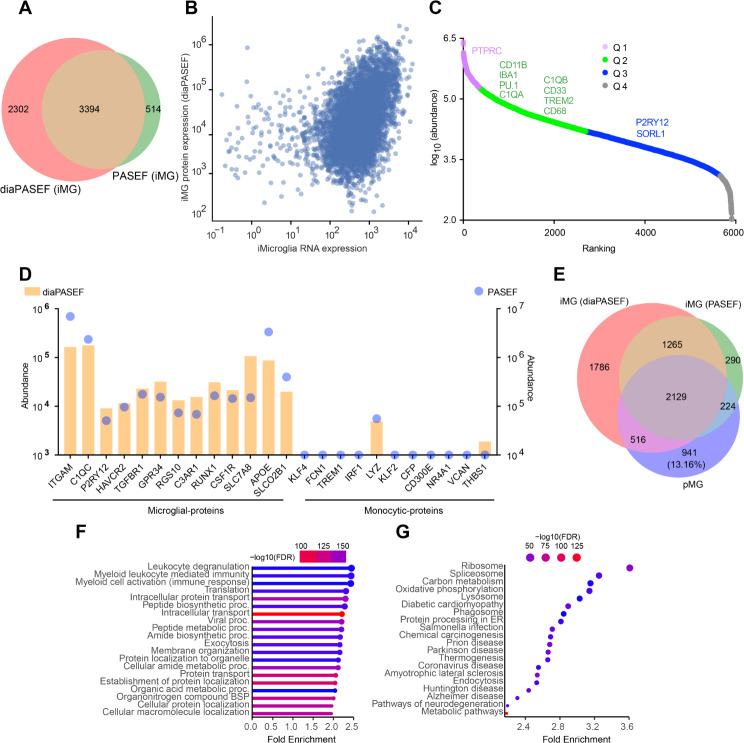
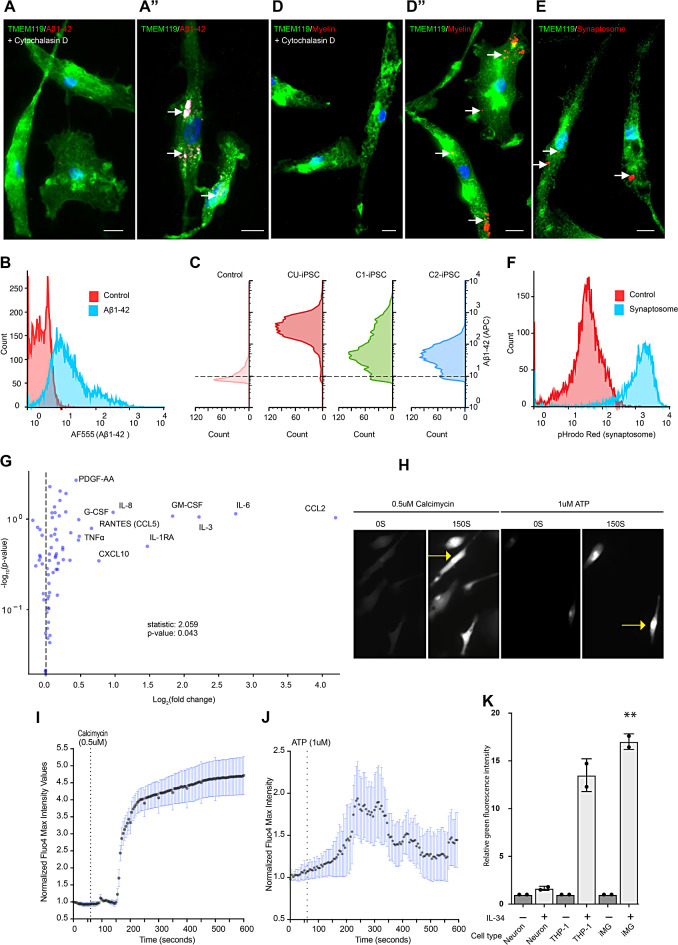
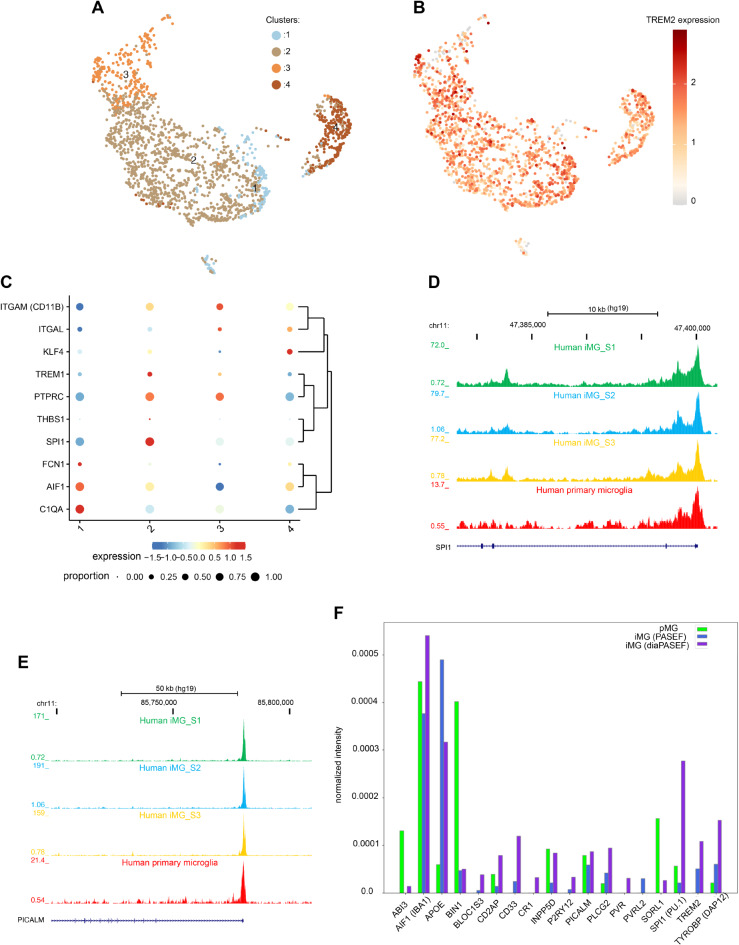
Results: Our method generates iMG that closely align with human primary microglia in terms of transcriptomic, proteomic, and chromatin accessibility profiles. Functionally, these iMG exhibit Ca2 + transients, cytokine driven migration, immune responses to inflammatory signals, and active phagocytosis of CNS related substrates including synaptosomes, amyloid beta and myelin. Significantly, the toolkit facilitates repeated iMG harvesting, essential for large-scale experiments like CRISPR-Cas9 screens. The standalone ATAC-Seq profiles of our iMG closely resemble primary microglia, positioning them as ideal tools to study AD-associated single nucleotide variants (SNV) especially in the genome regulatory regions.

Conclusions: Our advanced two-step protocol rapidly and efficiently produces authentic iMG. With features like the CRISPR-ON/OFF system and a comprehensive multi-omic data platform, our toolkit equips researchers for robust microglial functional genomic studies. By facilitating detailed SNV investigation and offering a sustainable cell harvest mechanism, the toolkit heralds significant progress in neurodegenerative disease drug research and therapeutic advancement.

Keywords: CRISPR; Chromatin accessibility (ATAC-Seq); Functional genomics; Microglia; Neurodegenerative diseases; Proteomics; iPSC-derived microglia (iMG).


Conflict of interest statement

Authors declare no competing interests.

Figures

Fig. 1
Fig. 1
Differentiation of hiPSCs into microglia-like cells (iMG). A. Schematic overview of two-step differentiation of hiPSCs into iMG. In the first step the hiPSCs are differentiated into hematopoietic progenitors (HPCs) using media A (days 0–3), followed by media B (days 3–12) from a commercial kit. At day 12, cells exhibit CD34+, CD43+, and CD45+ expression and are transferred to poly-L-lysine coated plates containing media C+++ supplemented with astrocyte-conditioned media. (HPCs can be cryopreserved at this level). By day 16, PU.1 transcription factor emerges, and non-adherent round IBA1/TMEM119+ iMG appear on day 20. IBA1/TMEM119+ iMG can be sequentially harvested up to six times and upon further 2–5 days of culturing in defined media, they acquire homeostatic properties. The upper panel shows the representative images of differentiating iPSCs, HPCs, floating iMG (black arrow), and iMG cultured in near homeostatic conditions. B. qPCR data shows the expression of microglial signature genes in iMG derived from three different iPSCs lines. Color and style denotes p-values and iPSC line, respectively, with the X-axis displaying the log2 fold change. C-D. Flow cytometry analysis shows the expression of CD11B and CD45 on day 20 iMG. Red histograms represent the isotype control staining, blue histograms show the CD11B and CD45 staining. E. Immunocytochemistry (ICC) of TEMEM119 expression under near homeostatic conditions in iMG derived from indicated iPSC lines. Scale bars represent 10 μm. F. Displays relative percentage of TMEM119 positive and TMEM119 negative cells in iMG cultures differentiated from three independent iPSC lines
Fig. 2
Fig. 2
Mapping open chromatin by ATAC-Seq in iMG and human primary microglia. A. Displays distribution of DNA accessible sites (DAS) across each genomic feature in human iMG and primary microglia (pMG). B. Illustrates the relative distance of DAS from transcriptional start sites human iMG and primary microglia (pMG). C. ATAC-Seq abundance tracks identify accessible chromatin regions (DAS) around the BIN1 gene in iMG (blue tracks) and pMG (pink tracks). D. Principal component analysis (PCA) of ATAC-Seq signal at a microglia specific gene set (see Table S1). Data sets include iMG, pMG and monocytes and HMC3 cells from another study in our laboratory. E-F. De novo (E) and known (F) motif discovery analysis (HOMER) on common DAS in iMG and pMG are presented. G. AD-linked APOE variants concentrate on genomic regulatory regions (DAS) in iMG and pMG. ADVP track shows the AD-associated single nucleotide variants around APOE from ADVP database. DAS detected in the vicinity of APOE gene in iMG are shown as blue dashes. H. Gene ontology (GO) enrichment analysis for 250 genes associated with most significant common peaks between iMG and pMG is depicted. ATAC-Seq was performed on iMG derived from C1-iPSC line. Abbreviations: UTR untranslated region; TSS transcription start site; kb kilobase; HMC3 human microglia cell line 3
Fig. 3
Fig. 3
Single-cell gene expression analysis of iMG. A. K-means clustering of ~ 2000 single-cell transcriptional profiles from iMG at day 20, identifying four transcriptionally distinct clusters. These iMG clusters are presented in a Uniform Manifold Approximation and Projection (UMAP), where each dot represents a cell. The cells are color-coded based on their cluster affiliation. B-D. The expression of microglial genes IBA1, CD45, and C1QA projected on the UMAP representation of the clusters. The colored scale represents the log2 expression. E. Stacked violin plots of ~ 2000 iMG showing cluster-wise the high expression levels of microglial genes (left panel) compared to the low or absent expression of monocytic genes (right upper panel). The expression of glial and neuronal markers (e.g., astrocytes (GFAP), oligodendrocytes (OLIG1 and OLIG2) and neurons (RBFOX3 and MAP2)) was not detected (right lower panels). F. UMAP showing the integration of our iMG-scRNA-Seq data with the post-mortem single-nucleus RNA-Seq data from aging human frontal cortex (Cain, A. et al. 2023). The integration revealed that iMG signature resembles the microglial signature but differs from the signature of other cell types in the brain, including neurons, neuroglia, and vascular cells. G. Principal component analysis of expression of microglial genes in iMG (red) human adult microglia (blue), human fetal microglia (green) and iPSC-derive iMG from other studies, showing strong resemblance of our iMG to primary microglia. H. Scatter plot showing the comparison of iMG mRNA expression with that of primary adult aged microglia (pMG) from a previous study, which were purified from the dorsolateral prefrontal cortex of deceased patients (Olah, M. et al. 2020). Each dot represents a gene. A strong correlation between the transcriptome of iMG and pMG was observed (Kendall’s tau correlation coefficient (Tb) = 0.6826, p-value = 0.0, Pearson’s r = 0.2658 and p-value = 8.771e− 288). I. Bar graph comparing CX3CR1 and P2RY12 expression in iMG differentiated for 20 days and iMG cultured in homeostatic conditions for additional three days (total 23 days). Fold changes were identified by quantitative RT-PCR (n = 3, C1 iPSCs). Error bars represent the standard error of three independent experiments. J-K. Gene enrichment analysis of the top 25 upregulated genes in each cluster. Lollipop charts provide information about Gene Ontology (GO) fold enrichment, significance (FDR log10), and the number of genes in each enriched term in iMG cluster 1 (J) and cluster 2 (K). scRNA-Seq was performed on iMG derived from C1-iPSC line. Abbreviations: Uniform Manifold Approximation and Projection (UMAP); PCA principal component analysis; VLMC vascular leptomeningeal cell; OPC oligodendrocyte precursor cells; FDR false discovery rate
Fig. 4
Fig. 4
Global proteome profiling of iMG. A. Venn-diagram showing the number of proteins detected by diaPASEF and PASEF mass spectrometry (MS) in lysates from iMG (day 21). B. Dot plot showing the correlation between iMG mRNA expression (scRNA-Seq), and proteins expression measured in diaPASEF (Tb= 0.2764, p-value = 5.550e− 201; Pearson’s r = 0.3794 and p-value = 6.1881e− 182). Each dot is a gene/protein pair. C. Scatter plot shows the abundance of proteins expressed in iMG. Global protein abundance was obtained using diaPASEF proteomics. On the graph, proteins are ordered based on their expression levels. Each dot represents a protein. The protein abundances were divided into four quartiles (Q: quartile). Microglial signature proteins were detected in quartile 1 and 2. D. Bar and dot hybrid plot showing the high expression of microglia signature proteins compared to the expression of proteins considered to be monocyte specific. Proteins abundance measured in diaPASEF methods is shown in the left y-axis while the right y-axis shows proteins abundance detected in conventional PASEF method. E. Venn-diagram is showing the comparison of iMG proteome with the proteome of 5000 pMG from a previous study (Olah, M. et al. 2018). Most of the proteins expressed in pMG overlapped with the proteome of iMG. F. GO analysis of most abundant proteins identified in iMG MS. Lollipop chart (ShinyGO) provides information about Biological Processes (BP), fold enrichment significance (FDR in log10) and number of genes (size of the circle) in each BP identified. G. Pathways analysis results of proteins identified in iMG MS. The most significant 20 pathways are shown. Dot plot shows the top 20 enriched pathways, significance (FDR in log10), and the number of genes in each pathway shown. Cellular lysate from C1-iPSC line was used for MS. Abbreviations: PASEF parallel accumulation serial fragmentation; diaPASEF data independent acquisition parallel accumulation serial fragmentation; iMG induced pluripotent stem cell derived microglia; pMG primary microglia; FDR false discovery rate
Fig. 5
Fig. 5
Functional validation of iMG microglial identity. A-F. Phagocytic activity in iMG. A-A”. Microscopic images showing iMG (C1-iPSC) phagocytosing Flour 555-labeled beta-amyloid (A”), which is inhibited by cytochalasin D (A). B. Flow cytometric analysis of Flour 555-labeled beta-amyloid treated iMG derived from C1-iPSC line. Red histogram shows the control sample (untreated), and light blue histogram shows the sample exposed to Flour 555-labeled beta-amyloid. C. Flow cytometry of fluorescent beta-amyloid treated iMG differentiated from three different iPSC lines. Control: cytochalasin D treatment. (D-D”) iMG phagocytosing pHrodo-red labeled myelin with (D) and without cytochalasin D (D”). E-F. iMG engulfing pHrodo-red labeled human synaptosomes, confirmed by microscopy (E) and flow cytometry (F). Red histogram shows the control sample and light blue histogram shows the sample exposed to pHrodo labeled synaptosomes but not cytochalasin D. A-F n = 3. A, A’’, D, D’’, E: CU-iPSC. C: all three iPSC lines. Scale bars: 10 μm in A-A”, D-D” and E. G. iMG response to LPS challenge by releasing cytokines and chemokines. The volcano plot shows the means of three independent experiments of LPS or vehicle-only treatment for 12 h. A two-sided paired t-test for each cytokine/chemokine was applied to assess if LPS treatment had an overall impact on cytokine/chemokine secretion (P < 0.05). H. A23187 and ATP evoke Ca2+ transients in iMG, as depicted by live imaging of Fluo-4 labeled iMG following addition of either compound. Arrows highlight Ca2+driven signal accumulation in iMG over time. I-J. Image-derived fluorescence intensity signal measurements over time post A23187 (I) or ATP (J) treatment. Recordings began 60 s after baseline measurements and continued for 600 s. Supplementary Figure S5D shows the recording up to 1800 s. Error bars in I and J express the standard error of means of three independent experiments. The full registry of Ca2+ dynamics in video format can be found in the supplementary material. K. iMG migrate toward IL-34 cytokine, as demonstrated by fluorometric InnoCyte™ cell migration assay results, represented as relative green, fluorescent intensity (GFI). Neuron: SH-SY5Y neuronal cell line. Error bars represent the standard deviation of three independent experiments (iMG vehicle-only vs. iMG IL-34; Student’s t-test p = 0.0013). Abbreviations: Aß amyloid beta; AF555 AlexaFluor555, a fluorochrome; APC allophycocyanine, a fluorochrome; THP-1 a monocytic cell line; iMG induce pluripotent stem cell derived microglia
Fig. 6
Fig. 6
CRISPR-dCas9 mediated gene activation/repression in iMG. A & B. Schematic for drug-inducible (tetracycline/doxycycline) dCas9-VP64 (activation) and dCas9-KRAB (repressor) expression vectors, respectively. Target sgRNAs were expressed with Tet-dCas9-VP64 or Tet-dCas9-KRAB domains at iPSCs stages, while doxycycline was added at day 16 of differentiation. C. Quantitative analysis of mRNA expression of SORL1 by RT-qPCR, after lentiviral expression of control (C) and SORL1 promoter (S) targeting sgRNAs in iPSCs with stably integrated constitutive dCas9-VP64 (mean ± SD, n = 3, t test P = 0.0032). D. Functional validation of doxycycline-inducible dCas9-VP64 (CRISPRa) via quantitative PCR on SORL1 mRNA levels in iMG expressing SORL1 promoter targeting sgRNA or control sgRNA (mean ± SD, n = 3, ANOVA, P < 0.0001). Doxycycline was added on day 16 of differentiation. E. Immunoblotting demonstrates overexpression of SOLR1 depends on doxycycline treatment after lentiviral deliveries of Tet-dCas9-VP64 and sgRNA targeting SORL1 promoter (SORL1(p)). (Con. dC9-VP-64 stands for: constitutive expression of dCas9-VP64). The blot is representative of three independent experiments. Complete western blot gel is provided in supplementary Figure S7. F. RT-qPCR analysis of mRNA expression of SORL1, after lentiviral expression of control (C) and SORL1 promoter (S) targeting sgRNAs in iPSCs with stably integrated constitutive dCas9-KRAB domain (P < 0.05, (mean ± SD, n = 3, t test P = 0.01). G. Drug-inducible dCas9-KRAB (CRISPRi) represses SORL1 transcription only when doxycycline is added to the cell culture. The bar chart shows the quantitative difference in mRNA levels, measured by RT-qPCR, in iMG expressing SORL1 promoter targeting sgRNA or control sgRNA (mean ± SD, n = 3, ANOVA, P < 0.0001). Doxycycline was added on day 16 of differentiation. H. G-banded chromosome analysis shows a normal karyotype of differentiated iMG
Fig. 7
Fig. 7
A web-accessible platform showcasing graphical visualization of the multi-omic data from iMG model system. A. Depicts how the web portal displays the K-means clustering of ~ 2000 single-cell transcriptional profiles from iMG. B. Displays, as an example the expression of TREM2 gene in all four identified K-means clusters. C. Web-platform offers user-defined visualization of average, log-transformed expression of multiple genes. Depicted are 10 microglial gens, grouped by categorical cell information (i.e. cluster identity). D-E. Show ATAC-Seq data browsing in the UCSC genome browser, demonstrating density plots around AD-linked genes SPI1 (D) and PICALM (E) in iMG (top three tracks) and pMG (bottom track). F. Demonstrates comparative abundance of microglial proteins in iMG and pMG using mass spectrometry data, displayed after normalizing individual protein abundances by the sum of all abundances
Fig. 8
Fig. 8
Integrated toolkit for functional genomics of human microglia. Schematic illustrates the process of iMG generation, manipulation of gene expression, and comprehensive characterization of iMG. The graphics in this Figure were generated using BioRender

References

    1. Ginhoux F, Greter M, Leboeuf M, Nandi S, See P, Gokhan S, Mehler MF, Conway SJ, Ng LG, Stanley ER, et al. Fate mapping analysis reveals that adult microglia derive from primitive macrophages. Science. 2010;330(6005):841–5. doi: 10.1126/science.1194637. - DOI - PMC - PubMed
    1. Gomez Perdiguero E, Klapproth K, Schulz C, Busch K, Azzoni E, Crozet L, Garner H, Trouillet C, de Bruijn MF, Geissmann F, et al. Tissue-resident macrophages originate from yolk-sac-derived erythro-myeloid progenitors. Nature. 2015;518(7540):547–51. doi: 10.1038/nature13989. - DOI - PMC - PubMed
    1. McGrath KE, Koniski AD, Malik J, Palis J. Circulation is established in a stepwise pattern in the mammalian embryo. Blood. 2003;101(5):1669–76. doi: 10.1182/blood-2002-08-2531. - DOI - PubMed
    1. Augusto-Oliveira M, Arrifano GP, Lopes-Araujo A, Santos-Sacramento L, Takeda PY, Anthony DC, Malva JO. Crespo-Lopez ME: What Do Microglia Really Do in Healthy Adult Brain? Cells 2019, 8(10). - PMC - PubMed
    1. Cuyvers E, Sleegers K. Genetic variations underlying Alzheimer’s disease: evidence from genome-wide association studies and beyond. Lancet Neurol. 2016;15(8):857–68. doi: 10.1016/S1474-4422(16)00127-7. - DOI - PubMed

Publication types