. 2024 Apr 10;43(1):108.
doi: 10.1186/s13046-024-03032-9.

Targeting FTO induces colorectal cancer ferroptotic cell death by decreasing SLC7A11/GPX4 expression

Affiliations

Targeting FTO induces colorectal cancer ferroptotic cell death by decreasing SLC7A11/GPX4 expression

Yaya Qiao et al. J Exp Clin Cancer Res. .

Erratum in

Abstract

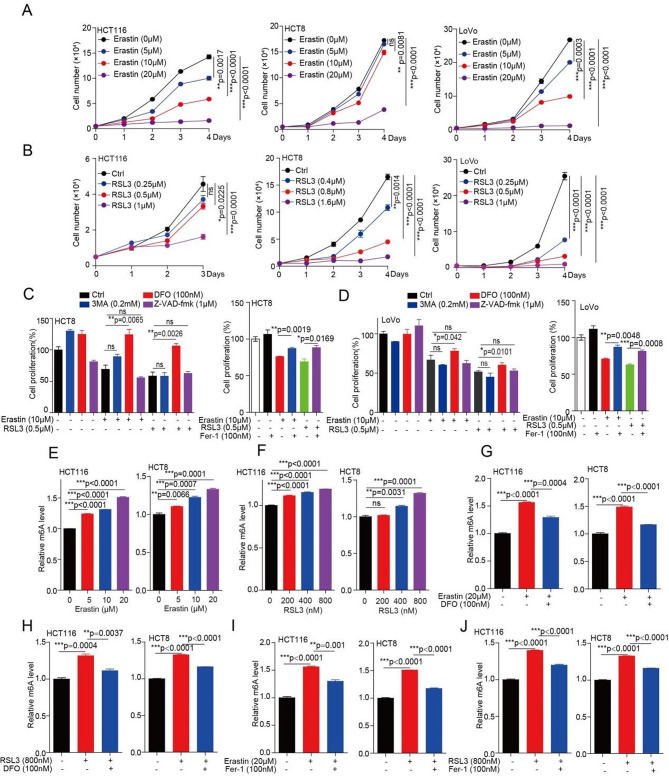
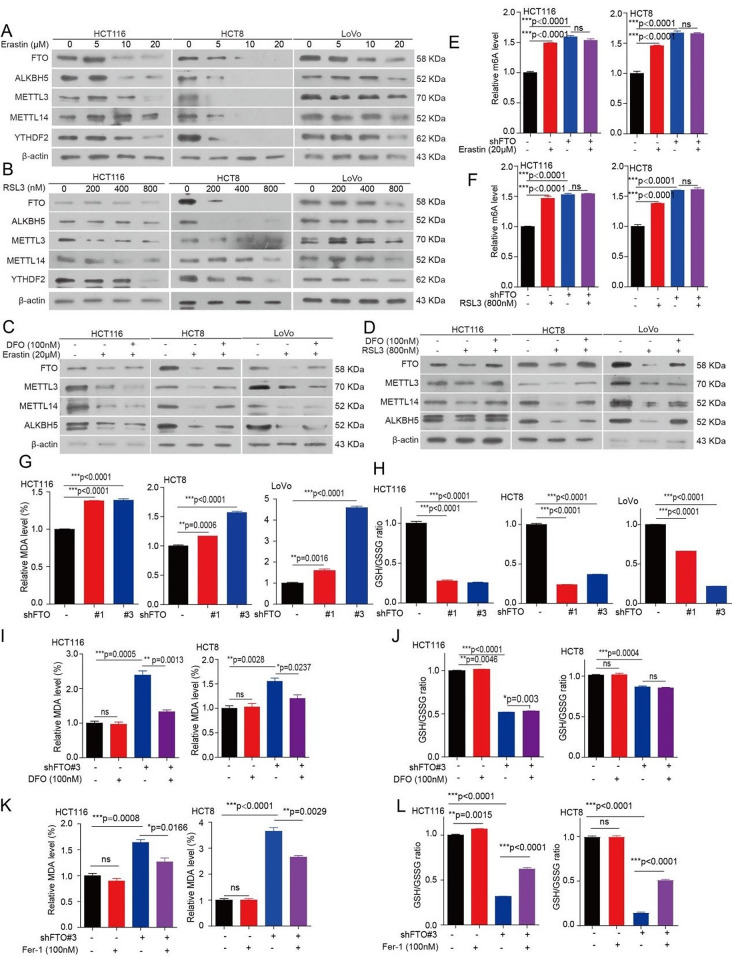
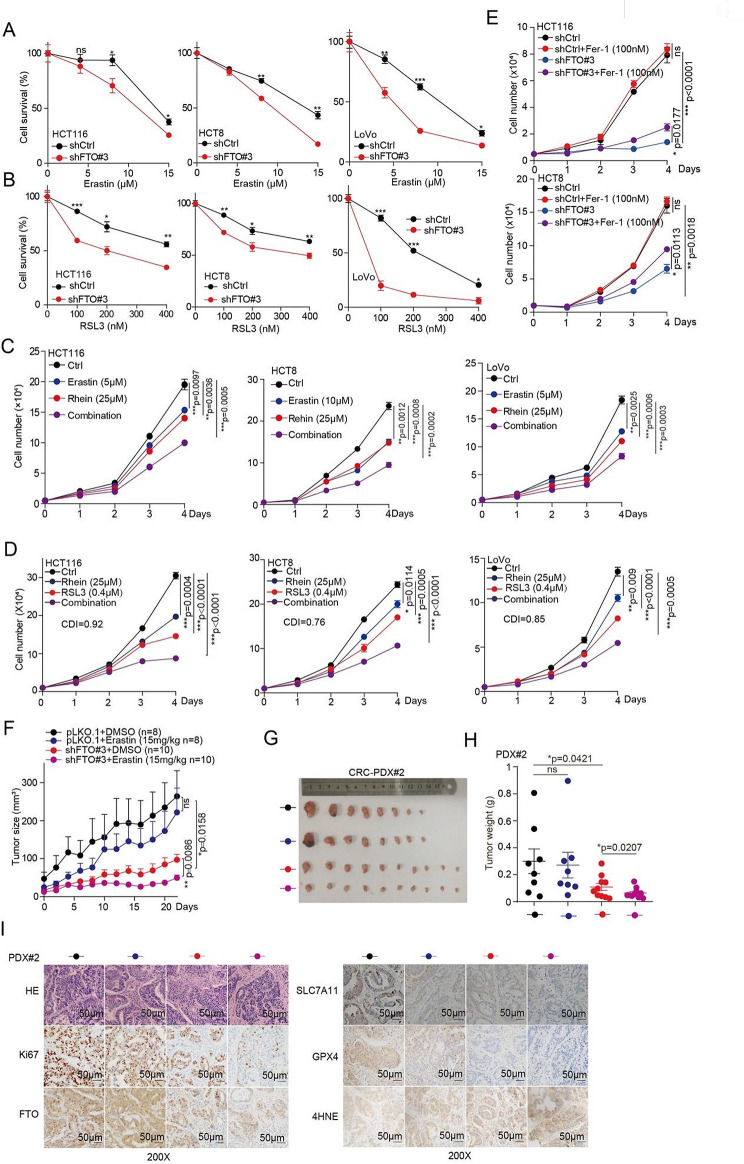
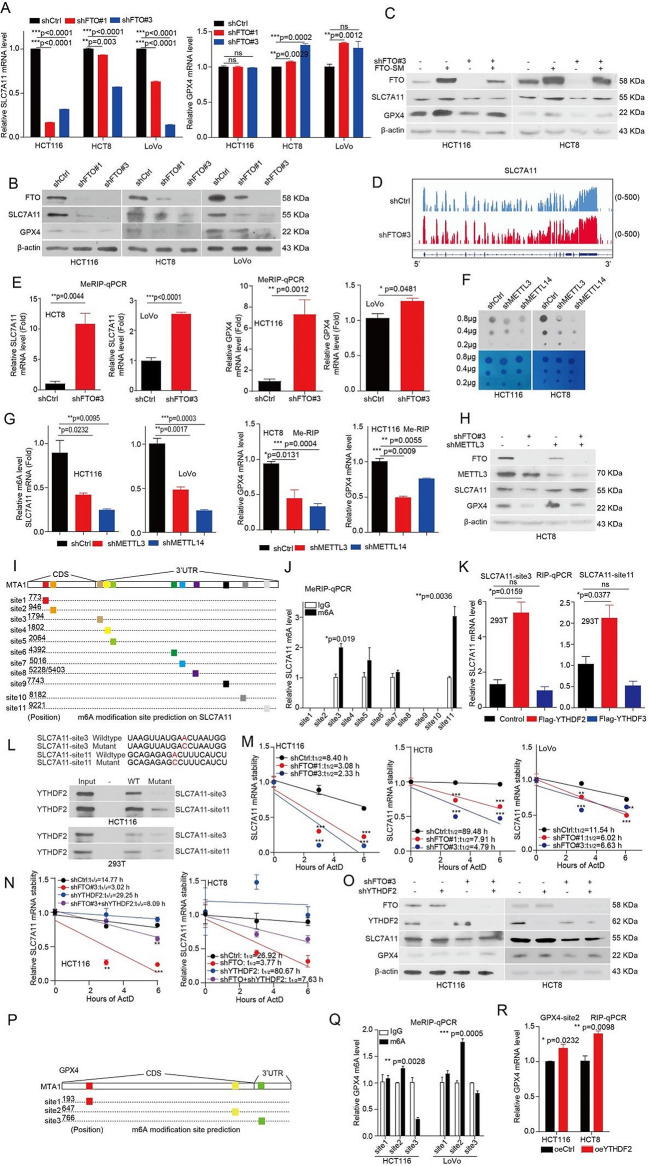
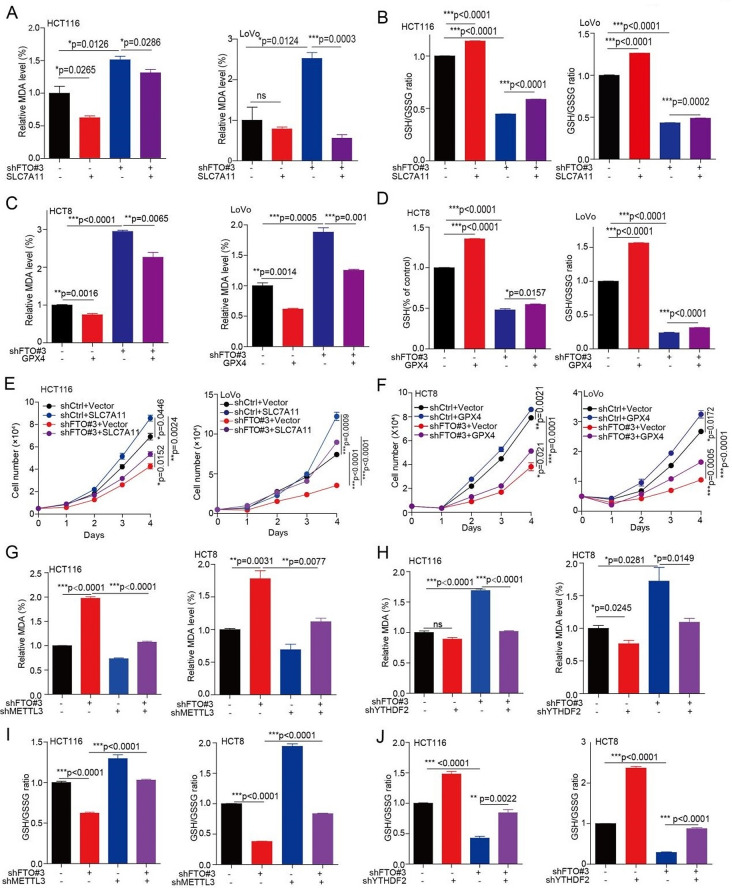
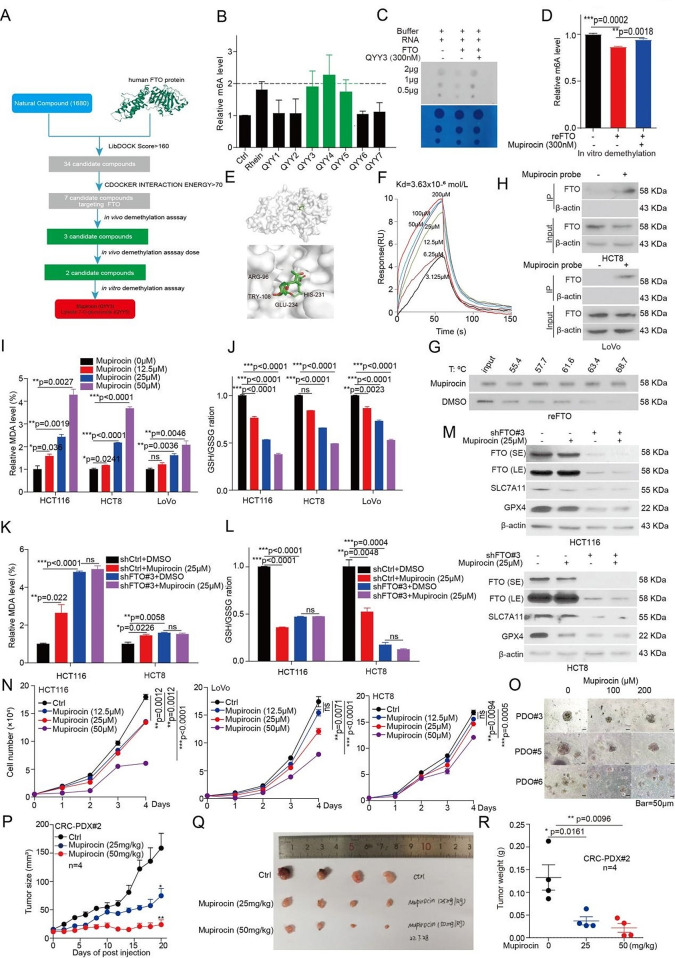
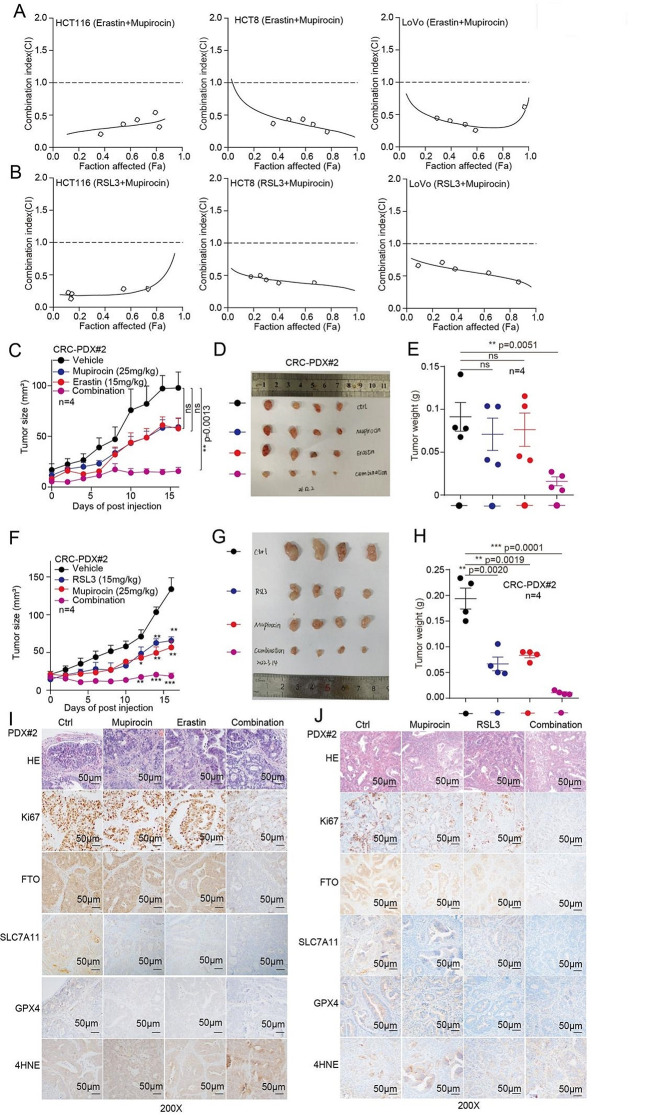
Ferroptosis is a newly identified iron-dependent form of death that is becoming increasingly recognized as a promising avenue for cancer therapy. N6-methyladenosine (m6A) is the most abundant reversible methylation modification in mRNA contributing to tumorigenesis. However, the crucial role of m6A modification in regulating ferroptosis during colorectal cancer (CRC) tumorigenesis remains elusive. Herein, we find that m6A modification is increased during ferroptotic cell death and correlates with the decreased m6A demethylase fat mass and obesity-associated protein (FTO) expression. Functionally, we demonstrate that suppressing FTO significantly induces CRC ferroptotic cell death, as well as enhancing CRC cell sensitivity to ferroptosis inducer (Erastin and RSL3) treatment. Mechanistically, high FTO expression increased solute carrier family 7 member 11 (SLC7A11) or glutathione peroxidase 4 (GPX4) expressions in an m6A-YTHDF2 dependent manner, thereby counteracting ferroptotic cell death stress. In addition, we identify Mupirocin as a novel inhibitor of FTO, and Mupirocin induces CRC ferroptosis and inhibits tumor growth. Clinically, the levels of FTO, SLC7A11, and GPX4, are highly correlated expression in CRC tissues. Our findings reveal that FTO protects CRC from ferroptotic cell death in promoting CRC tumorigenesis through triggering SLC7A11/GPX4 expression.

Keywords: Colorectal cancer (CRC); Fat mass and obesity-associated protein (FTO); Ferroptosis; Glutathione peroxidase 4 (GPX4); N6-methyladenosine (m6A); Solute carrier family 7 member 11 (SLC7A11).


Conflict of interest statement

The authors declare no potential conflicts of interest.

Figures

Fig. 1
Fig. 1
m6A modification is increased during ferroptosis cell death in CRC. (A-B) CRC cells treated with 5 µM, 10 µM, and 20 µM of Erastin (or indicate concentration of RSL3), and then harvested cells for counting cell number at indicated day 1, day 2, day 3, and day 4 to determine the cell proliferation. (C-D) CRC cells pr-treated with Erastin (or RSL3) for 4 h, subsequently treated with or without of DFO (DFO; 100 nM), 3MA (3MA; 0.2 mM), Z-VAD-FMK (Z-VAD; 1 µM), or ferrostatin1 (Fer-1; 100 nM) for another 72 h, and then harvested cells for counting cell number to determine the cell proliferation. (E-F) CRC cells treated with 5 µM, 10 µM, and 20 µM of Erastin (or 200 nM, 400 nM, and 800 nM of RSL3) for 72 h, and then the total RNA were harvested for ELISA to determine the m6A levels. (G-H) CRC cells treated with 20 µM of Erastin (or 800 nM of RSL3) for 4 h, subsequently treated with or without DFO (100 nM) for another 72 h, and then the total RNA were harvested for ELISA to determine the m6A levels. (I-J) CRC cells treated with 20 µM of Erastin (or 800 nM of RSL3) (4 h) in the absence or presence of Fer-1 (100 nM) for 72 h, and then the total RNA were harvested for ELISA to determine the m6A levels. (All error bars, mean values ± SEM (standard error of mean), p values were determined by unpaired two-tailed Student’s t test of n = 3 independent biological experiments. *p < 0.05; **p < 0.01; ***p < 0.001)
Fig. 2
Fig. 2
FTO mediates m6A modification upregulation during ferroptosis and regulates ferroptosis. (A-B) CRC cells treated with 5 µM, 10 µM, and 20 µM of Erastin (or 200 nM, 400 nM, and 800 nM of RSL3) for 72 h. The lysates were collected for western blotting to examine the expression of FTO, ALKBH5, METTL3, METTL14, and YTHDF2. (C-D) CRC cells pr-treated with 20 µM of Erastin (or 800 nM of RSL3) for 4 h, subsequently treated with or without of DFO (DFO; 100 nM) for 72 h. The lysates were collected for western blotting to examine the expression of FTO, ALKBH5, METTL3, and METTL14. (E-F) FTO knockdown or vector control CRC cells treated with 20 µM of Erastin (or 800 nM of RSL3) for 72 h, and then the total RNA were harvested for ELISA to determine the m6A levels. (G-H) The malondialdehyde (MDA) concentration or GSH/GSSG ratio were detected using assay kits in FTO knockdown or vector control CRC cells. (I-J) The MDA concentration or GSH/GSSG ratio were detected using assay kits in FTO knockdown or vector control CRC cells treated with or without 100 nM DFO for 72 h. (K-L) The MDA concentration or GSH/GSSG ratio were detected using assay kits in FTO knockdown or vector control CRC cells treated with or without 100 nM Fer-1 for 72 h. (All error bars, mean values ± SEM, p values were determined by unpaired two-tailed Student’s t test of n = 3 independent biological experiments. *p < 0.05; **p < 0.01; ***p < 0.001)
Fig. 3
Fig. 3
Targeting FTO enhances the anti-tumor effects of Erastin and RSL3. (A-B) Cell survival was determined in CRC cells with stable FTO knockdown when treated with 0 µM, 5 µM, 10 µM and 15 µM of Erastin (or 0 nM, 100 nM, 200 nM, 300 nM, and 400 nM of RSL3), and then harvested cells for counting cell number at indicated day 3. (C-D) CRC cells treated with 25 µM Rehin, 5 µM of Erastin (or 400 nM of RSL3), alone or in combination, and then and then harvested cells for counting cell number at indicated day 1, day 2, day 3, and day 4 to determine the cell proliferation. (E) Cell proliferation was determined in CRC cells with stable FTO knockdown when treated with or without 100 nM of Fer-1, and then harvested cells for counting cell number at indicated day 3. (F) Tumor growth was compared between xenograft nude mice bearing with CRC PDX injected with FTO shRNA virus and control shRNA virus IP injection with or without Erastin (15 mg/kg per two days). Tumor volume was calculated for each group at the indicated times. (G) All tumors from nude mouse are shown. (H) Tumor mass in xenograft nude mice bearing with CRC PDX injected with FTO shRNA virus and control shRNA virus IP injection with or without Erastin (15 mg/kg per two days). (I) HE, Ki67, FTO, SLC7A11, GPX4, and 4HNE were analyzed in a representative PDX xenograft tumor by IHC (scale bar = 50 μm). (All error bars, mean values ± SEM, p values were determined by unpaired two-tailed Student’s t test of n = 3 independent biological experiments. *p < 0.05; **p < 0.01; ***p < 0.001)
Fig. 4
Fig. 4
FTO enhances the expression of SLC7A11 and GPX4 in CRC cells. (A)The total RNA were extracted from FTO knockdown or vector control CRC cells, and then mRNA was reversely transcribed into cDNA. The expression of SLC7A11 and GPX4 mRNA were examined by qRT-PCR. (B) The lysates were collected from FTO knockdown or vector control CRC cells for western blotting to examine the expression of FTO, SLC7A11, and GPX4. (C) FTO knockdown HCT116 and HCT8 cells with or without exogenous expression of FTO. The lysates were collected for western blotting to examine the expression of FTO, SLC7A11, and GPX4. (D) The relative abundance of m6A sites along SLC7A11 mRNA in FTO knockdown cells and control cells, as detected by m6A-seq. (E) The m6A modification levels on SLC7A11/GPX4 were examined by the MeRIP-qPCR in FTO knockdown cells and control CRC cells. (F) The total RNA were harvested from METTL3 or METTL14 knockdown and control cells, then the total RNA for dot blotting assay to determine the m6A levels. (G) The m6A modification levels on SLC7A11/GPX4 were examined by the MeRIP-qPCR in METTL3 or METTL14 knockdown cells and control cells (H) The lysates were collected from FTO knockdown or vector control CRC cells with or without knockdown METTL3 for western blotting to examine the expression of FTO, METTL3, SLC7A11, and GPX4. (I) Schematic diagram of SLC7A11 mRNA and the predicted ‘m6A’ sites at CDS and 3’UTR are highlighted. (J) Measurement of the m6A modification on eleven m6A-site clusters of SLC7A11 by the MeRIP-qPCR. (K) RIP-qPCR analysis to screen the reader protein by binding SLC7A11 mRNA. (L) Immunoblotting of YTHDF2 in HCT116 and 293T cells was pull downed by biotinylated-SLC7A11 (site 3 and site11) and the biotinylated-SLC7A11 (site 3 and site11) without m6A motif mutation. (M) FTO knockdown or vector control CRC cells were treated with 5 µg/mL actinomycin D (Actd) as indicated and were subjected to qRT-PCR analysis for the mRNA stability of SLC7A11. (N) FTO knockdown or vector control CRC cells with or without knockdown YTHDF2, and then treated with 5 µg/mL actinomycin D (Actd) as indicated and were subjected to qRT-PCR analysis for the mRNA stability of SLC7A11. (O) CRC cells with or without knockdown YTHDF2. The lysates were collected for western blotting to examine the expression of FTO, YTHDF2, and SLC7A11. (P) Schematic diagram of SLC7A11 mRNA and the predicted ‘m6A’ sites at CDS and 3’UTR are highlighted. (Q)Measurement of the m6A modification on three m6A-site clusters of GPX4 by the MeRIP-qPCR. (R) RIP-qPCR analysis to screen the reader protein by binding SLC7A11 mRNA. (All error bars, mean values ± SEM, p values were determined by unpaired two-tailed Student’s t test of n = 3 independent biological experiments. *p < 0.05; **p < 0.01; ***p < 0.001)
Fig. 5
Fig. 5
FTO regulates ferroptosis and cell proliferation via SLC7A11/GPX4. (A-B) The MDA concentration or GSH/GSSG ratio were detected using assay kits in FTO knockdown or vector control CRC cells with or without exogenous expression of SLC7A11. (C-D) The MDA concentration or GSH/GSSG ratio were detected using assay kits in FTO knockdown or vector control CRC cells treated with or without exogenous expression of GPX4. (E-F) The cell proliferation was determined in FTO knockdown or vector control CRC cells with or without exogenous expression of SLC7A11 (or GPX4), and then harvested cells for counting cell number at indicated day 1, day 2, day 3, and day 4 to determine the cell proliferation. (G-H) The MDA concentration were detected using MDA assay kits in FTO knockdown or vector control CRC cells with or without knockdown METTL3 (or YTHDF2). (I-J) The GSH/GSSG ratio was detected using GSH/GSSG assay kits in FTO knockdown or vector control CRC cells with or without knockdown METTL3 (or YTHDF2). (All error bars, mean values ± SEM, p values were determined by unpaired two-tailed Student’s t test of n = 3 independent biological experiments. *p < 0.05; **p < 0.01; ***p < 0.001)
Fig. 6
Fig. 6
Identification of Mupirocin as a novel inhibitor of FTO and regulates CRC ferroptosis and tumor growth. (A) The flowchart of the pipeline to identify FTO inhibitors based on virtual screening. (B) HCT116 cells were treated seven compounds, and then the total RNA were harvested for dot blotting assay to determine the m6A levels. The optical density of blotting bands was quantified by Image J software and normalized to control. (C) The total RNA were harvested from HCT116 cells, and then incubated with FTO protein from HCT116 cells by flag pull-down in kinase buffer with or without Mupirocin. The enzymatic activity of FTO was anlysis by dot blotting assay. (D) The total RNA were harvested from HCT116 cells, and then incubated with recombinant FTO protein in kinase buffer with or without Mupirocin. The enzymatic activity of FTO was anlysis by ELISA. (E) The binding model of Mupirocin in FTO catalytic pocket. (F) The affinity of Mupirocin (0, 3.125, 6.25, 12.5, 25 µM, 50 µM, 100µM,  and 200 µM) for FTO was determined using SPR. (G) Thermal shift analysis for the affinity of Mupirocin for FTO, and then anlyzed by western blotting. (H) The in situ pull-down assay in CRC cells was performed to identifying the interaction between Mupirocin probe and FTO proteins. (I-J) The MDA concentration or GSH/GSSG ratio were detected using assay kits in CRC cells treated with the indicated doses of Mupirocin for 72 h. (K-L) The MDA concentration or GSH/GSSG ratio were detected using assay kits in FTO knockdown CRC cells treated with the indicated doses of Mupirocin for 72 h. (M) The expression of FTO, SLC7A11, and GPX4 were examined by western blotting in FTO knockdown CRC cells treated with the indicated doses of Mupirocin for 72 h. (N) CRC cells treated with 12.5 µM, 25 µM, and 50 µM of Mupirocin, and then harvested cells for counting cell number at indicated day 1, day 2, day 3, and day 4 to determine the cell proliferation. (O) CRC organoids treated with 100 µM and 200 µM of Mupirocin for 7 days, and then the pictures were taken for examining the effect of Mupirocin on growth of CRC organoids. Representative images of organoids treated with the indicated doses of Mupirocin (scale bar = 50 μm). (P) Tumor growth was compared between xenograft nude mice bearing with CRC PDX, whch IP injection with 25 mg/kg and 50 mg/kg Mupirocin (n = 4). Tumor volume was calculated for each group at the indicated times. (Q) All tumors from nude mouse were shown. (R) Tumor mass of xenograft nude micewith PDX tumor treated with Mupirocin. (All error bars, mean values ± SEM, p values were determined by unpaired two-tailed Student’s t test of n = 3 independent biological experiments. *p < 0.05; **p < 0.01; ***p < 0.001).
Fig. 7
Fig. 7
Mupirocin enhances the anti-tumor effects of Erastin and RSL3. (A-B) The coefficient of combination index (CI) value were calculating by cell number counting assay in CRC cells. (C) Tumor growth was compared between xenograft nude mice bearing with CRC PDX, which IP injection with Mupirocin alone, Erastin alone, and combination (n = 4). Tumor volume was calculated for each group at the indicated times. (D) All tumors from nude mouse were shown. (E) Tumor mass of xenograft nude mice injected with PDX tumor treated with treated with Mupirocin alone, Erastin alone, and combination (n = 4). (F) Tumor growth was compared between xenograft nude mice injected with PDX tumor treated with treated with Mupirocin alone, RSL3 alone, and combination (n = 4). (G) All tumors from nude mouse were shown. (H) Tumor mass of xenograft nude mice injected with PDX tumor treated with treated with Mupirocin alone, RSL3 alone, and combination (n = 4). (I-J) HE, Ki67, FTO, SLC7A11, GPX4, and 4HNE were analyzed by IHC in a representative PDX xenograft tumor treated with Mupirocin in the absence or presence of Erastin (or RSL3)(scale bar = 50 μm). (All error bars, mean values ± SEM, p values were determined by unpaired two-tailed Student’s t test of n = 3 independent biological experiments. *p < 0.05; **p < 0.01; ***p < 0.001)

References

    1. Miller KD, Nogueira L, Devasia T, Mariotto AB, Yabroff KR, Jemal A, et al. Cancer treatment and survivorship statistics, 2022. CA Cancer J Clin. 2022;72:409–436. - PubMed
    1. Woolston A, Khan K, Spain G, Barber LJ, Griffiths B, Gonzalez-Exposito R, et al. Genomic and Transcriptomic Determinants of Therapy Resistance and Immune Landscape Evolution during Anti-EGFR Treatment in Colorectal Cancer. Cancer Cell. 2019;36:35–50 e39. - PMC - PubMed
    1. Van der Jeught K, Xu HC, Li YJ, Lu XB, Ji G. Drug resistance and new therapies in colorectal cancer. World J Gastroenterol. 2018;24:3834–3848. - PMC - PubMed
    1. Jiang X, Stockwell BR, Conrad M. Ferroptosis: mechanisms, biology and role in disease. Nat Rev Mol Cell Biol. 2021;22:266–282. - PMC - PubMed
    1. Liang D, Minikes AM, Jiang X. Ferroptosis at the intersection of lipid metabolism and cellular signaling. Mol Cell. 2022;82:2215–2227. - PMC - PubMed

MeSH terms

Substances