. 2024 Mar 27:18:1361242.
doi: 10.3389/fncel.2024.1361242. eCollection 2024.

Repetitive pulsed-wave ultrasound stimulation suppresses neural activity by modulating ambient GABA levels via effects on astrocytes

Affiliations

Repetitive pulsed-wave ultrasound stimulation suppresses neural activity by modulating ambient GABA levels via effects on astrocytes

Tatsuya Mishima et al. Front Cell Neurosci. .

Abstract

Ultrasound is highly biopermeable and can non-invasively penetrate deep into the brain. Stimulation with patterned low-intensity ultrasound can induce sustained inhibition of neural activity in humans and animals, with potential implications for research and therapeutics. Although mechanosensitive channels are involved, the cellular and molecular mechanisms underlying neuromodulation by ultrasound remain unknown. To investigate the mechanism of action of ultrasound stimulation, we studied the effects of two types of patterned ultrasound on synaptic transmission and neural network activity using whole-cell recordings in primary cultured hippocampal cells. Single-shot pulsed-wave (PW) or continuous-wave (CW) ultrasound had no effect on neural activity. By contrast, although repetitive CW stimulation also had no effect, repetitive PW stimulation persistently reduced spontaneous recurrent burst firing. This inhibitory effect was dependent on extrasynaptic-but not synaptic-GABAA receptors, and the effect was abolished under astrocyte-free conditions. Pharmacological activation of astrocytic TRPA1 channels mimicked the effects of ultrasound by increasing the tonic GABAA current induced by ambient GABA. Pharmacological blockade of TRPA1 channels abolished the inhibitory effect of ultrasound. These findings suggest that the repetitive PW low-intensity ultrasound used in our study does not have a direct effect on neural function but instead exerts its sustained neuromodulatory effect through modulation of ambient GABA levels via channels with characteristics of TRPA1, which is expressed in astrocytes.

Keywords: TRPA1; ambient GABA; astrocyte; network activity; ultrasound neuromodulation.


Conflict of interest statement

The authors declare that the research was conducted in the absence of any commercial or financial relationships that could be construed as a potential conflict of interest. The author(s) declared that they were an editorial board member of Frontiers, at the time of submission. This had no impact on the peer review process and the final decision.

Figures

Figure 1
Figure 1
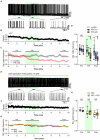
Single-shot pulsed-wave stimulation has no effect on neural activity. (A) Schematic showing whole-cell recording and stimulation of cells with the ultrasound transducer. (B) The color map shows the two-dimensional sound pressure distribution at 3 mm from the transducer. (C) Schematic of the pulse-wave (PW) stimulation. (D) Representative trace of network activity and event frequency before (pre), during (PW), and after (post) single-shot PW stimulation (green shading). (E) Comparison of the average spike frequency calculated from the 2-s pre, PW, and post intervals indicated by the bars in (D) (n = 8 independent experiments, two-tailed Friedman test, p = 0.4169). (F) Comparison of the mean membrane potentials calculated from the 2-s pre, PW, and post-intervals shown in (D) (n = 13 independent experiments, two-tailed Friedman test, p = 0.06271). (G) Representative mEPSC traces and event frequency before, during, and after single-shot PW stimulation. (H) Comparison of the average event frequency calculated from the 2-s pre, PW, and post intervals indicated by the bars in (G) (n = 7 independent experiments, two-tailed Friedman test, p = 0.8669). (I) Comparison of average event amplitude calculated from the 2-s pre, PW, and post intervals shown in (G) (n = 13 independent experiments, two-tailed Friedman test, p = 0.5004). (J) Representative mIPSC traces and event frequency before, during, and after single-shot PW stimulation. (K) Comparison of average event frequency calculated from the 2-s pre, PW, and post intervals indicated by the bars in (J) (n = 9 independent experiments, two-tailed Friedman test, p = 0.2359). (L) Comparison of the average event amplitude calculated from the 2-s pre, PW, and post intervals indicated by the bars in (J) (n = 9 independent experiments, two-tailed Friedman test, p = 0.7165). Light green shading indicates the stimulus period. NS, not significant.
Figure 2
Figure 2
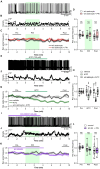
Repetitive PW stimulation inhibits neural activity. (A) Representative trace of network activity before, during, and after repetitive PW stimulation (upper). Magnified traces of the indicated regions (bottom). (B) Spike frequency of the action potentials shown in (A). (C) Average spike frequency in the pre, PW, and post intervals. (D) Comparison of the average spike frequency calculated for the 2-min pre and post intervals and for the 3-min PW stimulation period, as indicated by the bars in (C) (control n = 25 independent experiments; x10 PW n = 9 independent experiments; x20 PW n = 19 independent experiments, two-tailed Steel test). (E) Representative trace of network activity before, during, and after repetitive PW stimulation in the presence of bicuculline (BIC) (upper). Magnified traces of the indicated regions (bottom). (F) Spike frequency from (E). (G) Average spike frequency before, during and after repetitive PW stimulation in the presence of bicuculline. (H) Comparison of the average spike frequency calculated for the 2-min pre and post intervals and the 3 min PW interval, as indicated by the bars in (G) (control n = 5, bicuculline n = 8 independent experiments, two-tailed Mann–Whitney U test). Light green shading indicates the stimulus period. The mean trace is indicated by a solid line, with the SEM shaded. *p < 0.05, ***p < 0.001. NS, not significant.
Figure 3
Figure 3
Repetitive PW stimulation affects tonic but not phasic inhibition. (A) Representative mIPSC traces before, during and after repetitive PW stimulation. (B) Comparison of average event frequency calculated from the 20-s pre and post intervals indicated by the bars in (A) (n = 9 independent experiments, two-tailed Wilcoxon signed-rank test, p = 0.3008). (C) Comparison of the average event amplitude calculated from the 20-s pre and post intervals indicated by the bars in (A) (n = 9 independent experiments, two-tailed Wilcoxon signed-rank test, p = 0.09766). (D) Representative trace of network activity before, during, and after repetitive PW stimulation in the presence of gabazine (GBZ) (upper). Magnified view of the indicated regions (bottom). (E) Spike frequency of the trace in (D). (F) Average spike frequency in the pre, PW, and post intervals in the presence of gabazine. (G) Comparison of the average spike frequency calculated from the 2-min pre and post intervals and the 3-min PW period, as indicated by the bars in (F) (control n = 9, gabazine n = 10 independent experiments, two-tailed Mann–Whitney U test). Light green shading indicates the stimulus period. The mean trace is indicated by a solid line, with the SEM shaded. **p < 0.01. NS, not significant.
Figure 4
Figure 4
Astrocytes are involved in the neuromodulation by repetitive PW ultrasound. (A) Representative trace of network activity before, during, and after repetitive PW stimulation in cultures grown without astrocytes. (B) Spike frequency of the trace shown in (A). (C) Average spike frequency for the pre, PW, and post intervals. (D) Comparison of the average spike frequency calculated from the 2-min pre and post intervals and the 3-min PW period, as indicated by the bars in (C) (w/o astrocytes n = 17, w/o astrocytes + PW n = 15 independent experiments, two-tailed Mann–Whitney U test). (E) Representative trace of network activity before, during, and after application of AITC. (F) Spike frequency of the trace shown in (E). (G) Average spike frequency before, during, and after application of AITC. (H) Comparison of the average spike frequency calculated from the 2-min pre and post intervals and the 5-min AITC application period, as indicated by the bars in (G) (vehicle n = 15, AITC n = 12, w/o astrocytes + AITC n = 19 independent experiments, two-tailed Steel test). (I) Representative trace of network activity before, during, and after application of HC-030031. (J) Spike frequency of the trace shown in (I). (K) Average spike frequency before, during, and after application of HC-030031. (L) Comparison of the average spike frequency calculated from the 2-min pre and post intervals and the 3-min PW period, as indicated by the bars in (K) (control n = 25, HC-030031 n = 11 independent experiments, two-tailed Mann–Whitney U Test). Light green shading indicates the stimulus period. The mean trace is indicated by a solid line, with the SEM shaded. **p < 0.01, ***p < 0.001. NS, not significant.
Figure 5
Figure 5
Activation of TRPA1 channels increases ambient GABA levels. (A) Representative traces showing the tonic GABAA currents recorded with or without repetitive PW. Bicuculline was applied immediately after the end of the 3-min repetitive PW. The corresponding all-point histograms are shown on the right. (B) Representative traces showing the tonic GABAA currents recorded in the presence or absence of AITC. Bicuculline was applied immediately after 5 min of AITC administration. (C) Representative traces of the tonic GABAA currents recorded with repetitive PW plus HC-030031. Bicuculline was applied immediately after the end of the 3-min repetitive PW. (D) Comparison of the tonic GABAA current amplitude for each condition shown in (A–C) (control n = 16 independent experiments; control + PW n = 10 independent experiments, ***p = 0.00067; AITC n = 12 independent experiments, **p = 0.00147; HC-030031 + PW n = 12 independent experiments, p = 0.1476, two-tailed Steel test). (E) Proposed model for neuromodulation by repetitive PW stimulation. Ultrasound causes an influx of Ca2+ and Na+ into astrocytes via channels with characteristics of TRPA1, which leads to (1) decreased uptake of GABA and (2) release of GABA from astrocytes. As a result, ambient GABA levels are elevated, leading to the suppression of neural activity by tonic inhibitory currents. **p < 0.01, ***p < 0.001.

Similar articles

Cited by

References

    1. Barral J., D’Reyes A. (2016). Synaptic scaling rule preserves excitatory-inhibitory balance and salient neuronal network dynamics. Nat. Neurosci. 19, 1690–1696. doi: 10.1038/nn.4415, PMID: - DOI - PubMed
    1. Blackmore D. G., Razansky D., Götz J. (2023). Ultrasound as a versatile tool for short-and long-term improvement and monitoring of brain function. Neuron 111, 1174–1190. doi: 10.1016/j.neuron.2023.02.018, PMID: - DOI - PubMed
    1. Bosson A., Paumier A., Boisseau S., Jacquier-Sarlin M., Buisson A., Albrieux M. (2017). TRPA1 channels promote astrocytic Ca2+ hyperactivity and synaptic dysfunction mediated by oligomeric forms of amyloid-β peptide. Mol. Neurodegener. 12, 53–19. doi: 10.1186/s13024-017-0194-8, PMID: - DOI - PMC - PubMed
    1. Cadoni S., Demené C., Alcala I., Provansal M., Nguyen D., Nelidova D., et al. . (2023). Ectopic expression of a mechanosensitive channel confers spatiotemporal resolution to ultrasound stimulations of neurons for visual restoration. Nat. Nanotechnol. 18, 667–676. doi: 10.1038/s41565-023-01359-6, PMID: - DOI - PMC - PubMed
    1. Chen S. G., Tsai C. H., Lin C. J., Lee C. C., Yu H. Y., Hsieh T. H., et al. . (2020). Transcranial focused ultrasound pulsation suppresses pentylenetetrazol induced epilepsy in vivo. Brain Stimul. 13, 35–46. doi: 10.1016/j.brs.2019.09.011, PMID: - DOI - PubMed

LinkOut - more resources