. 2024 Mar 27:15:1369311.
doi: 10.3389/fimmu.2024.1369311. eCollection 2024.

Bioinformatics and system biology approach to identify the influences among COVID-19, influenza, and HIV on the regulation of gene expression

Affiliations

Bioinformatics and system biology approach to identify the influences among COVID-19, influenza, and HIV on the regulation of gene expression

Zhen Zhang et al. Front Immunol. .

Abstract

Background: Coronavirus disease (COVID-19), caused by SARS-CoV-2, has emerged as a infectious disease, coexisting with widespread seasonal and sporadic influenza epidemics globally. Individuals living with HIV, characterized by compromised immune systems, face an elevated risk of severe outcomes and increased mortality when affected by COVID-19. Despite this connection, the molecular intricacies linking COVID-19, influenza, and HIV remain unclear. Our research endeavors to elucidate the shared pathways and molecular markers in individuals with HIV concurrently infected with COVID-19 and influenza. Furthermore, we aim to identify potential medications that may prove beneficial in managing these three interconnected illnesses.

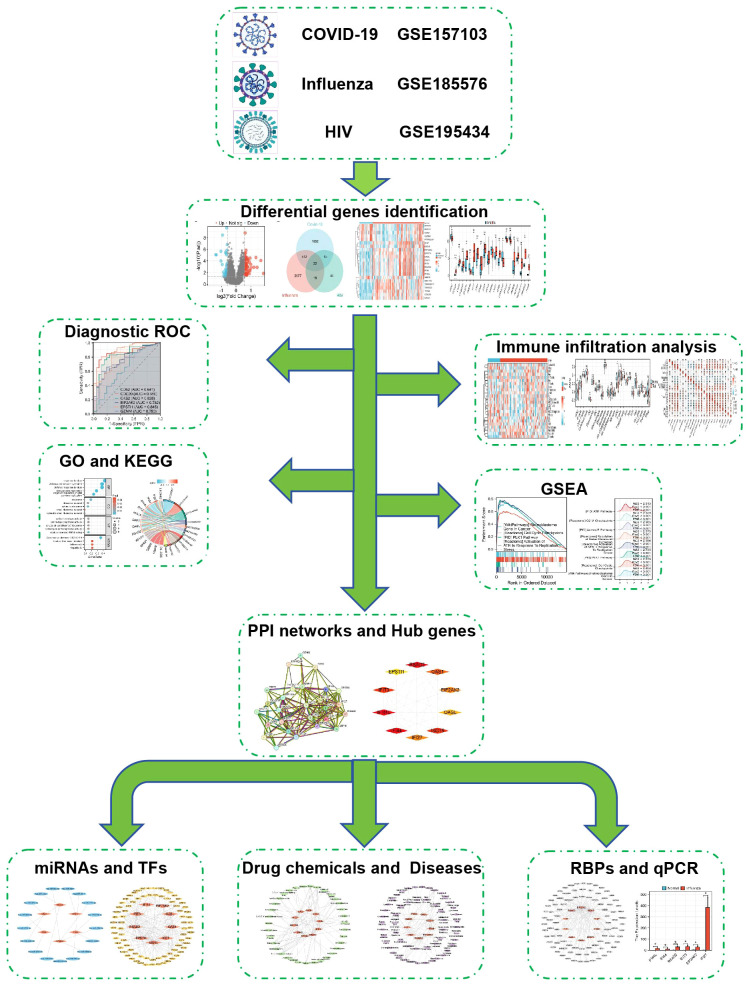
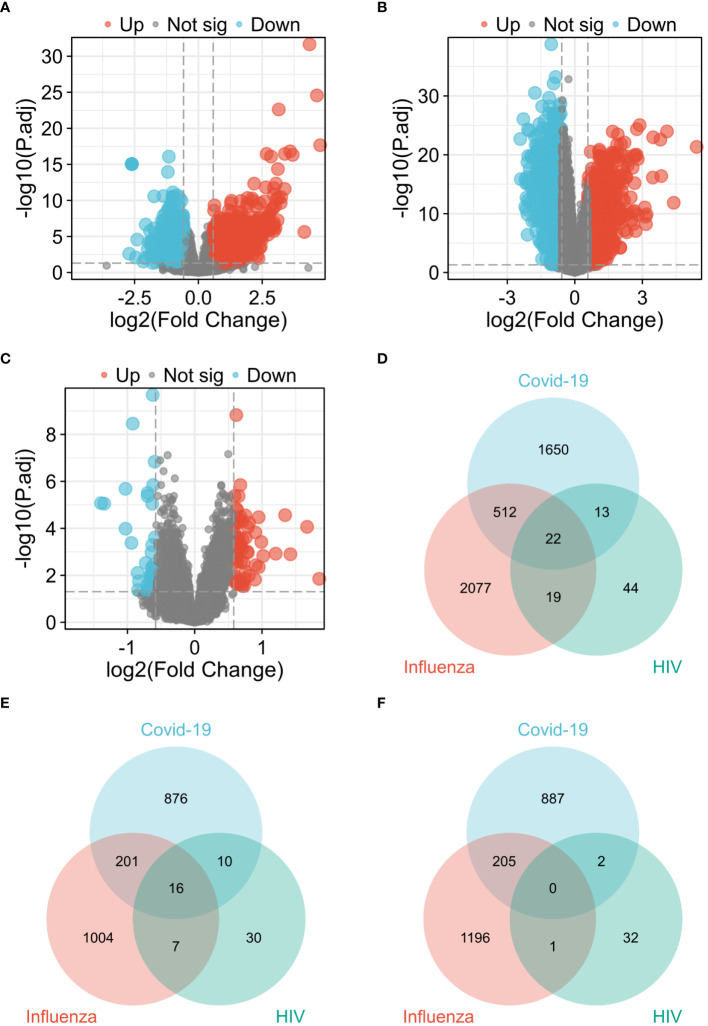
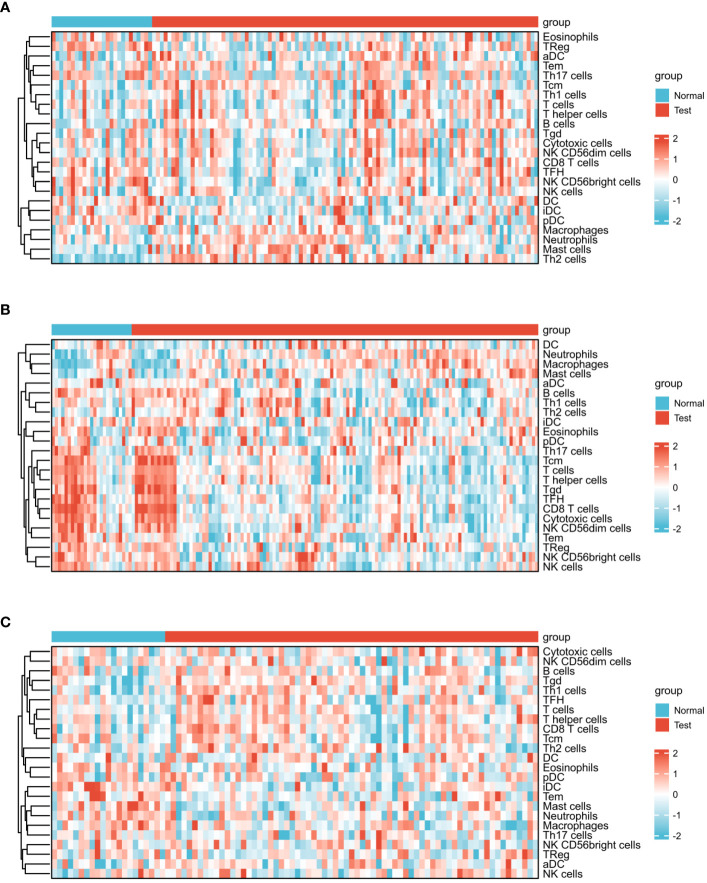
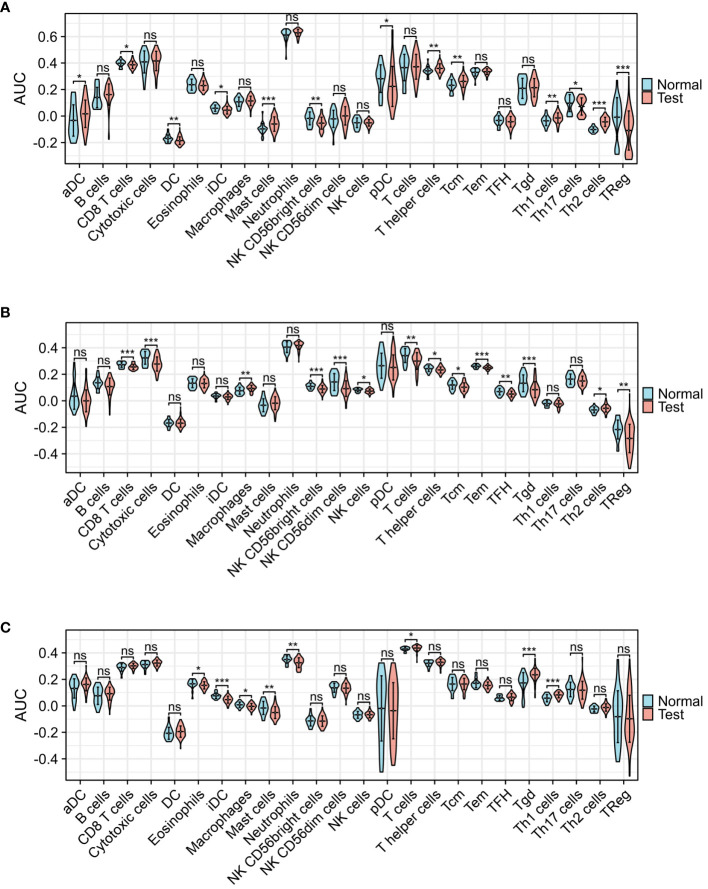
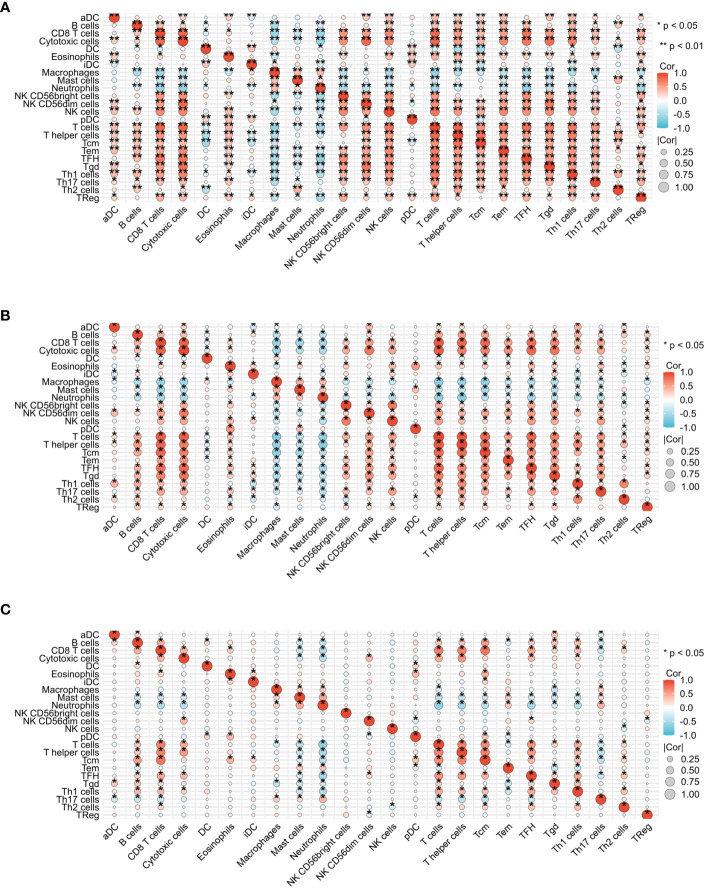
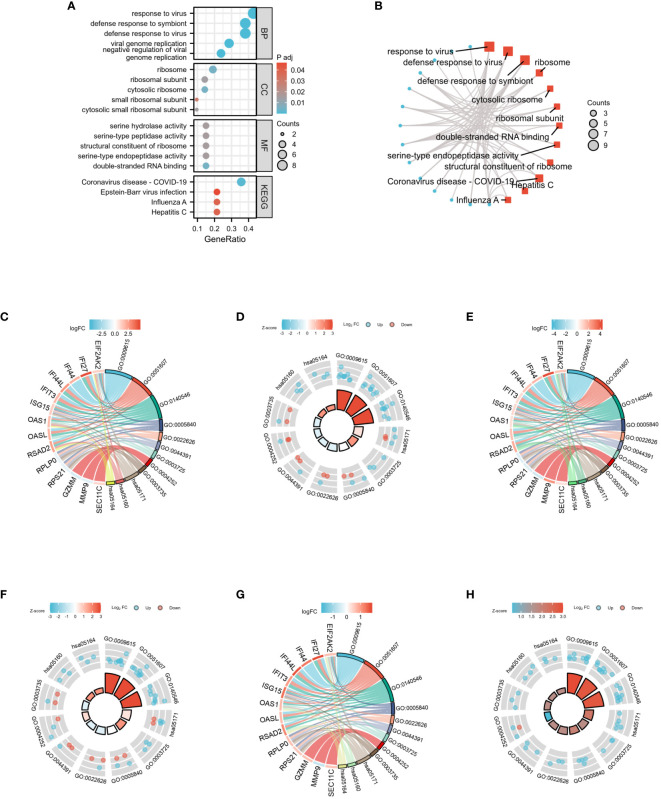
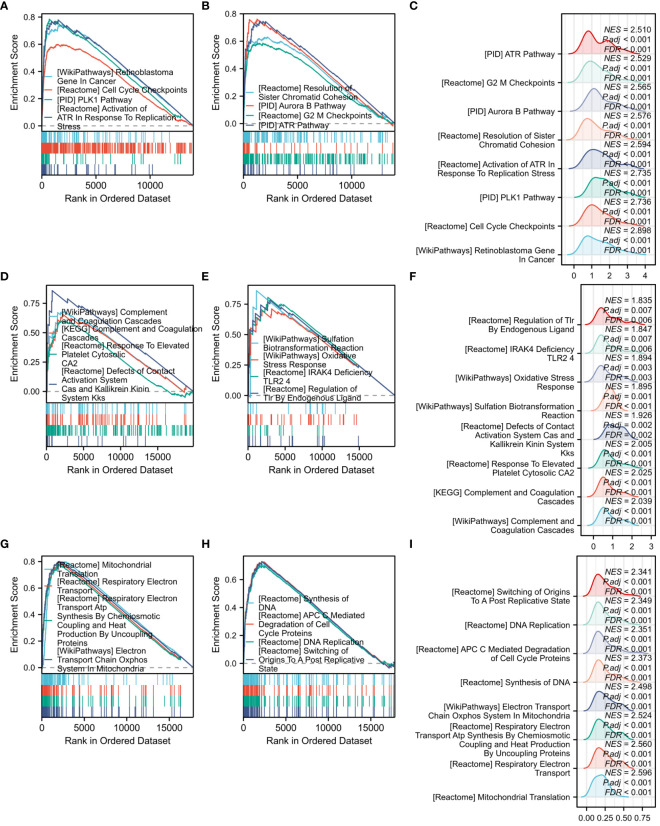
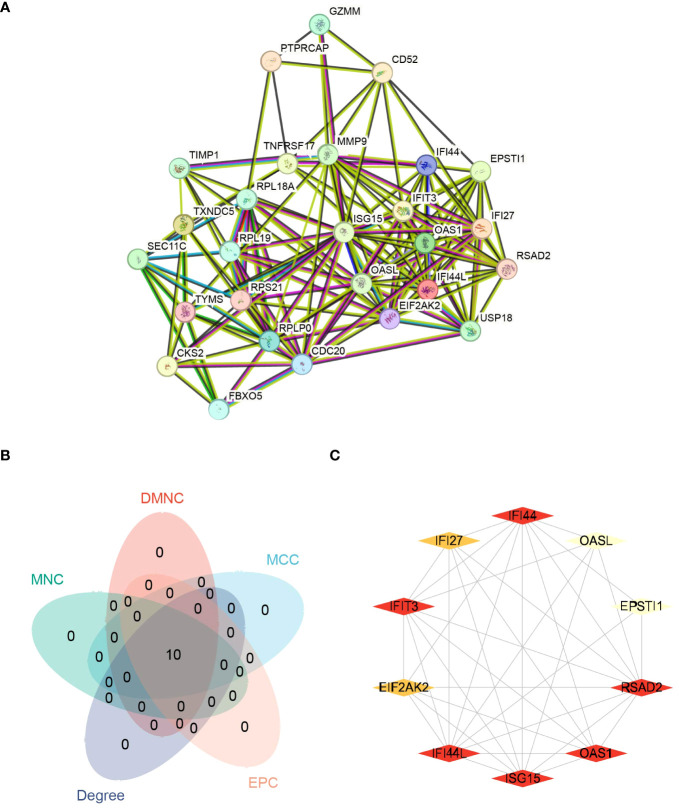
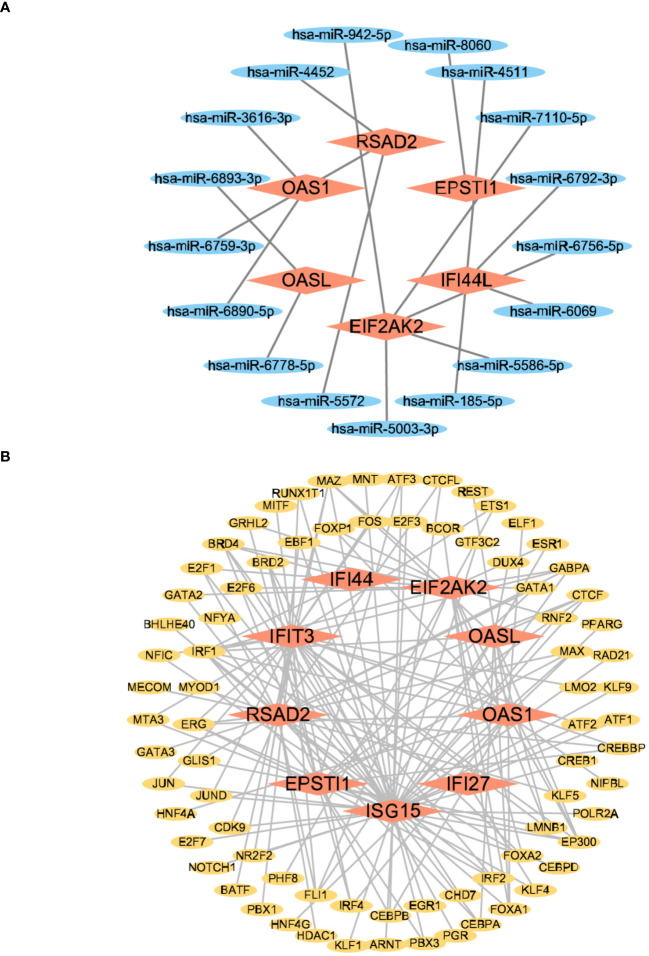
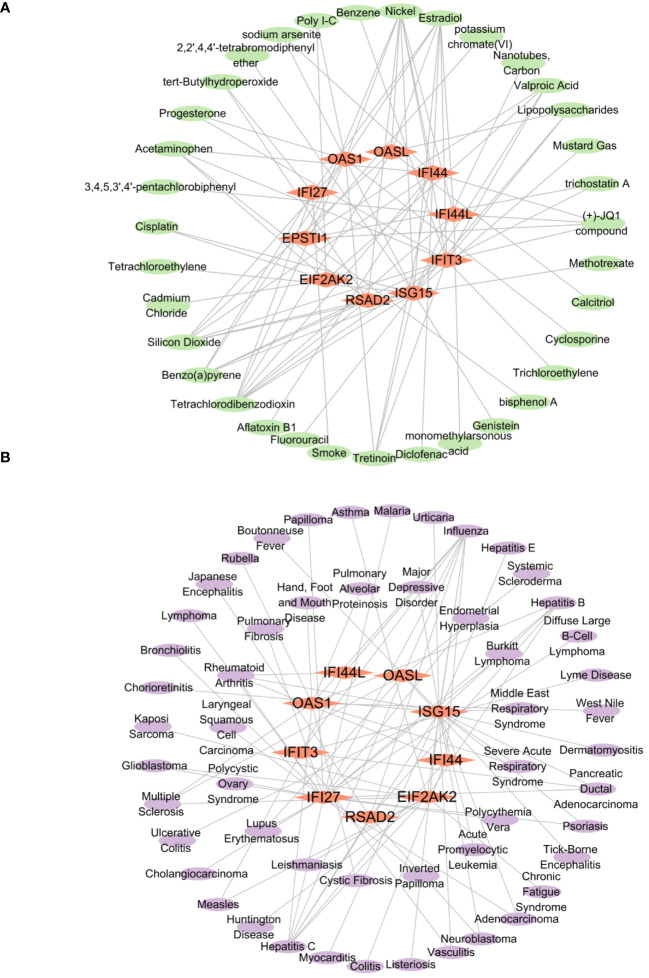
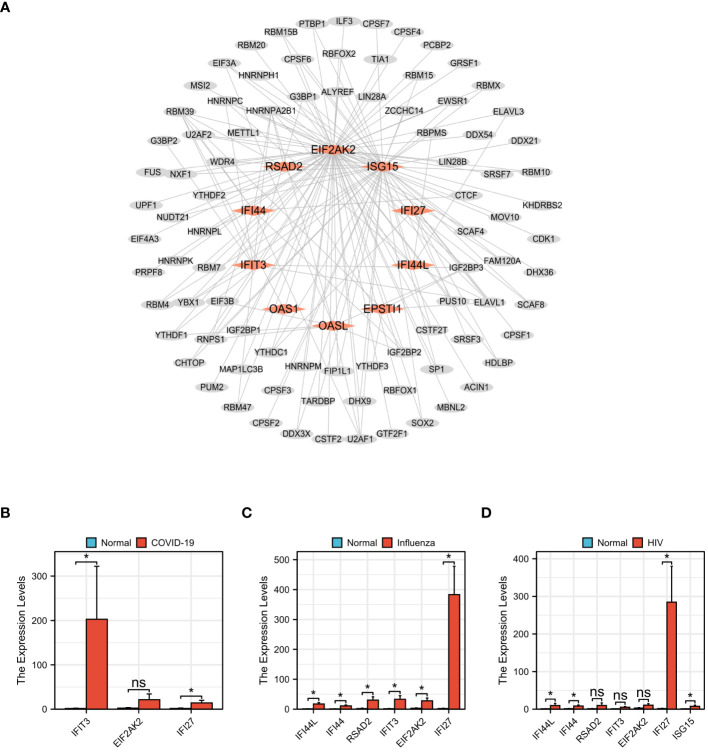
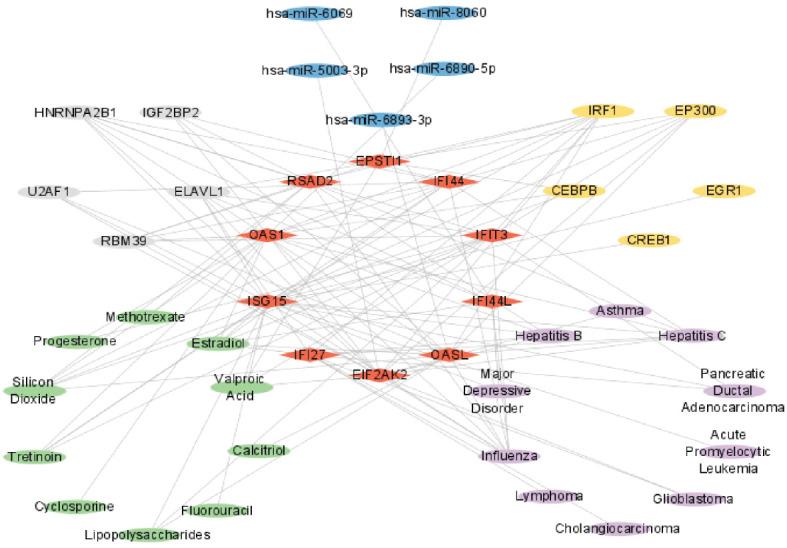
Methods: Sequencing data for COVID-19 (GSE157103), influenza (GSE185576), and HIV (GSE195434) were retrieved from the GEO database. Commonly expressed differentially expressed genes (DEGs) were identified across the three datasets, followed by immune infiltration analysis and diagnostic ROC analysis on the DEGs. Functional enrichment analysis was performed using GO/KEGG and Gene Set Enrichment Analysis (GSEA). Hub genes were screened through a Protein-Protein Interaction networks (PPIs) analysis among DEGs. Analysis of miRNAs, transcription factors, drug chemicals, diseases, and RNA-binding proteins was conducted based on the identified hub genes. Finally, quantitative PCR (qPCR) expression verification was undertaken for selected hub genes.

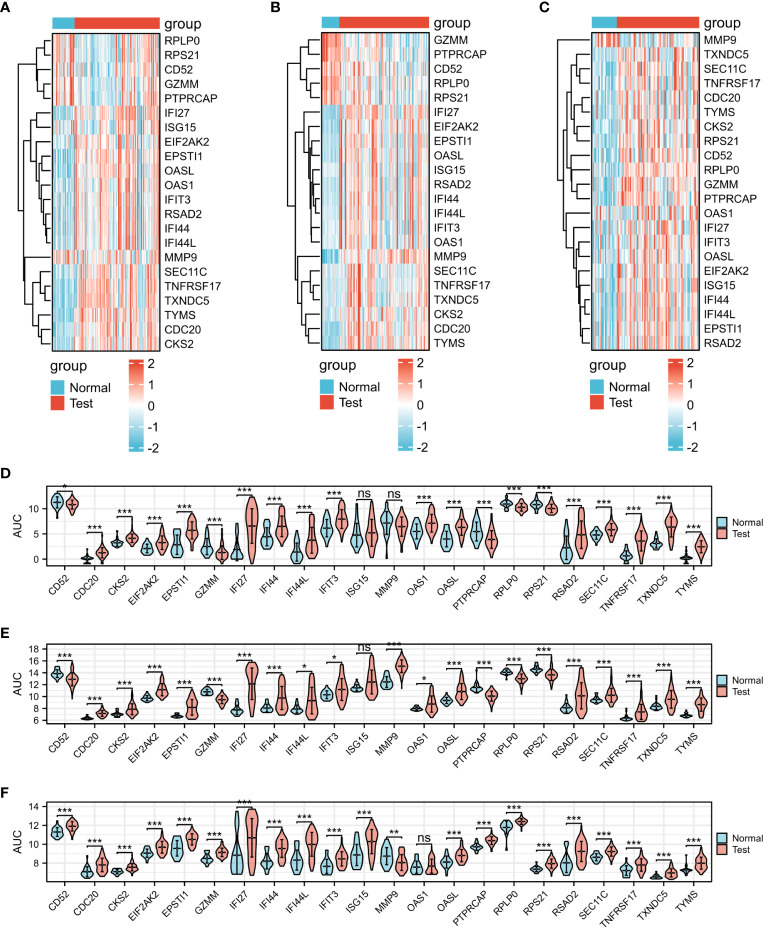
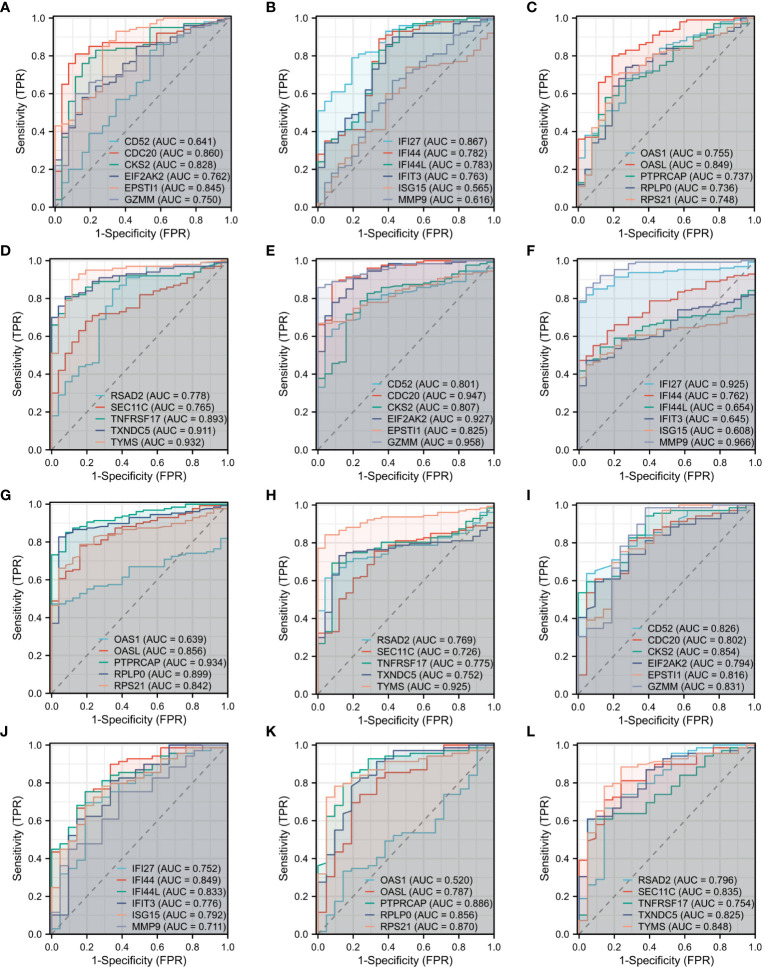
Results: The analysis of the three datasets revealed a total of 22 shared DEGs, with the majority exhibiting an area under the curve value exceeding 0.7. Functional enrichment analysis with GO/KEGG and GSEA primarily highlighted signaling pathways associated with ribosomes and tumors. The ten identified hub genes included IFI44L, IFI44, RSAD2, ISG15, IFIT3, OAS1, EIF2AK2, IFI27, OASL, and EPSTI1. Additionally, five crucial miRNAs (hsa-miR-8060, hsa-miR-6890-5p, hsa-miR-5003-3p, hsa-miR-6893-3p, and hsa-miR-6069), five essential transcription factors (CREB1, CEBPB, EGR1, EP300, and IRF1), and the top ten significant drug chemicals (estradiol, progesterone, tretinoin, calcitriol, fluorouracil, methotrexate, lipopolysaccharide, valproic acid, silicon dioxide, cyclosporine) were identified.

Conclusion: This research provides valuable insights into shared molecular targets, signaling pathways, drug chemicals, and potential biomarkers for individuals facing the complex intersection of COVID-19, influenza, and HIV. These findings hold promise for enhancing the precision of diagnosis and treatment for individuals with HIV co-infected with COVID-19 and influenza.

Keywords: COVID-19; HIV; differentially expressed genes; drug chemicals; hub genes; immune infiltration; influenza; protein-protein interaction networks.


Conflict of interest statement

The authors declare that the research was conducted in the absence of any commercial or financial relationships that could be construed as a potential conflict of interest.

Figures

Figure 1
Figure 1
Schematic illustration of the overall general workflow of this study.
Figure 2
Figure 2
Visualization of common diferentially expressed genes (DEGs) among COVID-19, Influenza and HIV. (A) Volcano plot of COVID-19 in GSE157103 dataset. (B) Volcano plot of Influenza in GSE185576 dataset. (C) Volcano plot of HIV in GSE195434 dataset. (D) Venn diagram showing the overlap of up-regulated and down-regulated DEGs among three diseases. (E) Venn diagram showing only up-regulated DEGs overlap among three diseases. (F) Venn diagram showing only down-regulated DEGs overlap among three diseases.
Figure 3
Figure 3
Expression analysis of the 22 DEGs among three diseases. (A) Heat map of COVID-19. (B) Heat map of Influenza. (C) Heat map of HIV. (D) mRNA expression levels of COVID-19. (E) mRNA expression levels of Influenza. (F) mRNA expression levels of HIV.
Figure 4
Figure 4
Diagnostic ROC curve analysis of 22 DEGs among three diseases. (A) ROC of CD52, CDC20, CKS2, EIF2AK2, EPSTI1, GZMM in COVID-19. (B) ROC of IFI27, IFI44, IFI44L, IFIT3, ISG15, MMP9 in COVID-19. (C) ROC of OAS1, OASL, PTPRCAP, RPLP0, RPS21 in COVID-19. (D) ROC of RSAD2, SEC11C, TNFRSF17, TXNDC5, TYMS in COVID-19. (E) ROC of CD52, CDC20, CKS2, EIF2AK2, EPSTI1, GZMM in Influenza. (F) ROC of IFI27, IFI44, IFI44L, IFIT3, ISG15, MMP9 in Influenza. (G) ROC of OAS1, OASL, PTPRCAP, RPLP0, RPS21 in Influenza. (H) ROC of RSAD2, SEC11C, TNFRSF17, TXNDC5, TYMS in Influenza. (I) ROC of CD52, CDC20, CKS2, EIF2AK2, EPSTI1, GZMM in HIV. (J) ROC of IFI27, IFI44, IFI44L, IFIT3, ISG15, MMP9 in HIV. (K) ROC of OAS1, OASL, PTPRCAP, RPLP0, RPS21 in HIV. (L) ROC of RSAD2, SEC11C, TNFRSF17, TXNDC5, TYMS in HIV.
Figure 5
Figure 5
Expression analysis of infiltrated immune cells by ssGSEA algorithm among three diseases. (A) Heat map of COVID-19. (B) Heat map of Influenza. (C) Heat map of HIV.
Figure 6
Figure 6
Group comparison graphs of infiltrated immune cells by ssGSEA algorithm among three diseases. (A) Infiltrated immune cells expression levels of COVID-19. (B) Infiltrated immune cells expression levels of Influenza. (C) Infiltrated immune cells expression levels of HIV. (*p<0.05, **p<0.01, ***p<0.001, ns meant no significant difference).
Figure 7
Figure 7
Correlation heat map analysis of infiltrated immune cells by ssGSEA algorithm among three diseases. (A) Correlation heat map of COVID-19. (B) Correlation heat map of Influenza. (C) Correlation heat map of HIV.
Figure 8
Figure 8
GO and KEGG functional enrichment analysis of 22 DEGs among three diseases. (A) The bubble graph of GO and KEGG functional enrichment analysis. (B) The network diagram of GO and KEGG functional enrichment analysis. (C) Chordal diagram of GO/KEGG-United logFC in COVID-19. (D) Loop graph of GO/KEGG-United logFC in COVID-19. (E) Chordal diagram of GO/KEGG-United logFC in Influenza. (F) Loop graph of GO/KEGG-United logFC in Influenza. (G) Chordal diagram of GO/KEGG-United logFC in HIV. (H) Loop graph of GO/KEGG-United logFC in HIV.
Figure 9
Figure 9
GSEA functional enrichment analysis of all genes among three diseases. (A) Classic graph of 1-4 pathways in COVID-19. (B) Classic graph of 5-8 pathways in COVID-19. (C) Mountain plot of 8 pathways in COVID-19. (D) Classic graph of 1-4 pathways in Influenza. (E) Classic graph of 5-8 pathways in Influenza. (F) Mountain plot of 8 pathways in Influenza. (G) Classic graph of 1-4 pathways in HIV. (H) Classic graph of 5-8 pathways in HIV. (I) Mountain plot of 8 pathways in HIV.
Figure 10
Figure 10
Protein-protein interaction networks (PPIs) and hub genes for common DEGs to COVID-19, Influenza and HIV. (A) Shared DEGs of COVID-19, Influenza and HIV in the PPIs (27 nodes,143 edges). (B) The Venn diagram of screened hub genes from MCC, DMNC, MNC, Degree and EPC 5 algorithms. (C) The red and yellow rhomboid nodes represent the top 10 hub genes and edges represent the interactions between nodes.
Figure 11
Figure 11
The interconnected regulatory interaction network of Hub genes–miRNAs and Hub genes–TFs. (A) Hub genes–miRNAs,red rhomboid nodes indicate Hub genes and blue oval nodes represent miRNAs (23 nodes,17 edges). (B) Hub genes–TFs,red rhomboid nodes indicate Hub genes and yellow oval nodes represent TFs (87 nodes,163 edges).
Figure 12
Figure 12
The interconnected regulatory interaction network of Hub genes–Drug chemicals and Hub genes–diseases. (A) Hub genes–Drug chemicals,red rhomboid nodes indicate Hub genes and green oval nodes represent Drug chemicals (45 nodes, 84 edges). (B) Hub genes–diseases,red rhomboid nodes indicate Hub genes and purple oval nodes represent diseases (62 nodes, 87 edges).
Figure 13
Figure 13
Prediction of Hub genes–RBPs and qPCR validation among COVID-19, Influenza and HIV. (A) Hub genes–RBPs,red rhomboid nodes indicate Hub genes and gray oval nodes represent RBPs (98 nodes, 164 edges). (B) The mRNA expression levels of IFIT3,EIF2AK2,IFI27 in COVID-19. (C) The mRNA expression levels of IFI44L,IFI44,RSAD2,IFIT3,EIF2AK2,IFI27 in Influenza. (D) The mRNA expression levels of IFI44L,IFI44,RSAD2,IFIT3,EIF2AK2,IFI27,ISG15 in HIV. (*p<0.05, ns meant no significant difference).
Figure 14
Figure 14
Complex interrelationships of Hub gene, miRNA, transcription factor, drug chemical, disease, and RBP. Red rhomboid nodes indicate Hub genes, blue oval nodes represent miRNAs, yellow oval nodes represent transcription factors, green oval nodes represent Drug chemicals, purple oval nodes represent diseases, and gray oval nodes represent RBPs(45 nodes, 114 edges).

References

    1. Lu R, Zhao X, Li J, Niu P, Yang B, Wu H, et al. . Genomic characterisation and epidemiology of 2019 novel Coronavirus: implications for virus origins and receptor binding. Lancet (London England). (2020) 395:565–74. doi: 10.1016/s0140-6736(20)30251-8 - DOI - PMC - PubMed
    1. Finkel Y, Mizrahi O, Nachshon A, Weingarten-Gabbay S, Morgenstern D, Yahalom-Ronen Y, et al. . The coding capacity of Sars-Cov-2. Nature. (2021) 589:125–30. doi: 10.1038/s41586-020-2739-1 - DOI - PubMed
    1. Cooper TJ, Woodward BL, Alom S, Harky A. Coronavirus disease 2019 (Covid-19) outcomes in Hiv/Aids patients: A systematic review. HIV Med. (2020) 21:567–77. doi: 10.1111/hiv.12911 - DOI - PMC - PubMed
    1. Zhu N, Zhang D, Wang W, Li X, Yang B, Song J, et al. . A novel Coronavirus from patients with pneumonia in China, 2019. N Engl J Med. (2020) 382:727–33. doi: 10.1056/NEJMoa2001017 - DOI - PMC - PubMed
    1. Abd El-Aziz TM, Stockand JD. Recent progress and challenges in drug development against Covid-19 Coronavirus (Sars-Cov-2) - an update on the status. Infect Genet Evol. (2020) 83:104327. doi: 10.1016/j.meegid.2020.104327 - DOI - PMC - PubMed