. 2024 Mar 29;13(3):587-602.
doi: 10.21037/tlcr-24-160. Epub 2024 Mar 27.

The role of RASA2 in predicting radioresistance in lung cancer through regulation of p53

Affiliations

The role of RASA2 in predicting radioresistance in lung cancer through regulation of p53

Jie Li et al. Transl Lung Cancer Res. .

Abstract

Background: One of the most common causes of lung cancer relapse after clinical treatment is radioresistance. However, the mechanism underlying radioresistance remains unclear. In this study, we investigated the role of Ras p21 protein activator (RASA2) in non-small cell lung cancer (NSCLC).

Methods: The messenger RNA (mRNA) of RASA2 was tested via reverse-transcription quantitative polymerase chain reaction (RT-qPCR) of cancer tissues from patients with NSCLC. Computed tomography (CT) and bioluminescent imaging (BLI) were used to monitor the tumor growth of patients and orthotopic mice, respectively. Protein-protein interaction was quantified via immunoprecipitation and glutathione S transferase (GST) pulldown assay. Western blotting was used to evaluate the phosphorylation and ubiquitination level of p53.

Results: The results indicated a negative correlation between the mRNA expression levels of RASA2 in tumor tissues with patients' response to radiotherapy. Patients with a high expression of RASA2 had a lower objective response rate (ORR) after 1 month of radiotherapy than patients with low expression of RASA2 after 1 month of radiotherapy. In terms of mechanism, we proved that RASA2 can directly bind to p53 to promote the phosphorylation of p53, which inhibits its transcriptional activity and further promotes its degradation through the ubiquitin/proteasome pathway. In this process, the apoptosis of tumor cells is inhibited due to impaired p53 surveillance, which leads to radioresistance.

Conclusions: Our results demonstrate that RASA2 negatively regulates p53 in cancer cells and therefore promotes radioresistance, providing a new predictive biomarker and a potential therapeutic target for radioresistance.

Keywords: Ras p21 protein activator (RASA2); non-small cell lung cancer (NSCLC); p53; radioresistance.


Conflict of interest statement

Conflicts of Interest: All authors have completed the ICMJE uniform disclosure form (available at https://tlcr.amegroups.com/article/view/10.21037/tlcr-24-160/coif). The authors have no conflicts of interest to declare.

Figures

Figure 1
Figure 1
RASA2 was correlated with a poor response to radiotherapy among patients with lung cancer. (A) RASA2 expression data from normal lung tissue and lung cancer from the TCGA and GTEx databases were analyzed via R. (B) ROC curve of RASA2 from data of TCGA as analyzed with RStudio. (C) Representative procedure of specimens retrieved via CT-guided needle biopsy. Red arrows indicated the location of inserting. (D) Representative IHC images of RASA2 from tumor sections by (magnification, 400×). (E) IHC staining of RASA2 in tissue microarrays (magnification, 40×) of lung cancer from the Human Protein Atlas (https://www.proteinatlas.org/ENSG00000155903-RASA2/pathology/lung+cancer#img). (F) The whiskers of box plots of the radiotherapy response grouped by RASA2 expression in cancer tissue. Data were analyzed with the Mann-Whitney test. (G) ORR in the RASA2 low- and high-expression groups in tissue, with the optimal cutoff value being used as the threshold. (H) Representative CT images of irradiated lesions before and after 1 month of radiotherapy in patients with different RASA2 expression levels. (I) Overall survival in patients with RASA2 high or low expression from January 2016 and June 2018. (J) Kaplan-Meier plot of overall survival in patients with different RASA2 expression levels. (https://kmplot.com/analysis/). Significance was determined by log-rank (Mantel-Cox) test (I) or t-test (A,G) and is shown as *, P<0.05; **, P<0.01; and ***, P<0.001. RASA2, Ras p21 protein activator; FPKM, fragments per kilobase of exon model per million mapped reads; TPR, true positive rate; FPR, false positive rate; AUC, area under the curve; CI, confidence interval; HE, hematoxylin-eosin; mRNA, messenger RNA; GAPDH, glyceraldehyde-3-phosphate dehydrogenase; RASA2-L, low expression of RASA2; RASA2-H, high expression of RASA2; HR, hazard ratio; TCGA, The Cancer Genome Atlas; GTEx, Genotype-Tissue Expression; ROC, receiver operating characteristic; CT, computed tomography; IHC, immunohistochemical; ORR, objective response rate.
Figure 2
Figure 2
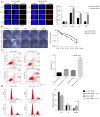
RASA2 modulated DNA damage and cell apoptosis induced by irradiation. (A) Left panel: γ-H2AX foci staining under immunofluorescence at different time points (0 minutes, 30 minutes, 4 hours, and 24 hours) in RASA2-wild type and RASA2-knockdown lung cancer cell lines. Scale bar =50 µm. Right panel: quantification of γ-H2AX foci per cell at different time points according to ImageJ. Foci means subnuclear spots. (B) Left panel: colony formation in RASA2-wild type and RASA2-knockdown A549 cancer cells with different doses of irradiation by crystal violet (0.5% w/v) staining. Right panel: the survival fraction was evaluated 2 weeks later after irradiation, and the number of colonies at different doses was normalized to the number of colonies in the 0 Gy group. (C) Left panel: flowchart of apoptotic cells stained with annexin V-FITC/PI. Right panel: quantification of the apoptosis rate. (D) Left panel: representative flowchart of the cell cycle phase. Right panel: quantification of the cell cycle distribution (G1, S, G2/M). (A-D) One of three representative experiments. Significance was determined by t-test (A,C), two-way ANOVA (B), one-way ANOVA (D) and is shown as *, P<0.05; **, P<0.01; and ***, P<0.001. DAPI, 4',6-diamidino-2-phenylindole; siRNA, small interfering RNA; RASA2, Ras p21 protein activator; PI, propidium iodide; FITC, fluorescein isothiocyanate; ANOVA, analysis of variance.
Figure 3
Figure 3
RASA2 regulated radiotherapy efficacy by decreasing p53 expression. (A) p53 and p21 protein expression in multiple lung cancer cell lines after transfection of cells with two RASA2 siRNAs and a control siRNA. One of two representative experiments is shown. (B) After 8 Gy of irradiation, cell viability was measured in the p53-proficient or p53-deficient HCT116 cell lines with RASA2 control or knockdown. One of three representative experiments is shown. (C) After 0- or 8-Gy treatment, western blotting was used to analyze p53-related apoptosis pathway protein levels in the HCT116 p53(+/+) and HCT116 p53(−/−) cell lines. One of two representative experiments is shown. (D) Western blotting of RASA2 and p53 expression from 10 patient samples. One of two representative experiments is shown. (E) Expression of RASA2 in patients with LUAD based on TP53 mutation status. Data were analyzed from UALCAN (http://ualcan.path.uab.edu/cgi-bin/TCGAExResultNew2.pl?genenam=RASA2&ctype=LUAD). Significance was determined by t-test (B,E) and is shown as **, P<0.01 and ***, P<0.001. siRNA, small interfering RNA; RASA2, Ras p21 protein activator; GAPDH, glyceraldehyde-3-phosphate dehydrogenase; TCGA, The Cancer Genome Atlas; LUAD, lung adenocarcinoma.
Figure 4
Figure 4
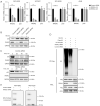
RASA2 regulated p53 stability via the ubiquitin/proteasome pathway. (A) Relative mRNA levels of p53 in RASA2 knockdown and control cell lines. One of three representative experiments is shown. (B) p53 and RASA2 protein expression in the control siRNA or RASA2 siRNA transfected NCI-H226 cells. Cells were treated with MG132 (10 µM, 4 hours) before harvesting. One of three representative experiments is shown. (C) Time course of RASA2 and p53 protein expression according to WB after transfection with RASA2-siRNA or control-siRNA. One of three representative experiments is shown. (D) p53 ubiquitin levels were analyzed with IP-WB. After transfection with control-siRNA or RASA2-siRNA in NCI-H226 for 24 hours, cells were harvested after 10 µM of MG132 treatment for 4 hours. (E) In the NCI-H292 and NCI-H226 cell lines, p53 phosphorylation was measured by WB in RASA2-knockdown cells. (D,E) One of two representative experiments is shown. Overexposed, the membrane was overexposed to assess constitutive p53 phosphorylation levels in RASA2 knockdown and control cells. Significance was determined by one-way ANOVA (A) and is shown as ***, P<0.001. mRNA, messenger RNA; RASA2, Ras p21 protein activator; siRNA, small interfering RNA; GAPDH, glyceraldehyde-3-phosphate dehydrogenase; HA, hemagglutinin; IP, immunoprecipitation; WCL, whole cell lysate; WB, western blotting; ANOVA, analysis of variance.
Figure 5
Figure 5
RASA2 directly interacted with p53 in the proline-rich domain. (A) RASA2 bound to p53 in HEK 293T cells via immunoprecipitation. (B) GST pulldown assays of GST or GST-p53 fusion proteins were incubated with Flag-RASA2 protein. (C) The p53 binding domain was assessed via WB. HEK 293T cells were cotransfected with constructs encoding Flag-RASA2 and p53 mutants, and then cell lysates were incubated with anti-Flag beads and analyzed. (D) IP-WB analysis of binding sites of p53WT and p53mPRD to RASA2 in the HCT116 p53(−/−) cell line. (A-D) One of three representative experiments is shown. IP, immunoprecipitation; IgG, immunoglobulin G; RASA2, Ras p21 protein activator; GST, glutathione S transferase; HA, hemagglutinin; WCL, whole cell lysate; GAPDH, glyceraldehyde-3-phosphate dehydrogenase; WB, western blotting; WT, wild-type.
Figure 6
Figure 6
Knockdown of RASA2 enhanced radiosensitivity in vivo. (A) Quantification of tumor volume in mice bearing cancer cells (NCI-H226) with RASA2-control or -knockdown tumors. Mice (n=3) were imaged 21 days after injection and 14 and 30 days after irradiation. Irradiation: 24 Gy (1.6 Gy/day × 15 days). One of three representative experiments is shown. (B) IHC staining with HE for RASA2 in tumor sections (magnification, 400×). One of three representative experiments is shown. (C) Tumor growth curve in the subcutaneous mouse model after receiving a total 40 Gy of irradiation (10 Gy/day ×4 days). One of three representative experiments is shown. (D) Apoptosis-related proteins were analyzed with western blotting of whole subcutaneous tumor lysates. One of two representative experiments is shown. (E) A proposed model shows mechanistically how RASA2 affects radioresistance. Mutated RASA2 binds p53, subsequently phosphorylates p53, and promotes p53 degradation via the ubiquitin/proteasome system. Under normal conditions, radiation-induced stress promotes p53 translocation into the nucleus, which enhances apoptosis-related protein expression and induces cell apoptosis. (Created with BioRender.com). Significance was determined by t-test (A), two-way ANOVA (C) and is shown as *, P<0.05; **, P<0.01; and ***, P<0.001. RASA2, Ras p21 protein activator; shRNA, short hairpin RNA; mRNA, messenger RNA; IHC, immunohistochemical; HE, hematoxylin-eosin; ANOVA, analysis of variance.

Similar articles

Cited by

References

    1. Vinod SK, Hau E. Radiotherapy treatment for lung cancer: Current status and future directions. Respirology 2020;25 Suppl 2:61-71. 10.1111/resp.13870 - DOI - PubMed
    1. Li H, Zhao Y, Ma T, et al. Radiotherapy for extensive-stage small-cell lung cancer in the immunotherapy era. Front Immunol 2023;14:1132482. 10.3389/fimmu.2023.1132482 - DOI - PMC - PubMed
    1. Wu Y, Song Y, Wang R, et al. Molecular mechanisms of tumor resistance to radiotherapy. Mol Cancer 2023;22:96. 10.1186/s12943-023-01801-2 - DOI - PMC - PubMed
    1. Galeaz C, Totis C, Bisio A. Radiation Resistance: A Matter of Transcription Factors. Front Oncol 2021;11:662840. 10.3389/fonc.2021.662840 - DOI - PMC - PubMed
    1. Pennell NA, Arcila ME, Gandara DR, et al. Biomarker Testing for Patients With Advanced Non-Small Cell Lung Cancer: Real-World Issues and Tough Choices. Am Soc Clin Oncol Educ Book 2019;39:531-42. 10.1200/EDBK_237863 - DOI - PubMed