. 2024 Jan 26;6(5):101018.
doi: 10.1016/j.jhepr.2024.101018. eCollection 2024 May.

CD14 facilitates perinatal human cytomegalovirus infection in biliary epithelial cells via CD55

Affiliations

CD14 facilitates perinatal human cytomegalovirus infection in biliary epithelial cells via CD55

Liang Su et al. JHEP Rep. .

Abstract

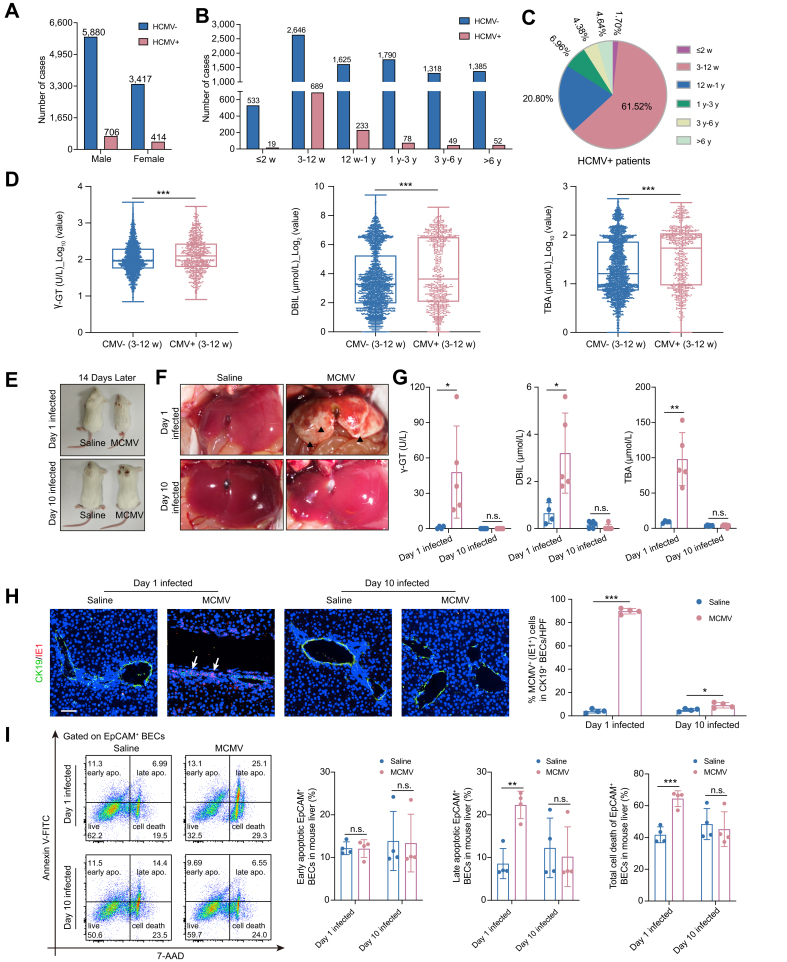
Background & aims: A high human cytomegalovirus (HCMV) infection rate accompanied by an increased level of bile duct damage is observed in the perinatal period. The possible mechanism was investigated.

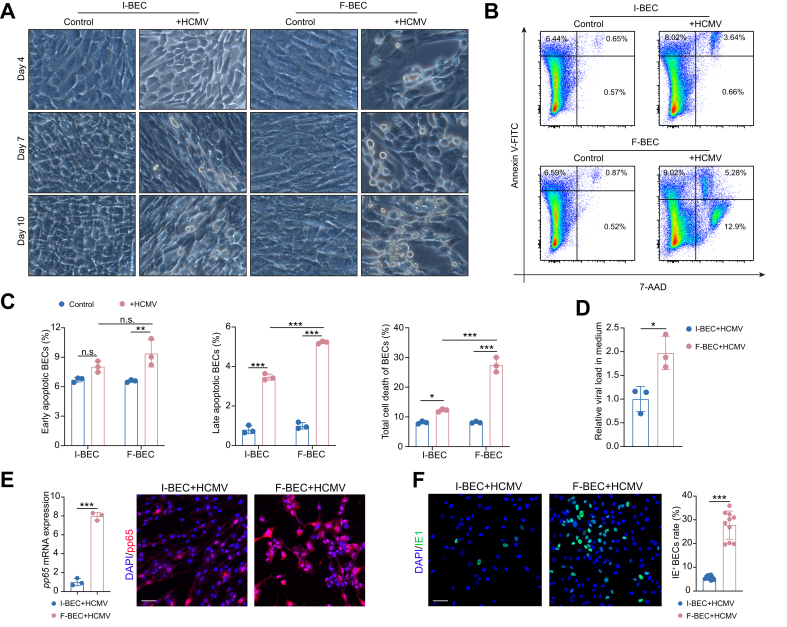
Methods: A total of 1,120 HCMV-positive and 9,297 HCMV-negative children were recruited, and depending on age, their liver biochemistry profile was compared. Fetal and infant biliary epithelial cells (F-BECs and I-BECs, respectively) were infected with HCMV, and the differences in cells were revealed by proteomic analysis. Protein-protein interactions were examined by coimmunoprecipitation and mass spectrometry analyses. A murine cytomegalovirus (MCMV) infection model was established to assess treatment effects.

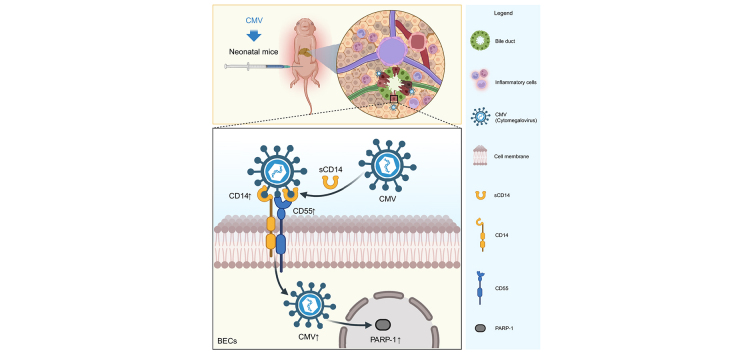
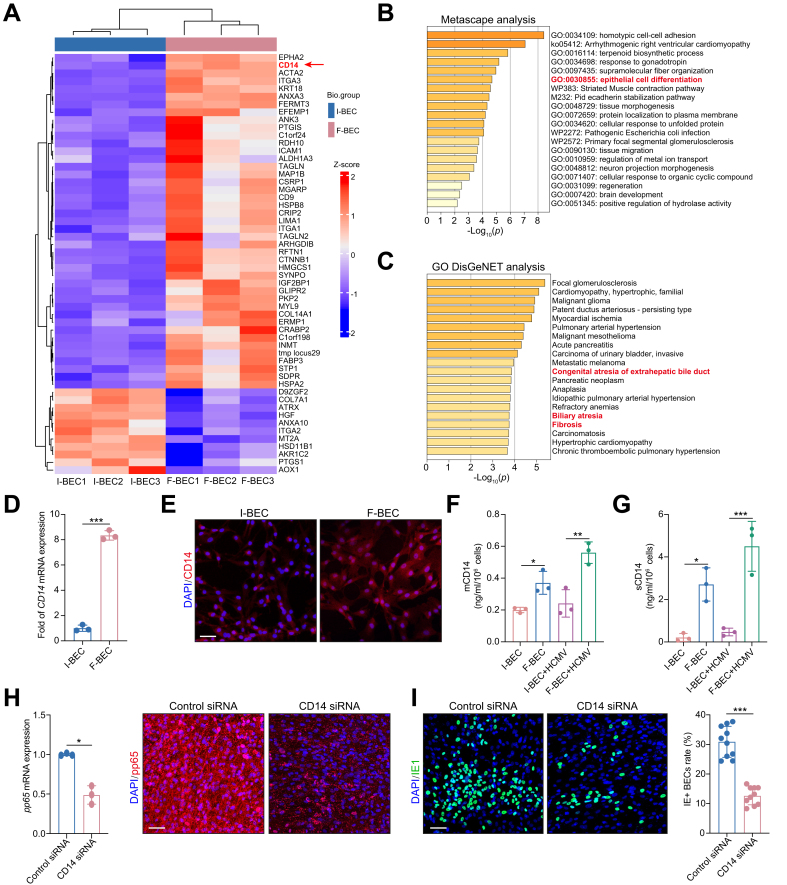
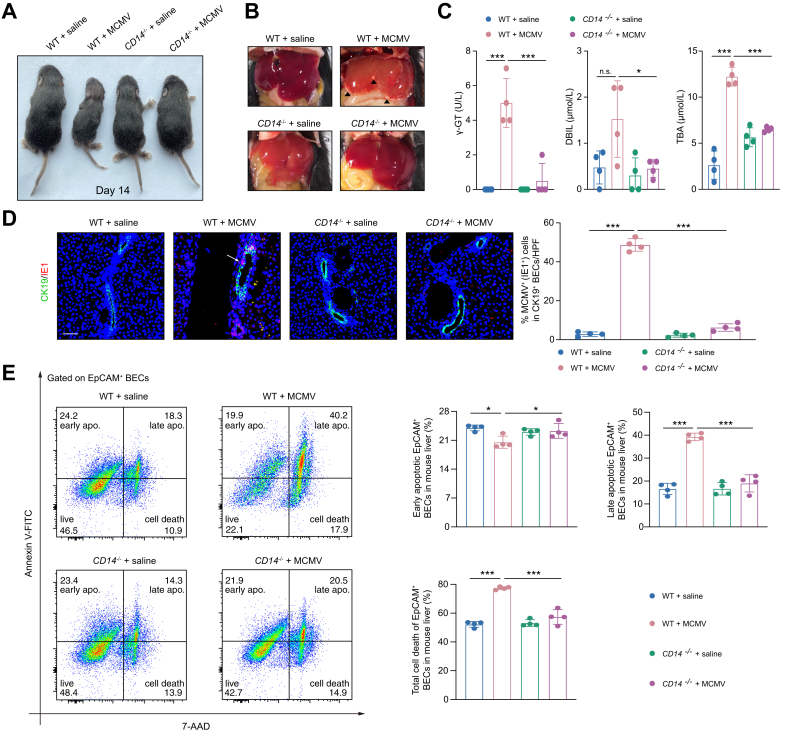
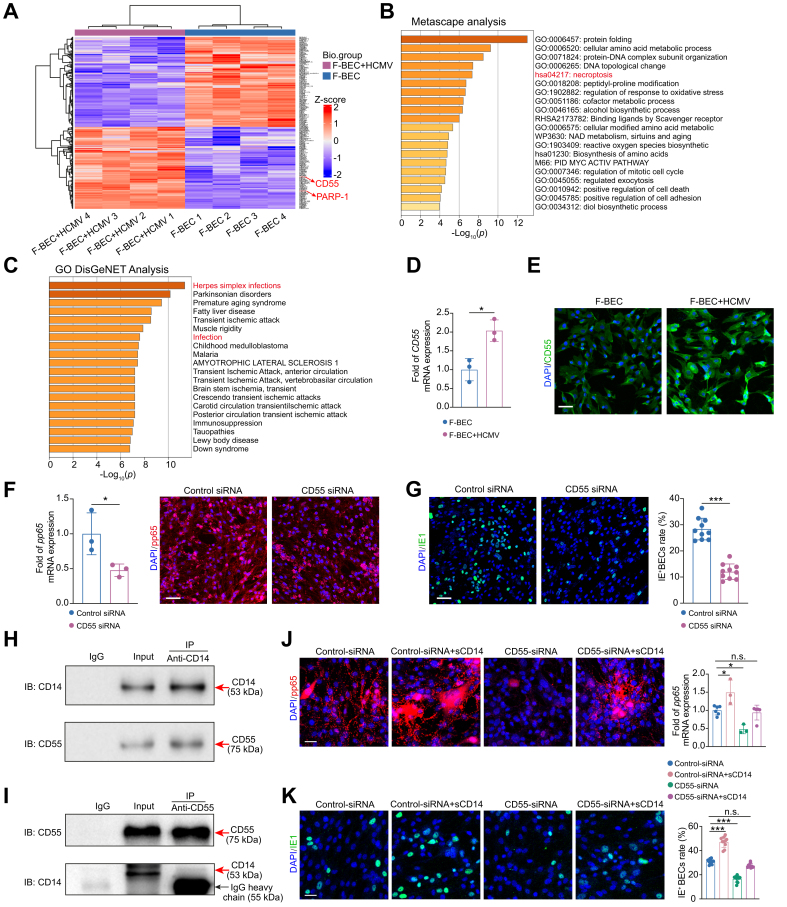
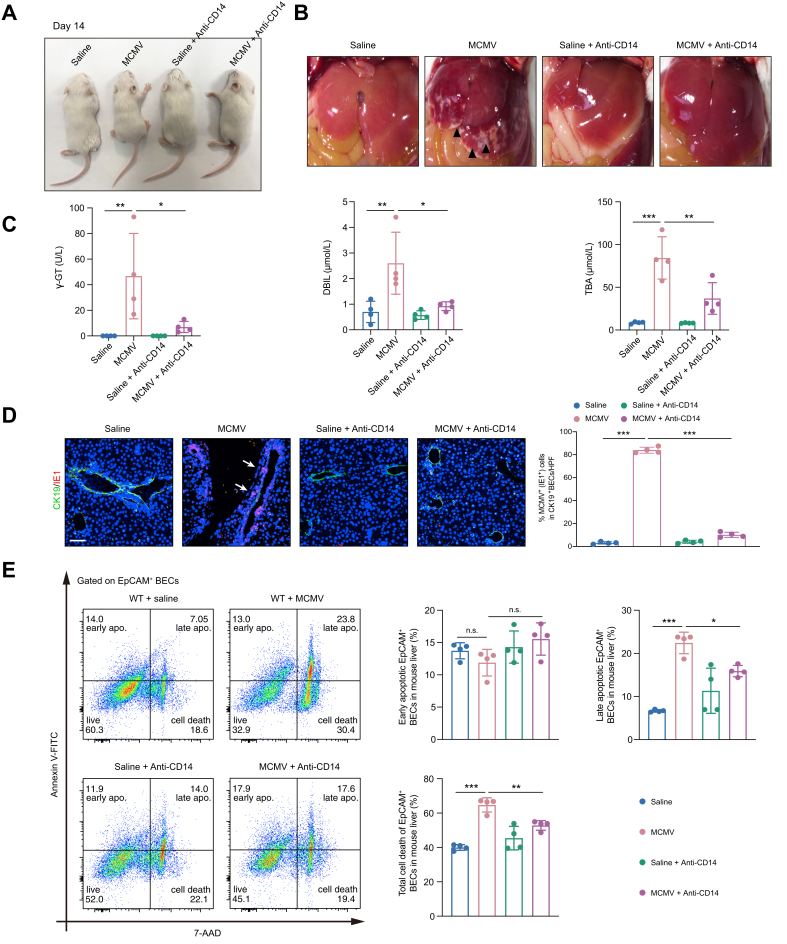
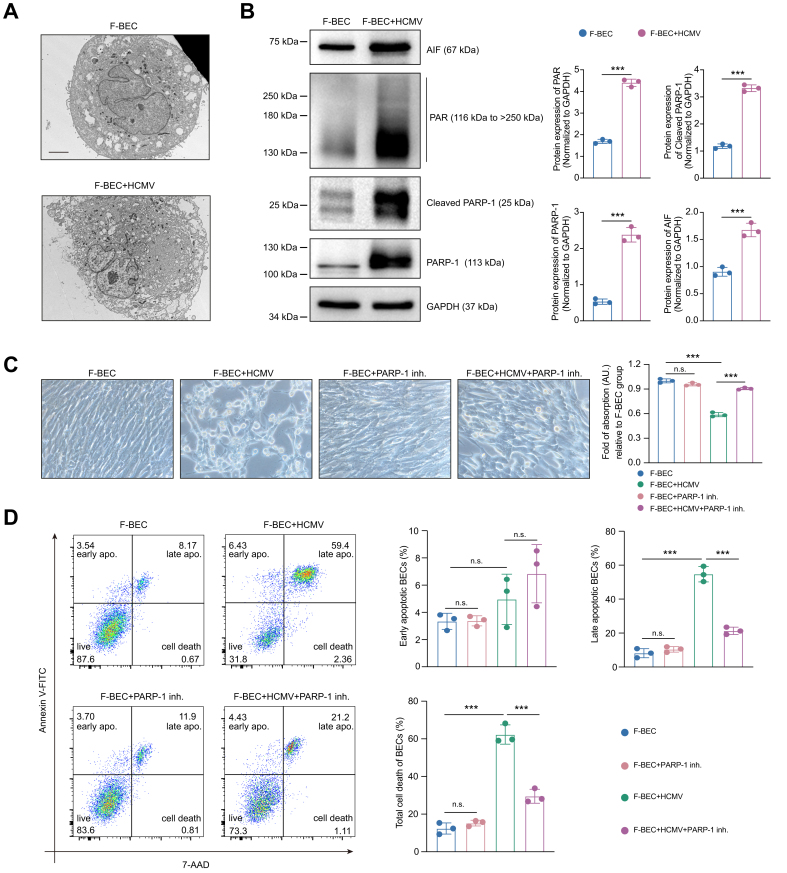
Results: Perinatal HCMV infection significantly increased the level of bile duct damage. Neonatal BALB/c mice inoculated with MCMV showed obvious inflammation in the portal area with an abnormal bile duct structure. Proteomics analysis showed higher CD14 expression in F-BECs than in I-BECs. CD14 siRNA administration hindered HCMV infection, and CD14-knockout mice showed lower MCMV-induced bile duct damage. HCMV infection upregulated CD55 and poly ADP-ribose polymerase-1 (PARP-1) expression in F-BECs. Coimmunoprecipitation and mass spectrometry analyses revealed formation of the CD14-CD55 complex. siRNA-mediated inhibition of CD55 expression reduced sCD14-promoted HCMV replication in F-BECs. In MCMV-infected mice, anti-mouse CD14 antibody and PARP-1 inhibitor treatment diminished cell death, ameliorated bile duct damage, and reduced mortality.

Conclusions: CD14 facilitates perinatal HCMV infection in BECs via CD55, and PARP-1-mediated cell death was detected in perinatal cytomegalovirus-infected BECs. These results provide new insight into the treatment of perinatal HCMV infection with bile duct damage.

Impact and implications: Perinatal human cytomegalovirus (HCMV) infection is associated with bile duct damage, but the underlying mechanism is still unknown. We discovered that CD14 expression is increased in biliary epithelial cells during perinatal HCMV infection and facilitates viral entry through CD55. We also detected PARP-1-mediated cell death in perinatal HCMV-infected biliary epithelial cells. We showed that blocking CD14 or inhibiting PARP-1 reduced bile duct damage and mortality in a mouse model of murine cytomegalovirus infection. Our findings provide a new insight into therapeutic strategies for perinatal HCMV infection.

Keywords: Biliary epithelial cells; CD14; CD55; Cytomegalovirus; PARP-1; Perinatal period.


Conflict of interest statement

The authors have declared that no conflict of interest exists. Please refer to the accompanying ICMJE disclosure forms for further details.

Figures

None
Graphical abstract
Fig. 1
Fig. 1
Perinatal HCMV infection is accompanied by bile duct injury. (A) Number of HCMV+ and HCMV− patients in males and females. (B) Number of HCMV+ and HCMV− patients in different age group. (C) Percentage of HCMV+ patients in each age group. (D) Levels of the bile duct damage-related molecules in the blood of patients with perinatal HCMV infection. Levels of significance: γ-GT: ∗∗∗p <0.0001; DBIL: ∗∗∗p <0.0001; TBA: ∗∗∗p <0.0001 (Mann–Whitney U test). (E) Representative images of BALB/c mice on Day 14 after MCMV inoculation on Day 1 (saline: n = 20; MCMV: n = 20) or Day 10 (saline: n = 18; MCMV: n = 20) after birth. (F) Representative images of the liver surface in each group on Day 14. (G) Levels of bile duct damage-related molecules in each group on Day 14. Day 1 infected (saline: n = 4; MCMV: n = 5); Day 10 infected (saline: n = 6; MCMV: n = 6). Levels of significance: γ-GT: ∗p = 0.0159, n.s. >0.9999; DBIL: ∗p = 0.0236, n.s. = 0.1504; TBA: ∗∗p = 0.0060, n.s. = 0.6015 (two-tailed Student’s t test). (H) Representative images and quantification of CK19 protein and MCMV IE1 gene double staining of the livers of mice in each group on Day 14. n = 4. Levels of significance: ∗∗∗p <0.0001; ∗p = 0.0216 (two-tailed Student’s t test). Scale bar: 50 μm. (I) The total cell death (Annexin-V+, 7-AAD+, and double+) of EpCAM+ BECs in the livers of mice in each group on Day 14 detected by flow cytometry. n = 4. Levels of significance: early apoptotic, Day 1: n.s. = 0.9388, Day 10: n.s. = 0.9190; late apoptotic, Day 1: ∗∗p = 0.0012, Day 10: n.s. = 0.6926; total cell death, Day 1: ∗∗∗p = 0.0006, Day 10: n.s. = 0.6792 (two-tailed Student’s t test). 7-AAD, 7-Aminoactinomycin D; BEC, biliary epithelial cell; CK19, cytokeratin 19; DBIL, direct bilirubin; EpCAM, epithelial cell adhesion molecule; FITC, fluorescein isothiocyanate; γ-GT, γ-glutamyl transpeptidase; HCMV, human cytomegalovirus; HPF, high power field; MCMV, murine cytomegalovirus; TBA, total bile acid.
Fig. 2
Fig. 2
HCMV infection in F-BECs causes cell death. (A) Representative images of I-BECs and F-BECs cocultured with HCMV at Days 4, 7, and 10. n = 3. (B and C) The total cell death (Annexin-V+, 7-AAD+, and double+) of I-BEC and F-BEC on Day 4 was detected by flow cytometry. n = 3. Levels of significance: early apoptotic, I-BEC: n.s. = 0.2170, F-BEC: ∗∗p = 0.0082, I-BEC + HCMV vs. F-BEC + HCMV: n.s. = 0.2093; late apoptotic, I-BEC: ∗∗∗p <0.0001, F-BEC: ∗∗∗p <0.0001, I-BEC + HCMV vs. F-BEC + HCMV: ∗∗∗p <0.0001; total cell death, I-BEC: ∗p = 0.0193, F-BEC: ∗∗∗p <0.0001, I-BEC + HCMV vs. F-BEC + HCMV: ∗∗∗p <0.0001 (one-way ANOVA). (D) Relative viral load detected by qPCR in the cell culture supernatants of I-BECs and F-BECs cocultured with HCMV on Day 3. n = 3. (E and F) HCMV pp65 mRNA (n = 3) and pp65 protein levels, and IE1 protein level (n = 10) in I-BECs and F-BECs cocultured with HCMV on Day 3 detected by qPCR and immunofluorescence staining. Levels of significance: ∗p =0.0186 (D); ∗∗∗p <0.0001 (E); ∗∗∗p <0.0001 (F) (two-tailed Student’s t test). Scale bar: 25 μm. BEC, biliary epithelial cell; F-BEC, fetal biliary epithelial cell; HCMV, human cytomegalovirus; I-BEC, infant biliary epithelial cell; qPCR, quantitative PCR.
Fig. 3
Fig. 3
CD14 produced by F-BECs promotes HCMV infection. (A) Heatmap showing the significantly differentially expressed proteins in F-BECs and I-BECs on Day 3. n = 3. (B and C) The proteins with upregulated expression in F-BECs compared with I-BECs were analyzed using Metascape and GO DisGeNET, respectively, and the proteins involved in the biological functions and related diseases are shown. (D and E) CD14 mRNA and protein expression in F-BECs and I-BECs on Day 3 detected by qPCR and immunofluorescence staining. n = 3. Level of significance: ∗∗∗p <0.0001 (two-tailed Student’s t test). Scale bar: 25 μm. (F and G) mCD14 and sCD14 protein levels in F-BECs and I-BECs with or without HCMV infection on Day 3 detected by ELISA. n = 3. Levels of significance: ∗p = 0.0163, ∗∗p = 0.0016 (F); ∗p = 0.0119, ∗∗∗p = 0.0006 (G) (one-way ANOVA). (H and I) HCMV pp65 mRNA (n = 3) and pp65 protein levels, and IE1 protein level (n = 10) in F-BECs treated with control siRNA or CD14 siRNA cocultured with HCMV on Day 3 detected by qPCR and immunofluorescence staining. Levels of significance: ∗p = 0.0157 (H); ∗∗∗p <0.0001 (I) (two-tailed Student’s t test). Scale bar: 25 μm. BEC, biliary epithelial cell; F-BEC, fetal biliary epithelial cell; GO, gene ontology; HCMV, human cytomegalovirus; I-BEC, infant biliary epithelial cell; mCD14, membrane CD14; qPCR, quantitative PCR; sCD14, soluble CD14.
Fig. 4
Fig. 4
MCMV infection causes bile duct damage in mice via CD14. (A) Representative images of the mice with a C57BL/6 background in the WT + saline (n = 20), WT + MCMV (n = 15), CD14−/− + saline (n = 17), and CD14−/− + MCMV (n = 22) groups on Day 14 after inoculation with MCMV on Day 1 after birth. (B) Representative images of the liver surface in each group on Day 14. (C) The levels of bile duct damage-related molecules in each group on Day 14. n = 4. Levels of significance: γ-GT: WT + saline vs. WT + MCMV: ∗∗∗p <0.0001, WT + MCMV vs. CD14−/− + MCMV: ∗∗∗p <0.0001; DBIL: WT + saline vs. WT + MCMV: n.s. = 0.0501, WT + MCMV vs. CD14−/− + MCMV: ∗p = 0.0444; TBA: WT + saline vs. WT + MCMV: ∗∗∗p <0.0001, WT + MCMV vs. CD14−/− + MCMV: ∗∗∗p <0.0001 (one-way ANOVA). (D) Representative images and quantification of CK19 protein and MCMV IE1 gene double staining of the livers of mice in each group on Day 14. n = 4. Levels of significance: WT + saline vs. WT + MCMV: ∗∗∗p = 0.0005; WT + MCMV vs. CD14/− + MCMV: ∗∗∗p = 0.0010 (one-way ANOVA). Scale bar: 50 μm. (E) The total cell death (Annexin-V+, 7-AAD+, and double+) of EpCAM+ BECs in the livers of mice in each group on Day 14 detected by flow cytometry. n = 4. Levels of significance: early apoptotic, WT + saline vs. WT + MCMV: ∗p = 0.0104, WT + MCMV vs. CD14−/− + MCMV: ∗p = 0.0427; late apoptotic, WT + saline vs. WT + MCMV: ∗∗∗p <0.0001, WT + MCMV vs. CD14−/− + MCMV: ∗∗∗p <0.0001; total cell death, WT + saline vs. WT + MCMV: ∗∗∗p <0.0001, WT + MCMV vs. CD14/− + MCMV: ∗∗∗p <0.0001 (one-way ANOVA). BEC, biliary epithelial cell; CK19, cytokeratin 19; DBIL, direct bilirubin; EpCAM, epithelial cell adhesion molecule; γ-GT, γ-glutamyl transpeptidase; MCMV, murine cytomegalovirus; TBA, total bile acid; WT, wild-type.
Fig. 5
Fig. 5
CD14 promotes HCMV entry into cells partially via CD55 receptor. (A) Heatmap showing the significantly differentially expressed proteins in F-BECs and F-BECs + HCMV on Day 4. n = 4. (B and C) The proteins with upregulated expression in F-BECs + HCMV compared with F-BECs were analyzed using Metascape and GO DisGeNET, respectively, and the proteins involved in biological functions and related diseases are shown. (D and E) CD55 mRNA and protein expression in F-BECs and F-BECs + HCMV on Day 3 detected by qPCR and immunofluorescence staining. n = 3. Levels of significance: ∗p = 0.0120 (two-tailed Student’s t test). Scale bar: 25 μm. (F and G) HCMV pp65 mRNA and pp65 protein levels (n = 3), and IE1 protein level (n = 10) in F-BECs treated with control siRNA or CD55 siRNA cocultured with HCMV on Day 3 detected by qPCR and immunofluorescence staining. Levels of significance: ∗p = 0.0446 (F); ∗∗∗p <0.0001 (G) (two-tailed Student’s t test). Scale bar: 25 μm. (H and I) The interaction of CD14 and CD55 in F-BECs cocultured with HCMV on Day 3 detected by coimmunoprecipitation. n = 3. (J and K) HCMV pp65 mRNA (control-siRNA: n = 6, control-siRNA + sCD14: n = 3, CD55-siRNA: n = 3, CD55-siRNA + sCD14: n = 5) and pp65 protein levels, and IE1 protein level (n = 10) in F-BECs treated with sCD14 and/or in the presence of CD55 siRNA cocultured with HCMV on Day 3 detected by qPCR and immunofluorescence staining. Levels of significance: control-siRNA vs. control-siRNA + sCD14: ∗p = 0.0184 (J), ∗∗∗p <0.0001 (K); control-siRNA vs. CD55-siRNA: ∗p = 0.0125 (J), ∗∗∗p <0.0001 (K); control-siRNA vs. CD55-siRNA + sCD14: n.s. = 0.9545 (J), n.s. = 0.0534 (K) (one-way ANOVA). Scale bar: 25 μm. BEC, biliary epithelial cell; F-BEC, fetal biliary epithelial cell; GO, gene ontology; HCMV, human cytomegalovirus; IB, immunoblotting; IP, immunoprecipitation; PARP-1, poly ADP-ribose polymerase-1; qPCR, quantitative PCR; sCD14, soluble CD14.
Fig. 6
Fig. 6
CD14-neutralizing antibody can alleviate damage to mouse BECs after MCMV infection. (A) Representative images of the mice with a BALB/c background in the saline (n = 18), MCMV (n = 20), saline + anti-CD14 (n = 19), and MCMV + anti-CD14 (n = 20) groups on Day 14 after inoculation with MCMV on Day 1 after birth. (B) Representative images of the liver surface in each group on Day 14. (C) The levels of bile duct damage-related molecules in each group on Day 14. n = 4. Levels of significance: γ-GT: saline vs. MCMV: ∗∗p = 0.0093, MCMV vs. MCMV + anti-CD14: ∗p = 0.0261; DBIL: saline vs. MCMV: ∗∗p = 0.0067, MCMV vs. MCMV + anti-CD14: ∗p = 0.0156; TBA: saline vs. MCMV: ∗∗∗p <0.0001, MCMV vs. MCMV + anti-CD14: ∗∗p = 0.0046; (one-way ANOVA). (D) Representative images and statistical analysis of CK19 protein and MCMV IE1 gene double immunofluorescence staining of the liver of mice in each group on Day 14. n = 4. Levels of significance: saline vs. MCMV: ∗∗∗p <0.0001; MCMV vs. MCMV + anti-CD14: ∗∗∗p <0.0001 (one-way ANOVA). Scale bar: 50 μm. (E) The total cell death (Annexin-V+, 7-AAD+, and double+) of EpCAM+ BECs in the livers of mice in each group on Day 14 detected by flow cytometry. n = 4. Levels of significance: early apoptotic, saline vs. MCMV: n.s. = 0.6269, MCMV vs. MCMV + anti-CD14: n.s. = 0.1243; late apoptotic, saline vs. MCMV: ∗∗∗p <0.0001, MCMV vs. MCMV + anti-CD14: ∗p = 0.0397; total cell death, saline vs. MCMV: ∗∗∗p <0.0001, MCMV vs. MCMV + anti-CD14: ∗∗p = 0.0097 (one-way ANOVA). BEC, biliary epithelial cell; CK19, cytokeratin 19; DBIL, direct bilirubin; EpCAM, epithelial cell adhesion molecule; γ-GT, γ-glutamyl transpeptidase; MCMV, murine cytomegalovirus; TBA, total bile acid; WT, wild-type.
Fig. 7
Fig. 7
The PARP-1 inhibitor can improve damage to F-BECs after HCMV infection. (A) Representative electron microscopy images of F-BEC cocultured with HCMV on Day 3. n = 3. Scale bar: 4 μm. (B) The protein expression of PARP-1, cleaved PARP-1, PAR, and AIF in F-BECs cocultured with HCMV on Day 3 detected by Western blot. n = 3. Levels of significance: ∗∗∗p = 0.0001 (PARP-1), ∗∗∗p <0.0001 (cleaved PARP-1), ∗∗∗p <0.0001 (PAR), ∗∗∗p = 0.0009 (AIF) (two-tailed Student’s t test). (C) Representative images of F-BECs cocultured with HCMV with PARP-1 inh. on Day 3. The proliferation of F-BECs was detected by the MTT assay. n = 3. Levels of significance: n.s. = 0.1339, F-BEC vs. F-BEC + HCMV: ∗∗∗p <0.0001, F-BEC + HCMV vs. F-BEC + HCMV + PARP-1 inh.: ∗∗∗p <0.0001 (one-way ANOVA). (D) The total cell death (Annexin-V+, 7-AAD+, and double+) of F-BECs in each group on Day 3 detected by flow cytometry. n = 3. Levels of significance: early apoptotic, F-BEC vs. F-BEC + PARP-1 inh.: n.s. >0.9999, F-BEC vs. F-BEC + HCMV: n.s. = 0.5528, F-BEC + HCMV vs. F-BEC + HCMV + PARP-1 inh.: n.s. = 0.4400; late apoptotic, F-BEC vs. F-BEC + PARP-1 inh.: n.s. = 0.7946, F-BEC vs. F-BEC + HCMV: ∗∗∗p <0.0001, F-BEC + HCMV vs. F-BEC + HCMV + PARP-1 inh.: ∗∗∗p <0.0001; total cell death, F-BEC vs. F-BEC + PARP-1 inh.: n.s. = 0.7623, F-BEC vs. F-BEC + HCMV: ∗∗∗p <0.0001, F-BEC + HCMV vs. F-BEC + HCMV + PARP-1 inh.: ∗∗∗p <0.0001 (one-way ANOVA). AIF, apoptosis-inducing factor; BEC, biliary epithelial cell; F-BEC, fetal biliary epithelial cell; HCMV, human cytomegalovirus; inh., inhibitor; PAR, poly ADP-ribose; PARP-1, poly ADP-ribose polymerase-1.

Similar articles

References

    1. Zuhair M., Smit G.S.A., Wallis G., et al. Estimation of the worldwide seroprevalence of cytomegalovirus: a systematic review and meta-analysis. Rev Med Virol. 2019;29 - PubMed
    1. Fang F.Q., Fan Q.S., Yang Z.J., et al. Incidence of cytomegalovirus infection in Shanghai, China. Clin Vaccin Immunol. 2009;16:1700–1703. - PMC - PubMed
    1. Liu L.W., Qian J.H., Zhu T.W., et al. [A 5-year retrospective clinical study of perinatal cytomegalovirus infection] Zhongguo Dang Dai Er Ke Za Zhi. 2016;18:99–104. - PMC - PubMed
    1. Wood A.M., Hughes B.L. Detection and prevention of perinatal infection: cytomegalovirus and Zika virus. Clin Perinatol. 2018;45:307–323. - PubMed
    1. Coclite E., Di Natale C., Nigro G. Congenital and perinatal cytomegalovirus lung infection. J Matern Fetal Neonatal Med. 2013;26:1671–1675. - PubMed